Pinball: Switch Matrix Component (Part 1)

In the post entitled “Pinball: Matrix LEDs Component” I took you through the steps to create an LED Component.  In this post I will take you through the steps to do the same thing, create a component, for the Switch Matrix that I talked about in the last post.  Since I did the LED component I figured out how to embed the pins into the component and have a variable number.  I am going to go back and fix the LED component.

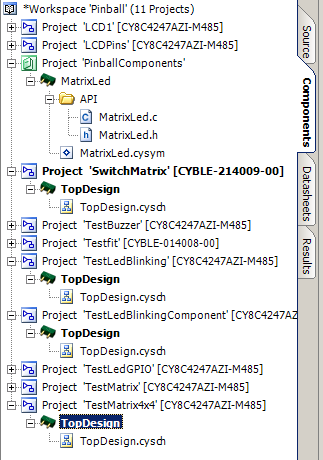
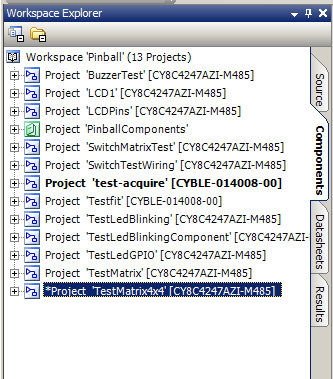
The first step to create the Switch Matrix Component is to click on the “Component” tab so that you can create a new component in the “Pinball Components” library.

Screen Shot 2016-09-06 at 7.07.40 AM

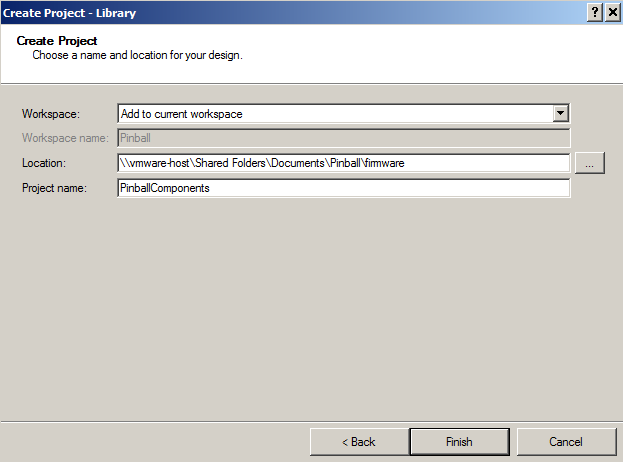
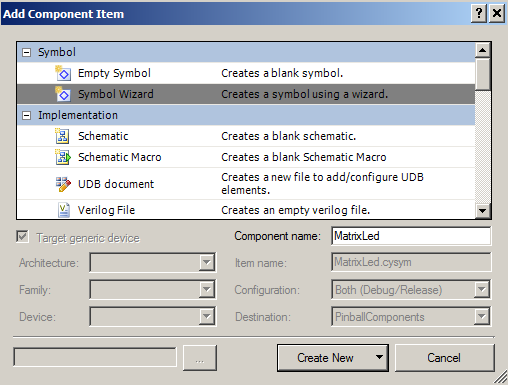
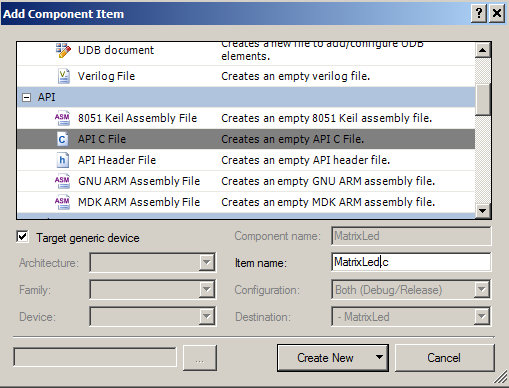
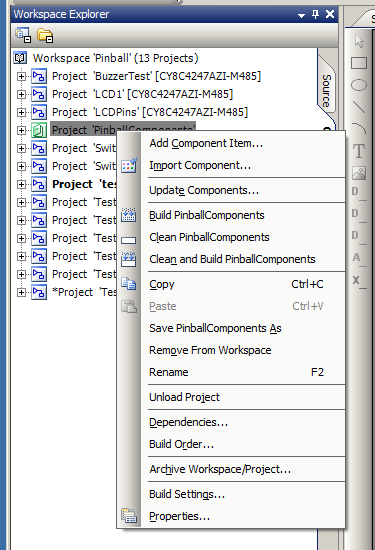
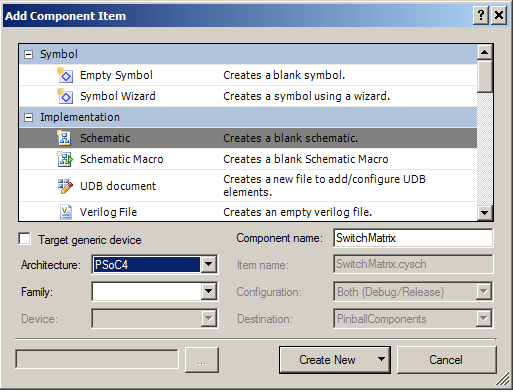
Now, add a new component to the library by right clicking the “Pinball Components” library and selecting “Add Component Item…”

Screen Shot 2016-09-06 at 7.08.14 AM

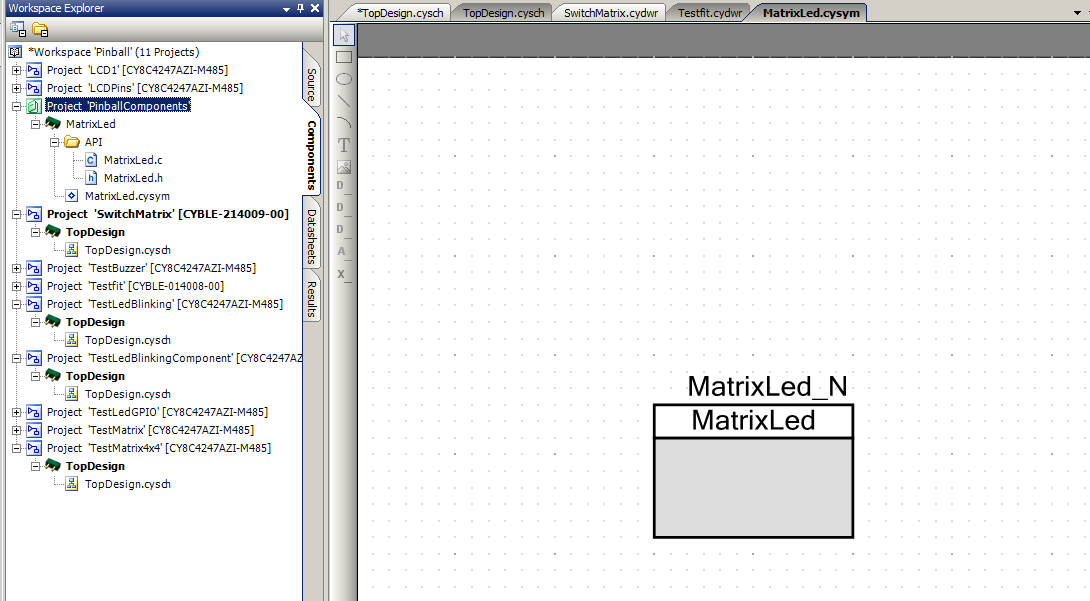
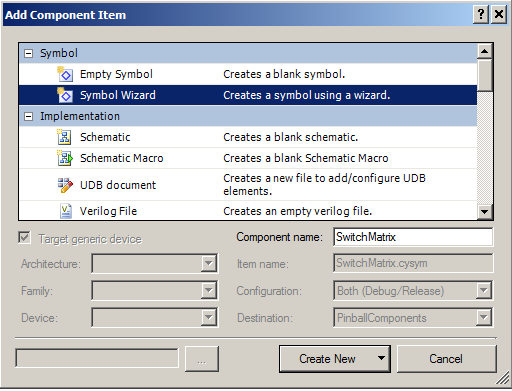
Start by creating a Symbol for the “SwitchMatrix” component.  If you don’t want to draw all of the parts of the symbol then just use the automatic “Symbol Wizard”.

Screen Shot 2016-09-06 at 7.06.39 AM

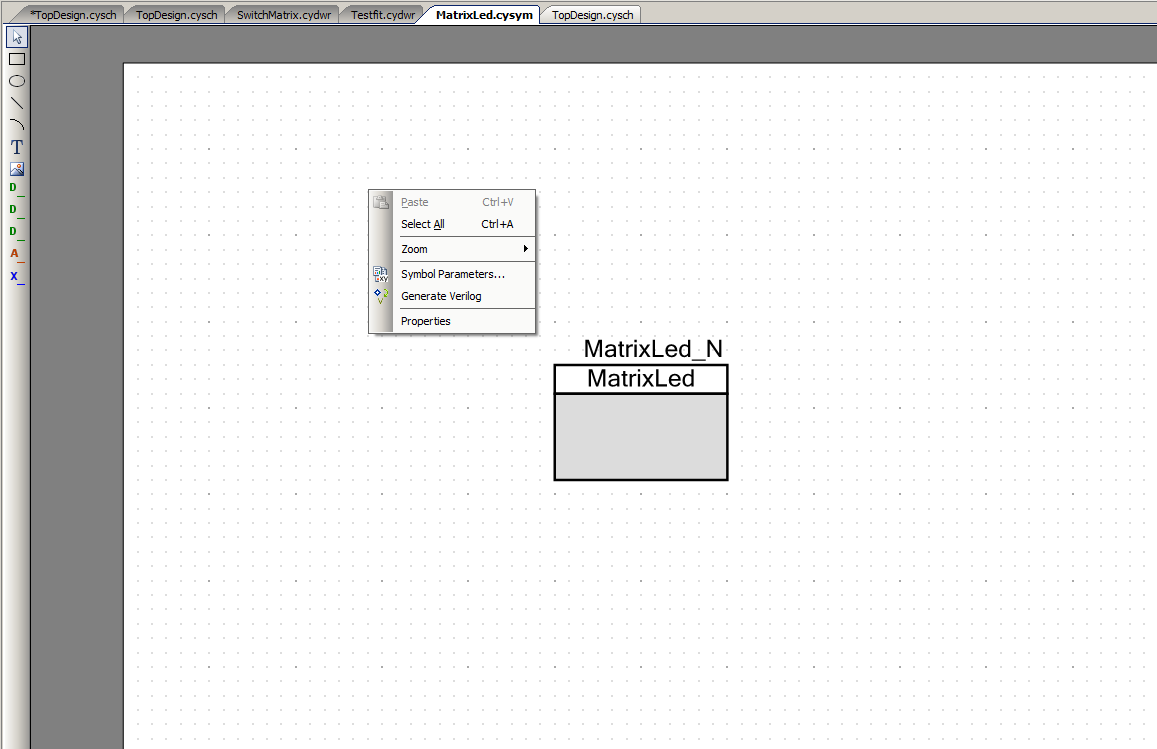
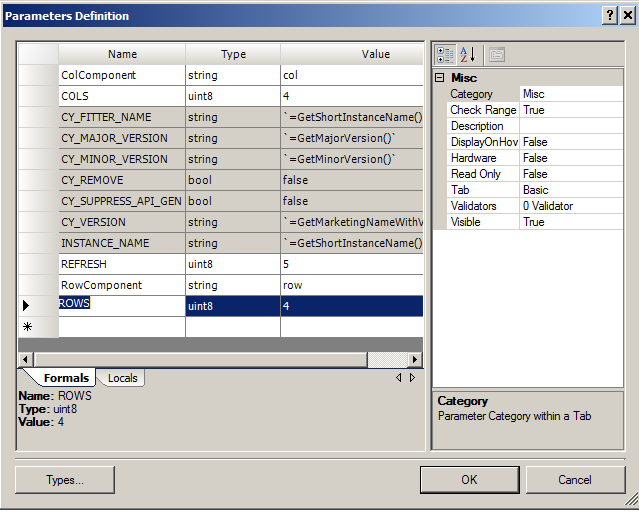
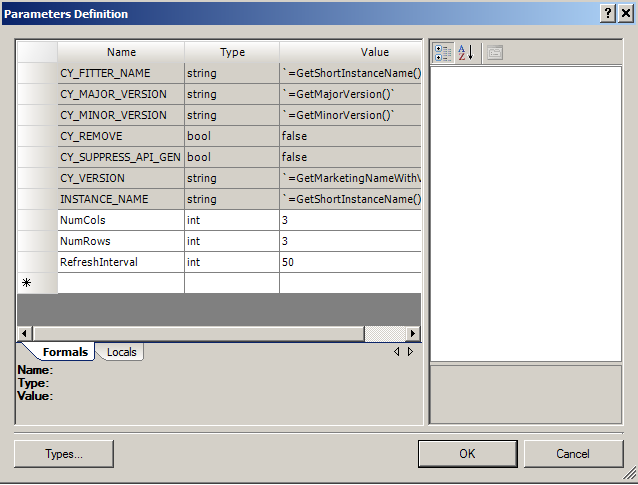
Next, add three component parameters, which will be editable by the user of the component.  Do this by right clicking on the blank canvas part of the symbol editor and select “Symbol Parameters…”.  Add NumCols, NumRows, and RefreshInterval.  These will be usable in your source code as $NumCols, $NumRows and $RefreshInterval.

Screen Shot 2016-09-06 at 7.11.15 AM

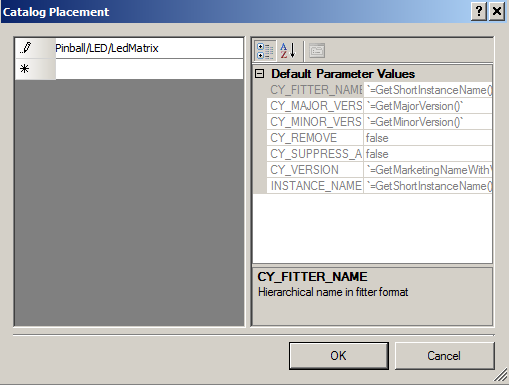
Then, put the component into the right place in the component catalog by right clicking on the blank canvas in the symbol editor and selecting “Properties”

Screen Shot 2016-09-06 at 7.10.35 AM

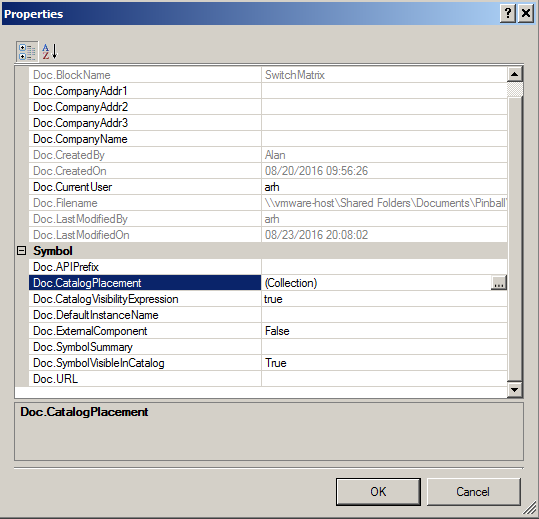
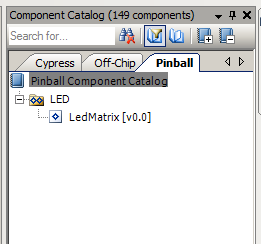
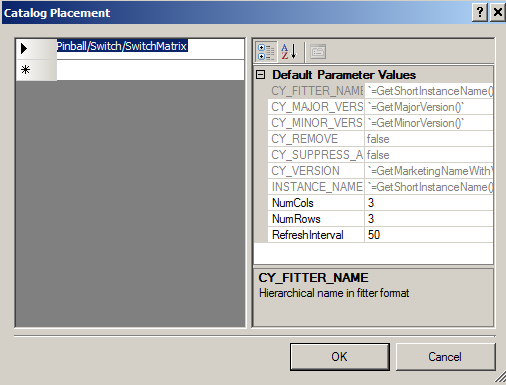
Select the “Doc.CatalogPlacement” and type in the place where you want the component to show up in the Component browser.  In this case we want it in the “Pinball” tab, in the “Switch” category.  The name of the component will be “SwitchMatrix”

Screen Shot 2016-09-06 at 7.10.59 AM

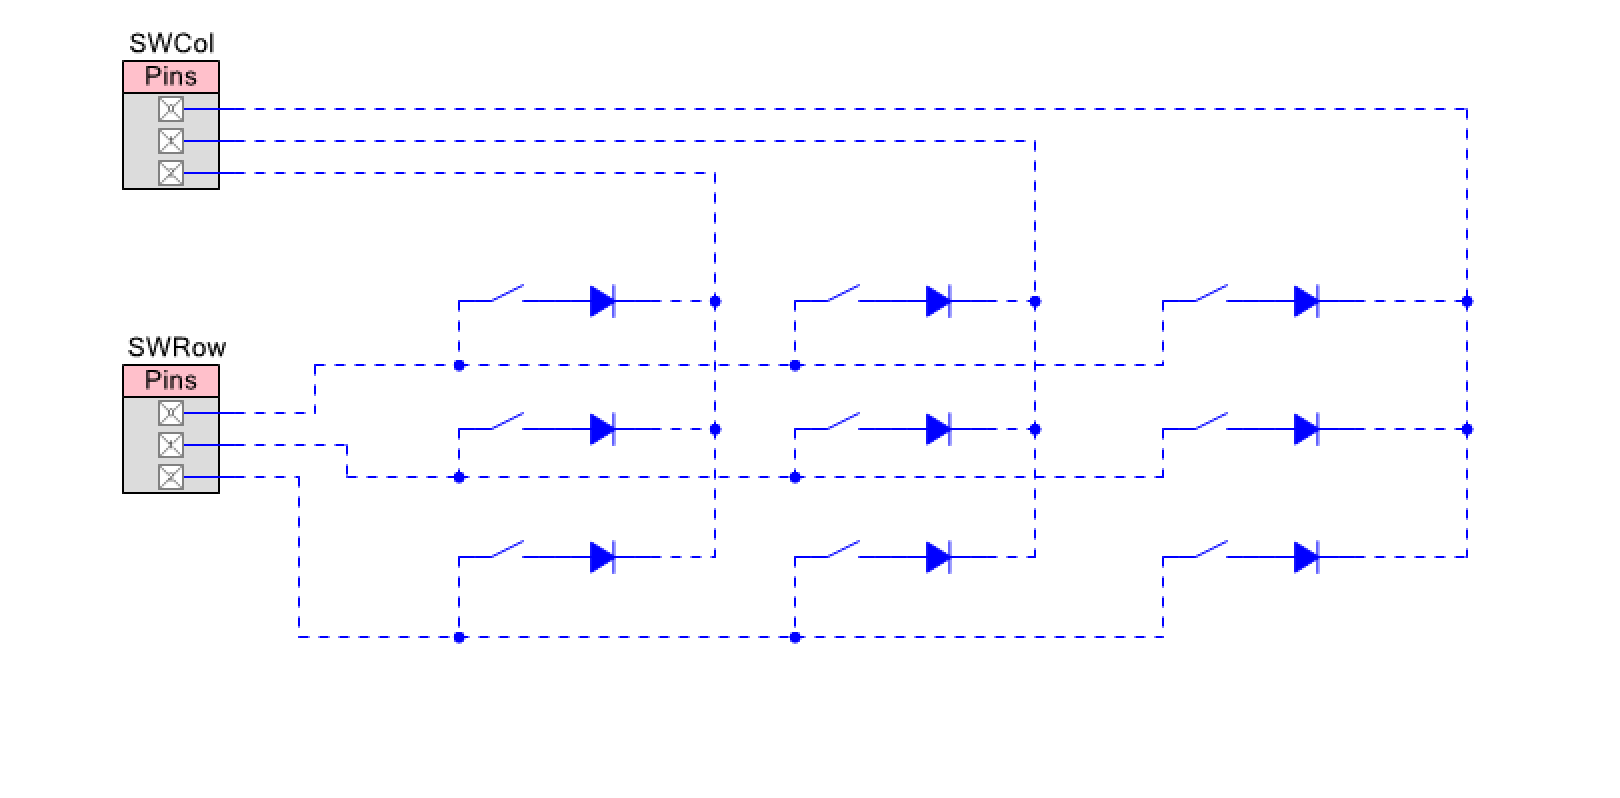
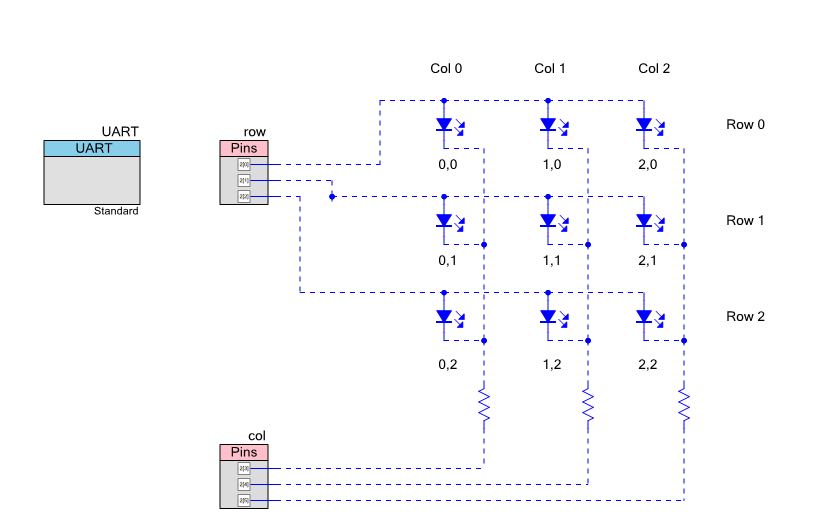
For this component I want the user to be able to change the number of rows and columns.  I will do this by embedding the row and col digital input/output pins inside of the component.  And, the row,col pin components will be busses so that I can change the number.  First, you need to add a schematic to your component to hold the pins.

Screen Shot 2016-09-06 at 7.15.29 AM

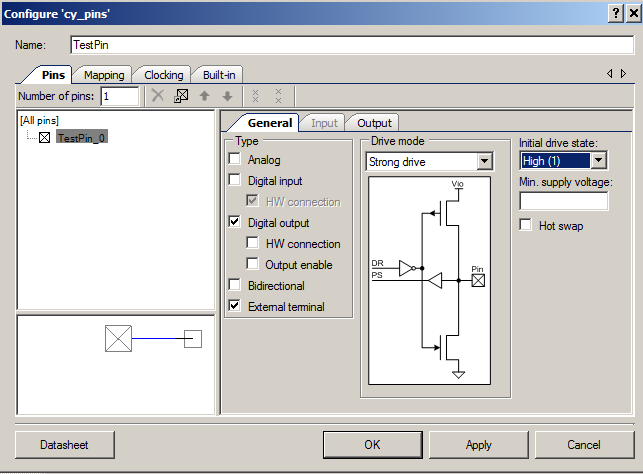
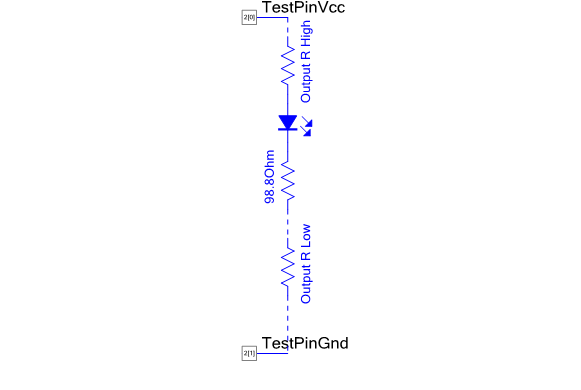
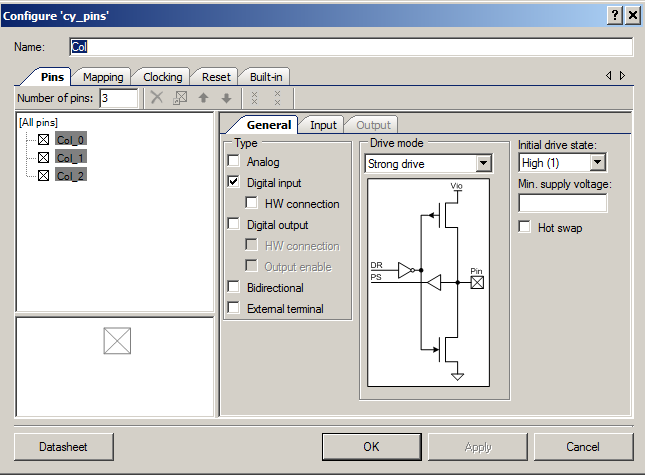
I need to place a digital input pin (for the rows).  I select the number of pins to be 3 (this parameter will be changed by our customizer).  Also turn on the pull up resistors.

Screen Shot 2016-09-06 at 9.02.25 AM

Then I place a digital output pin for the columns.

Screen Shot 2016-09-06 at 9.06.10 AM

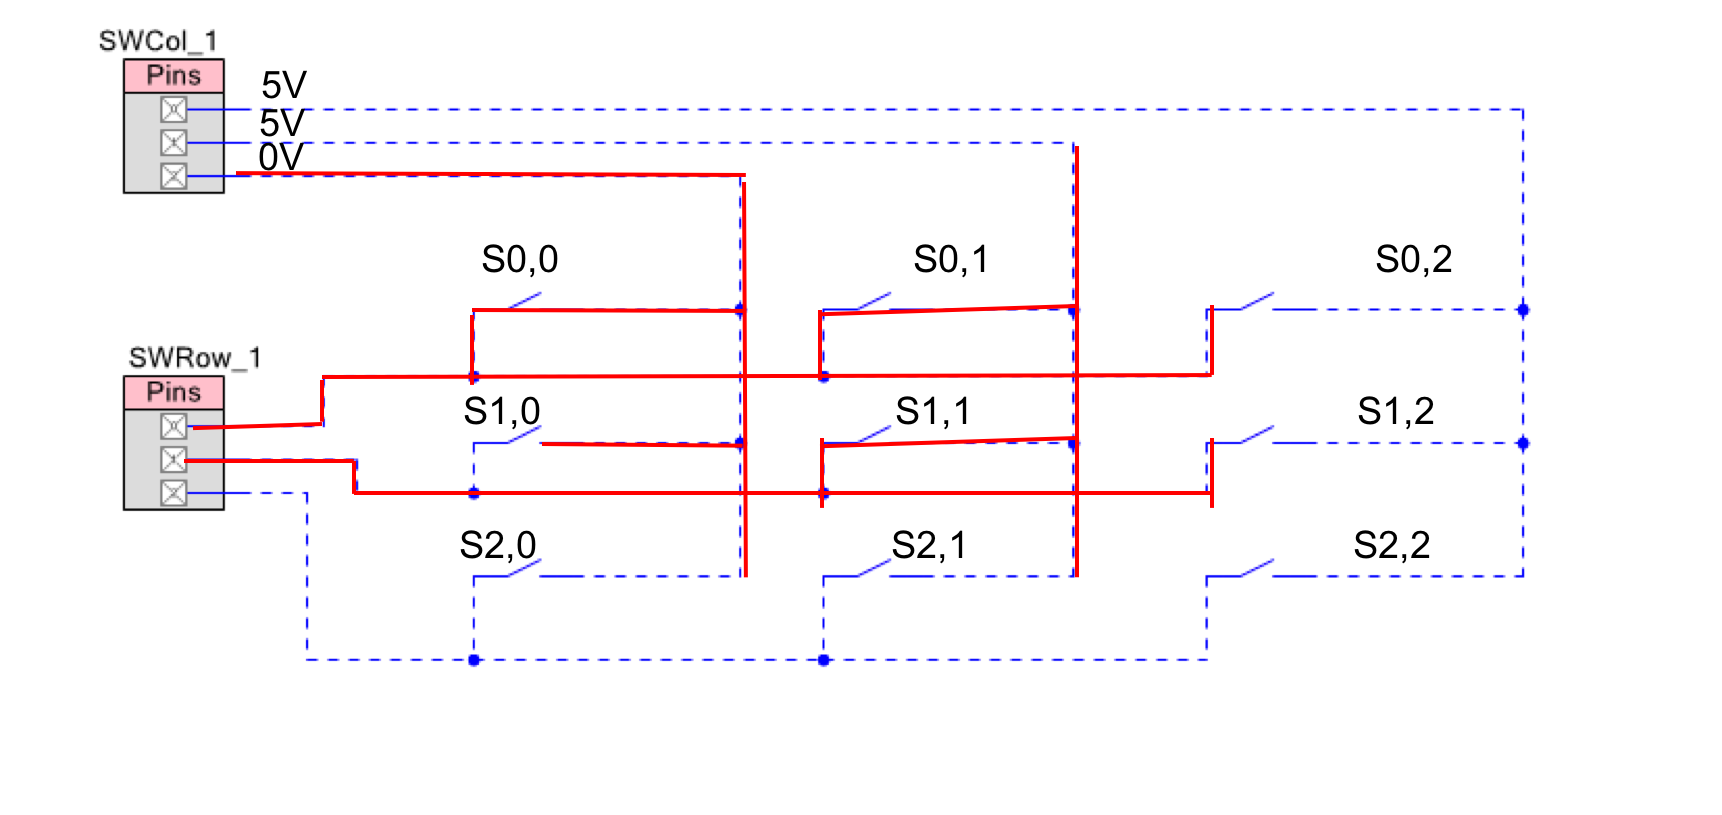
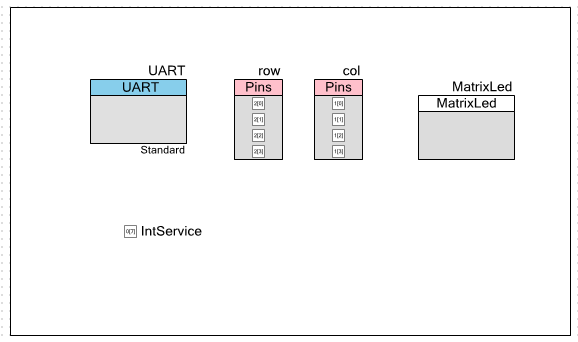
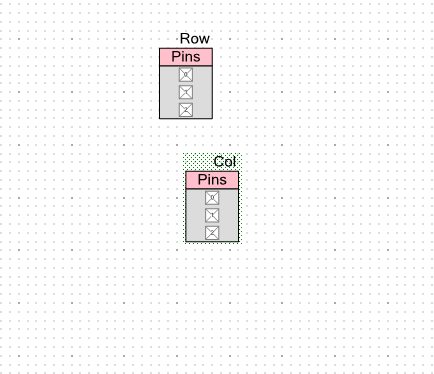
When I am done I will have a schematic that looks like this:

Screen Shot 2016-09-06 at 9.07.22 AM

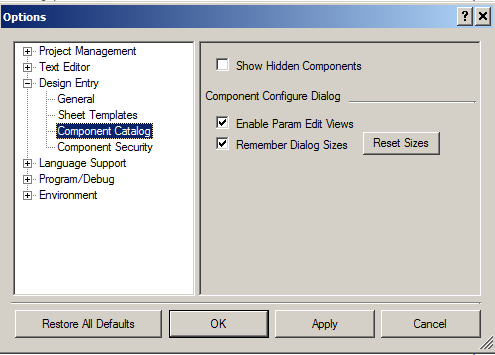
Now I need to fix things up so that the user of the component can edit the number of pins.  To do this, I need to be able to edit the hidden parameter on the Cypress pins component which has the property of the number of pins in the bus.  To do this I first need to enable the secret menu which lets me edit the raw parameter.  This is on the Tools->options->design entry->component catalog menu.  You can see the “Enable Param Edit Views”.  By selecting this option you will be able to edit the raw parameter values on the components.

Screen Shot 2016-09-06 at 7.47.49 AM

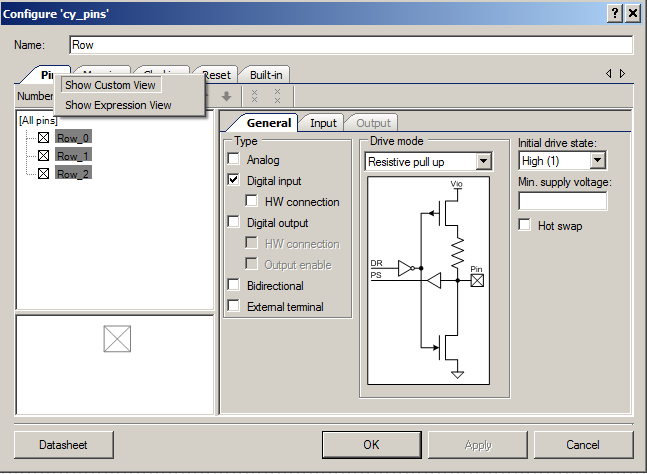
Once you have enabled the menu you will be able to right click on the “Pins” tab of the component and show the “Show Expression View”

Screen Shot 2016-09-06 at 7.16.33 AM

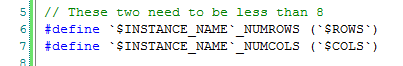
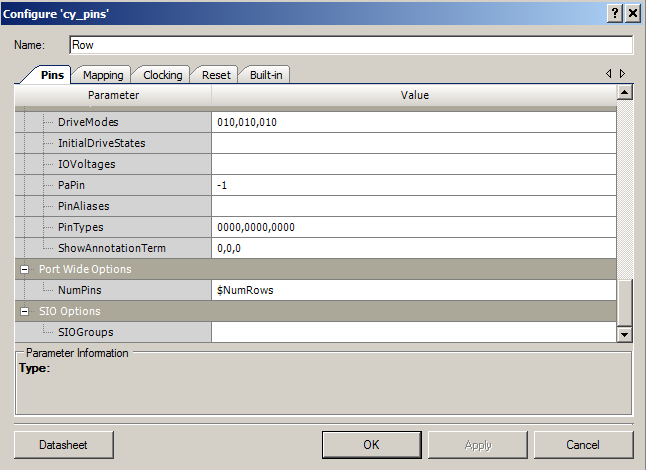
Instead of the graphical interface to the component (shown above) you will have a list of the raw parameters (shown below)  Scroll down to “NumPins” and change it to the parameter that I put onto the symbol, “$NumRows”

Screen Shot 2016-09-06 at 7.16.50 AM

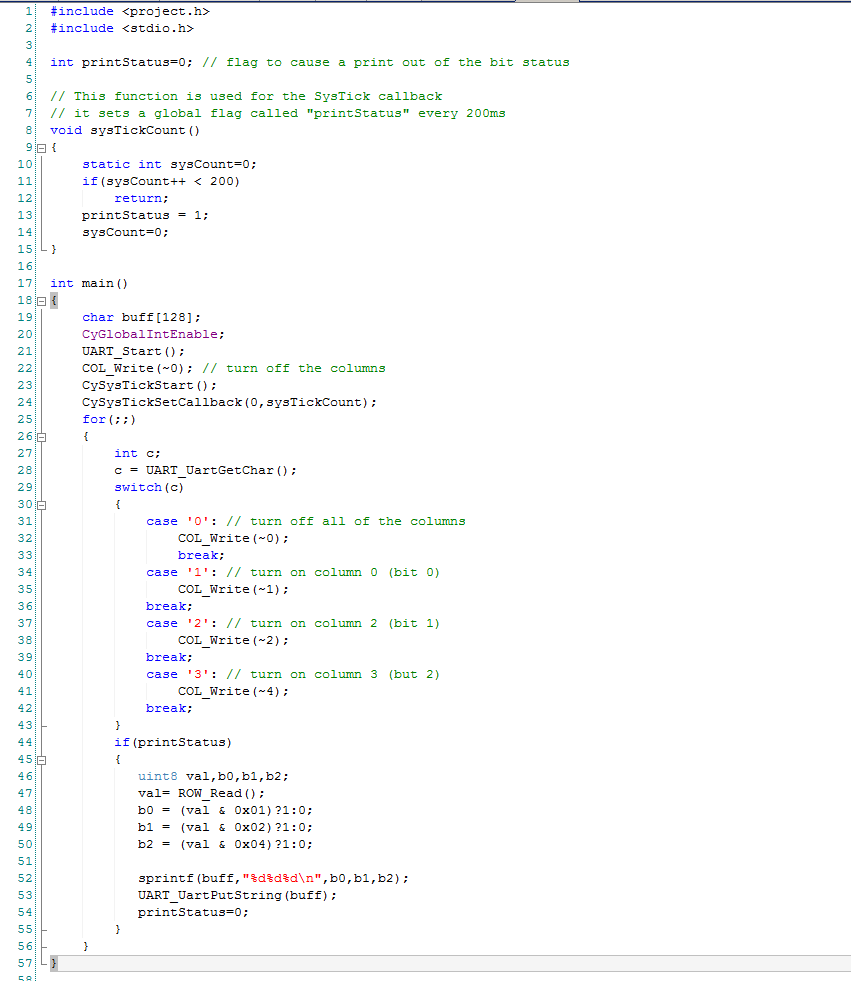
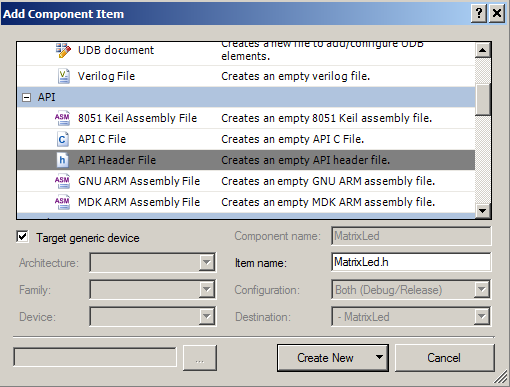
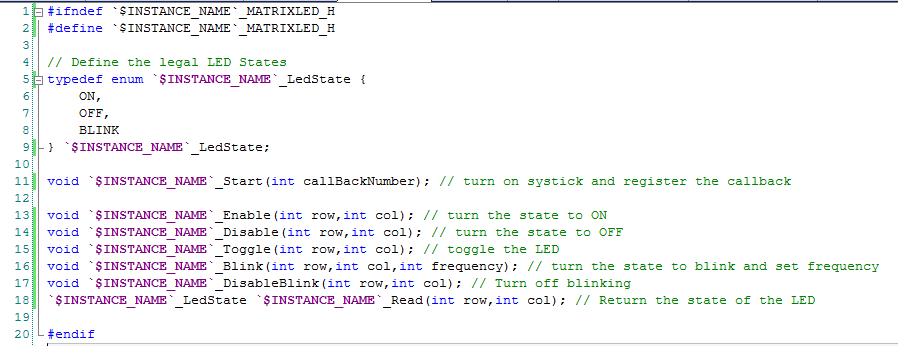
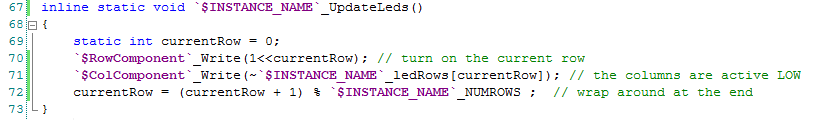
Lastly, do exactly the same thing for another pin for the Columns.  In the next post I will show and explain the source code for the component.

You can find all of the source code and files at the IOTEXPERT site on github.

Index Description
Pinball: Newton's Attic Pinball An introduction to the project and the goals
Pinball: Lotsa Blinking LEDs Everyone needs a bunch of LEDs on their Pinball Machine
Pinball: Matrix LEDs (Part 1) Saving PSoC pins by using a matrix scheme
Pinball: Matrix LEDs (Part 2) Solving some problems with the matrix
Pinball: Matrix LEDs Component How to turn the Matrix LED into a component
Pinball: A Switch Matrix Implementing a bunch of switches
Pinball: Switch Matrix Component (Part 1) The switch matrix component implementation
Pinball: Switch Matrix Component (Part 2) The firmware for matrix component
Pinball: Switch Matrix Component (Part 3) Test firmware for the matrix component
Pinball: The Music Player (Part 1) The schematic and symbol for a Music Player component
Pinball: The Music Player (Part 2) The Public API for the Music Player component
Pinball: The Music Player (Part 3) The firmware to make the sweet sweet music
Pinball: The Music Player (Part 4) The test program for the music player
Pinball: The Motors + HBridge Using an Bridge to control DC Motors
Pinball: The Eagle Schematic All of the circuits into an Eagle schematic
Pinball: The Printed Circuit Board 1.0 The first Eagle PCB layout of the printed circuit board
Pinball: The PCB Version 1.0 Fail Problems with the first version of the Eagle PCB layout
Pinball: PCB Layout 1.2 Updates using Eagle Fixing the errors on the first two versions of the Eagle PCB
Pinball: Assemble and Reflow the 1.2 PCB Assembling the Eagle PCB
Pinball: Testing the Eagle PCB Firmware to test the newly built Pinball printed circuit board
Pinball: Debugging the Motor Driver Fixing the motor driver PSoC project
Pinball: Hot-Air Reworking the Accelerometer Solder Using a Hot-Air Rework tool to reflow a QFN
Pinball: Debugging the LM317 Power Supply- A Tale of Getting Lucky Debugging the LM317/LM117 power supply

Pinball: A Switch Matrix

In the last several posts I talked in detail about reducing the number of pins required to drive a bunch of LEDs by putting them into a matrix.  In this post I am going to talk about doing exactly the same thing for switches.  For the pinball machine I would like to have at least 9 switches, so I will arrange them into a 3×3 matrix which will require only 6 pins.

Screen Shot 2016-08-15 at 8.20.14 AM

With a few minor differences, the system works the same as the LED matrix.  First you enable the pull-up resistors on the SWRow pins.  This forces a weak 5v onto the row pins.  Then you enable one column at a time by writing a “0” which forces 0v onto that column pin.  You also write a 1 onto the other column pins which forces 5V onto those pins.  You can see in the picture below that if you press the switch labeled S0,0 you will end up with 0V on the top input to the SWRow pin which will be read as 0.  With nothing else pressed you will end up with 1s being read on the other two row pins (because of the pullup resistors).

Picture-s1

So what are the diodes for?  If you don’t have the diodes then you have what is called the ghosting problem.  Ghosting means that when you press two switches at the same it will appear as a third different switch-meaning you will have a “ghost” press.   In the example diagram below I do exactly the same thing as before, except I also press Switch 0,1 and Switch 1,1.  Without the diodes this has the effect of propagating a 0 onto the input of Row 1 which makes it appear as if S1,0 is active even though it is not.

Picture-nodiodes

Here is the same picture with the diodes in.  You can see that the diode next to S0,1 and S1,1 are reversed biased and don’t conduct the 0.

Picture-diodes

To make the system I once again enlist my Lab Technician Nicholas and his friend Anna.

IMG_3012

And after some time and help and not too many burns:

img_3083 img_3082

Once I have the switch matrix test board setup, Ill build a project to test it.  The project is called “SwitchTestWiring”.  The firmware uses the systick timer to trigger a printout of the data every 200ms.  I then use the UART to read 0,1,2,3 to turn on the corresponding column.  Notice that I built a 3×3 test.

screen-shot-2016-09-08-at-8-02-59-am

In the next posts Ill build a component to run the matrix:

You can find all of the source code and files at the IOTEXPERT site on github.

Index Description
Pinball: Newton's Attic Pinball An introduction to the project and the goals
Pinball: Lotsa Blinking LEDs Everyone needs a bunch of LEDs on their Pinball Machine
Pinball: Matrix LEDs (Part 1) Saving PSoC pins by using a matrix scheme
Pinball: Matrix LEDs (Part 2) Solving some problems with the matrix
Pinball: Matrix LEDs Component How to turn the Matrix LED into a component
Pinball: A Switch Matrix Implementing a bunch of switches
Pinball: Switch Matrix Component (Part 1) The switch matrix component implementation
Pinball: Switch Matrix Component (Part 2) The firmware for matrix component
Pinball: Switch Matrix Component (Part 3) Test firmware for the matrix component
Pinball: The Music Player (Part 1) The schematic and symbol for a Music Player component
Pinball: The Music Player (Part 2) The Public API for the Music Player component
Pinball: The Music Player (Part 3) The firmware to make the sweet sweet music
Pinball: The Music Player (Part 4) The test program for the music player
Pinball: The Motors + HBridge Using an Bridge to control DC Motors
Pinball: The Eagle Schematic All of the circuits into an Eagle schematic
Pinball: The Printed Circuit Board 1.0 The first Eagle PCB layout of the printed circuit board
Pinball: The PCB Version 1.0 Fail Problems with the first version of the Eagle PCB layout
Pinball: PCB Layout 1.2 Updates using Eagle Fixing the errors on the first two versions of the Eagle PCB
Pinball: Assemble and Reflow the 1.2 PCB Assembling the Eagle PCB
Pinball: Testing the Eagle PCB Firmware to test the newly built Pinball printed circuit board
Pinball: Debugging the Motor Driver Fixing the motor driver PSoC project
Pinball: Hot-Air Reworking the Accelerometer Solder Using a Hot-Air Rework tool to reflow a QFN
Pinball: Debugging the LM317 Power Supply- A Tale of Getting Lucky Debugging the LM317/LM117 power supply

Pinball: Matrix LEDs Component

In the previous post I showed you how to build firmware to drive the LED matrix.  That firmware is in my TestMatrixBlinking project as led.h and led.c.  All that is pretty cool, but what I would really like is a component that is in a library, that I can configure the number of rows/columns and the update frequency–just like the other PSoC Components.  To do that I will go through the following steps

  1. Create a new library project
  2. Create a new component and symbol in the library
  3. Add the led.h to the header of the component
  4. Add the led.c to the implementation for the component
  5. Update the component properties to have the update frequency, number of rows, number columns etc.
  6. Add a reference the library in a test project
  7. Make the test project

First create a new project in the workspace.  In this case, I will build a library project.  A library project can’t be programmed into a board, but instead is used to hold components.

Screen Shot 2016-08-14 at 8.29.33 AM

Ill name the project “PinballComponents”

Screen Shot 2016-08-14 at 8.30.05 AM

Then I will create a new component.  To do this click on the components tab in the workspace explorer (in this picture you can see that I already added the new component)

Screen Shot 2016-08-14 at 2.16.55 PM

Next right click on the “PinballComponents” tab and select “Add Component Item”.  Then pick Symbol Wizard and name your Component “MatrixLed”.

Screen Shot 2016-08-14 at 8.31.02 AM

After you do that you will have “MatrixLed.cysym” in your library project.

Screen Shot 2016-08-14 at 2.19.43 PM

Now you need an API header file for the component.  To get this, right click MatrixLed and do “Add Component Item”.  Then select “API Header File” and tell it your header file will be MatrixLed.h

Screen Shot 2016-08-14 at 8.31.46 AM

Now copy the source code from led.h into MatrixLed.h. Replace “MatrixLed” with “`$INSTANCE_NAME`”.  When PSoC Creator builds your project it will replace the $INSTANCE_NAME with whatever you name your instance.

Screen Shot 2016-08-14 at 9.08.35 AM

The next step is to create the implementation.  To do this right click on MatrixLed and then select “Add Component Item”.  Pick “API C File” and name it MatrixLed.c

Screen Shot 2016-08-14 at 8.32.25 AM

Copy the source from “led.c” into the “MatrixLed.c”. Replace MatrixLed with “`$INSTANCE_NAME`” just like you did in the .h file.

Screen Shot 2016-08-14 at 9.13.23 AM

Now, right click on a blank space on the canvas in the symbol screen, then select “Properties”.  On the property “Catalog Placement” type in “Pinball/LED/LedMatrix”.  This will name a new tab for the component browser, a new subcategory and the name of the component.

Screen Shot 2016-08-14 at 8.45.42 AM

This is how it will appear in the Component Catalog.

Screen Shot 2016-08-14 at 2.45.40 PM

Now right click on the symbols canvas and select “Symbol Parameters”.

Screen Shot 2016-08-14 at 2.47.09 PM

The symbol parameters will show up in the component customizer when the user double clicks.  Add five parameters:

  • ColComponent as a string and a default value of “col” (this is the name of the pins component that you will use for the rows)
  • COLS as uint8 and a default of 4
  • ROWS as uint8 and a default of 4
  • RowComponent as a string and a default value of “row” (this is the name of the pins component that you will use for the columns)
  • Refresh as a uint8 with a default of 5 (this will set the #define for the Refresh rate)

Screen Shot 2016-08-14 at 10.24.27 AM

Next I realized that if I move the “NUMROWS” and “NUMCOLS” macro from the .c to the .h I will be able to use those macros in my main.c

Screen Shot 2016-08-14 at 10.25.47 AM

Then I modify the .c writes to the pins to have the names of the components

Screen Shot 2016-08-14 at 10.27.55 AM

The last step is to create a test project to make sure that everything works.  I create a new project called “TestBlinkingComponent”.  In order to access the Pinball Components you need to add a dependency to the new project.  To do this right click the new project in the workspace explorer and select “Dependencies…” then add “Pinball Components” to your list by clicking the “Components” checkbox.

Screen Shot 2016-08-14 at 8.39.57 AM

Now I make a schematic that looks like this.

Screen Shot 2016-08-14 at 10.29.16 AM

Because I moved the #defines to the .h file I can use them in the main project.  You can see that on line 21 where I reference MatrixLed_NUMROWS

Screen Shot 2016-08-14 at 10.30.32 AM

That is it for the component.  You can find it and the test project (TestLedBlinkingComponent) on github.

You can find all of the source code and files at the IOTEXPERT site on github.

Index Description
Pinball: Newton's Attic Pinball An introduction to the project and the goals
Pinball: Lotsa Blinking LEDs Everyone needs a bunch of LEDs on their Pinball Machine
Pinball: Matrix LEDs (Part 1) Saving PSoC pins by using a matrix scheme
Pinball: Matrix LEDs (Part 2) Solving some problems with the matrix
Pinball: Matrix LEDs Component How to turn the Matrix LED into a component
Pinball: A Switch Matrix Implementing a bunch of switches
Pinball: Switch Matrix Component (Part 1) The switch matrix component implementation
Pinball: Switch Matrix Component (Part 2) The firmware for matrix component
Pinball: Switch Matrix Component (Part 3) Test firmware for the matrix component
Pinball: The Music Player (Part 1) The schematic and symbol for a Music Player component
Pinball: The Music Player (Part 2) The Public API for the Music Player component
Pinball: The Music Player (Part 3) The firmware to make the sweet sweet music
Pinball: The Music Player (Part 4) The test program for the music player
Pinball: The Motors + HBridge Using an Bridge to control DC Motors
Pinball: The Eagle Schematic All of the circuits into an Eagle schematic
Pinball: The Printed Circuit Board 1.0 The first Eagle PCB layout of the printed circuit board
Pinball: The PCB Version 1.0 Fail Problems with the first version of the Eagle PCB layout
Pinball: PCB Layout 1.2 Updates using Eagle Fixing the errors on the first two versions of the Eagle PCB
Pinball: Assemble and Reflow the 1.2 PCB Assembling the Eagle PCB
Pinball: Testing the Eagle PCB Firmware to test the newly built Pinball printed circuit board
Pinball: Debugging the Motor Driver Fixing the motor driver PSoC project
Pinball: Hot-Air Reworking the Accelerometer Solder Using a Hot-Air Rework tool to reflow a QFN
Pinball: Debugging the LM317 Power Supply- A Tale of Getting Lucky Debugging the LM317/LM117 power supply

Pinball: Matrix LEDs (Part 2)

In the previous post I talked about the design and test of a matrix of LEDs, specifically a 3×3 matrix.  The benefit of the matrix is that you use only sqrt(# LEDs) GPIO pins.  For my Pinball machine I am planning on using a 4×4 matrix.  There are two problems with this technique:

  1. You must limit the current through the LEDs so that you do not exceed the maximum current from the GPIO (which has the impact of dimming them)
  2. You can only select one row at a time (which has the impact of dimming them)

So how do you solve these problems?

Problem 1: Maximum Current

The worst case current occurs when you have one row selected and all 4 columns selected.  Here is the equivalent circuit:

Screen Shot 2016-08-13 at 9.04.12 AM

From the PSoC Datasheet I find that the maximum current in any GPIO is 25mA.  That means the maximum current through any of LED/Resistor branches must by less than one fourth (because I have 4 paths) of 25mA = 6.25mA.  We know that the forward voltage of the LED is about 3V.  In the previous post about LEDs I showed you that the worst case HighOutputImpedence is 180Ohms and the worst case LowOutputImpedence is 50Ohms.  Given those numbers, what is the value of the current limiting resistors?

R1 =  (5.5v – 3v – (180 Ohm*6.25mA) – (50Ohm * 6.25mA) ) / 6.25mA = 170 Ohms

Problem 2: Select One Row at a Time

How do you enable all of the LEDs to be turned on and still only select one row at a time?  The answer is that you need to time division multiplex the rows.

  1. Turn on row 0 for 10ms, turn on the correct columns
  2. Turn on row 1 for 10ms, turn on the correct columns
  3. Turn on row 2 for 10ms, turn on the correct columns
  4. Turn on row 3 for 10ms, turn on the correct columns
  5. Go back to the start

This means the LEDs will “blink” but they will blink so fast that you will not see them blinking.  The LEDs are being refreshed at 25Hz with a maximum duty cycle of 25%.  Before I build a general purpose component (the topic of the next post) I will make .h/.c files to implement the the timing scheme.  I start this process by copying the “TestMatrix” project from the previous post into a new project called “TestLedBlinking”.

What should the API for the LED system be?  What do I want the user of the component to be able to do?

  1. Start the system
  2. Turn on a specific LED
  3. Turn off a specific LED
  4. Toggle a specific LED
  5. Start an LED to blinking at some frequency
  6. Stop the blinking of a specific LED

To implement this I add a “.h” file called “led.h” to my project.  This file will contain the public interface to my LED system. On lines 11-18 I create the function prototypes for the interface.  But what are lines 5-9 about?  I want the LEDs in my system to have three possible states (ON,OFF and BLINK) but a “binary” variable is only two states.  I could use an integer with some convention about what 0,1,2,3,…. means with #defines.  But this is error prone as it is not type checked by the compiler.  To help avoid the errors I create a new Type of variable (using enum) called “MatrixLed_LedState” that has the three states that I am interested in.   The rest of the file contains the public interface to the component.

Screen Shot 2016-08-13 at 10.04.30 AM

After I finish the public interface I now need to build the implementation.  To do this I add “led.c” to my project with the c-functions and variables.

Lines 5-6 define the number of rows and columns in my design.  My comment says that you need to keep this less than 8 because the PSoC can only write to one 8-bit port at a time.  I use this to simplify the firmware.

Line 15 declares an array of uint8s that are the actual bits that need to be written to the columns to turn on/off the led in that row.

Line 17 declares a (row by column) sized array to keep track of the state of each LED.  It is of type “MatrixLed_LedState”

Lines 19-27 declare two arrays to keep track of the “counter” and “period” of the software PWM that I use to blink the LEDs.  (see the function MatrixLed_UpdateBlinking)

Screen Shot 2016-08-13 at 11.31.49 AM

The first function to build is the “Start” function.

Lines 120-128 just iterates through all of the row,columns and sets the bit mask to 0 (LEDs OFF) and the States to (OFF).

On lines 129+130 I start the SysTick timer.  I do not like using CyDelay to keep time.  When you use a CyDelay the processor does what is called a busy wait loop that looks like this:

for(int i=0;i<10000;i++); // 10000 is the number of times the CPU has to go through the loop for some amount of delay.  This is dependent on the CPU frequency

This “for” loop keeps the processor sitting in the same spot doing nothing but making heat.  This is not going to work in our system as we need other things to be going on simultaneously (like running switches, buzzers etc).   Instead of a busy wait loop I will use the built in timer in the ARM Cortex M0 core.  That timer is called “SysTick”.  In the Cypress PSoCs, this timer works when the CPU is Active or in Sleep.  By default, it “ticks” every millisecond.  Cypress provides you an API to turn on the timer called “CySysTickStart()”  How do you use it?  You register a callback function using the “CySysTickCallback()”  This function takes two arguments

  • The callback number (you can have up to 4 callbacks)
  • A function pointer to the function you want called back when the timer “ticks”

Screen Shot 2016-08-13 at 11.29.52 AM

The function MatrixLed_RunStateMachine is called by the SysTick interrupt.  This function is the basis of the whole system.  I want to every few milliseconds not every millisecond.  Specifically “every few” means every “MatrixLed_REFRESH” milliseconds.  I do this to save on CPU time.  In order to implement this idea I keep track of number of times the interrupt has been called using the static variable on line 108.  On line 112, when I reach an even number of “MatrixLed_REFRESH” I allow my processing routines to run.

Screen Shot 2016-08-14 at 7.11.29 AM

The other thing that I do in this function is toggle a pin high when I start the processing and then toggle it low when I finish.  I wanted to know how long the interrupt routine ran.  It is a very bad idea for interrupts to take a long time as it can impact other things going on in the system e.g. servicing the BLE.  By toggling the pin I can attach the test board to a logic analyzer and see how long the interrupt service routine takes.  Here is a screen shot from my Salea Logic Analyzer where you can see that the interrupt takes 10.5uS (worst case) runs every 3.986 ms which works out to a duty cycle less than 1% (so it shows 0%).  Why is it 4ms as earlier I said that you should do 10ms?  I tried 10ms, but I can see the LEDs flickering so I increased the update frequency.

Screen Shot 2016-08-13 at 1.15.42 PM

The next block of code drives the column and row pins to the right values.  On line 73 I declare a static variable currentRow which I use track which row needs to be driven this time.  Remember this function gets called every 10ms by the SysTick Interrupt.  Line 74 actually turns on the current row.  It uses the “<<” which is the c-operator also known as left shift.  That makes a value with a “1” in the position of the current row and a “0” in the other bits.  On line 75 I set the column bits to the correct value.  The system is “active low”, meaning you activate a column by driving it to ground.  After all of the updates are done you setup for the next time on line 76 by moving to the next row.

The only other interesting thing about this function is that I declared it with the keyword inline.  This keyword tells the compiler to NOT call it as a function but to put it directly in the assembly language at the place where it is called i.e. to embed it there.  Using inline will save CPU cycles as you don’t have to save a bunch of registers onto the stack, jump, pull a bunch of registers and jump back.  The only downside is that you will get multiple copies of the same function (wasting space).

Screen Shot 2016-08-14 at 7.27.14 AM

The next function handles the blinking.  The blinking is a simple software PWM.  The PWM counts from the “Period” down to 0.  When it hits 0, it toggles the LED, then resets the counter back to the Period.

This function when called, iterates through the matrix of LEDs (using the two nested for-loops), if an LED is in the blinking state (line 89) then do the down count and toggle the LED if needed.

Screen Shot 2016-08-14 at 7.36.28 AM

The MatrixLed_Blink function configures the state and period.  The period is set by:

Period = 1000/frequency/2/MatrixLed_REFRESH

Screen Shot 2016-08-14 at 7.42.22 AM

The last three functions are just helper functions to set the bits in the “MatrixLed_ledRows” for the column values.

Screen Shot 2016-08-14 at 7.41.59 AM

In the next post Ill show you how to turn all of this into a component.

You can find all of the source code and files at the IOTEXPERT site on github.

Index Description
Pinball: Newton's Attic Pinball An introduction to the project and the goals
Pinball: Lotsa Blinking LEDs Everyone needs a bunch of LEDs on their Pinball Machine
Pinball: Matrix LEDs (Part 1) Saving PSoC pins by using a matrix scheme
Pinball: Matrix LEDs (Part 2) Solving some problems with the matrix
Pinball: Matrix LEDs Component How to turn the Matrix LED into a component
Pinball: A Switch Matrix Implementing a bunch of switches
Pinball: Switch Matrix Component (Part 1) The switch matrix component implementation
Pinball: Switch Matrix Component (Part 2) The firmware for matrix component
Pinball: Switch Matrix Component (Part 3) Test firmware for the matrix component
Pinball: The Music Player (Part 1) The schematic and symbol for a Music Player component
Pinball: The Music Player (Part 2) The Public API for the Music Player component
Pinball: The Music Player (Part 3) The firmware to make the sweet sweet music
Pinball: The Music Player (Part 4) The test program for the music player
Pinball: The Motors + HBridge Using an Bridge to control DC Motors
Pinball: The Eagle Schematic All of the circuits into an Eagle schematic
Pinball: The Printed Circuit Board 1.0 The first Eagle PCB layout of the printed circuit board
Pinball: The PCB Version 1.0 Fail Problems with the first version of the Eagle PCB layout
Pinball: PCB Layout 1.2 Updates using Eagle Fixing the errors on the first two versions of the Eagle PCB
Pinball: Assemble and Reflow the 1.2 PCB Assembling the Eagle PCB
Pinball: Testing the Eagle PCB Firmware to test the newly built Pinball printed circuit board
Pinball: Debugging the Motor Driver Fixing the motor driver PSoC project
Pinball: Hot-Air Reworking the Accelerometer Solder Using a Hot-Air Rework tool to reflow a QFN
Pinball: Debugging the LM317 Power Supply- A Tale of Getting Lucky Debugging the LM317/LM117 power supply

Pinball: Matrix LEDs (Part 1)

In the previous post I talked in detail about driving LEDs using the PSoC4 BLE GPIOs.  The basic problem that I have now is that I want to drive way more LEDs than I have available GPIO pins.  Using one GPIO per LED means that I am only able to drive 8 LEDs with the 8 pins that I have reserved.  But I want to do 16 not 8.  So now what?  To solve this, I configure the LEDs into the Matrix.  In the schematic below you can see an example 3×3 test matrix.  It uses 6 pins and is able to drive 9 LEDs.

So how does it work?  Simple.  Write a 1 onto the row you want to enable then write a 0 onto the other rows.  Next write a 0 onto the column you want to enable and a 1 onto the other columns.  For example, if I drive 010 onto the “row” pins and 101 onto the column pins then the LED I have labeled 1,1 will turn on.  With this scheme the row pins are used to drive the “power” and the column pins are used to drive the “ground”.

Screen Shot 2016-08-11 at 7.35.05 AM

Then I get the lab assistant a.k.a. 12 year old son Nicholas to build up a test board.

IMG_3008IMG_2989

I need a little bit of firmware to turn on each LED one by one.

  • Lines 17-19: iterate through the three rows/columns
  • Line 23: write the correct pattern to the row driver (001,010,100)
  • Line 21-22: print the current row column to the UART
  • Line 24: write the correct pattern to the column driver (110,101,011)

Screen Shot 2016-08-11 at 1.14.49 PM

After that everything seems to work… you can see how bright the LEDs are in the movie below.

In the next post I will show you how to Time Division Multiplex the LEDs and explain what the problem is with that scheme.

You can find all of the source code and files at the IOTEXPERT site on github.

Index Description
Pinball: Newton's Attic Pinball An introduction to the project and the goals
Pinball: Lotsa Blinking LEDs Everyone needs a bunch of LEDs on their Pinball Machine
Pinball: Matrix LEDs (Part 1) Saving PSoC pins by using a matrix scheme
Pinball: Matrix LEDs (Part 2) Solving some problems with the matrix
Pinball: Matrix LEDs Component How to turn the Matrix LED into a component
Pinball: A Switch Matrix Implementing a bunch of switches
Pinball: Switch Matrix Component (Part 1) The switch matrix component implementation
Pinball: Switch Matrix Component (Part 2) The firmware for matrix component
Pinball: Switch Matrix Component (Part 3) Test firmware for the matrix component
Pinball: The Music Player (Part 1) The schematic and symbol for a Music Player component
Pinball: The Music Player (Part 2) The Public API for the Music Player component
Pinball: The Music Player (Part 3) The firmware to make the sweet sweet music
Pinball: The Music Player (Part 4) The test program for the music player
Pinball: The Motors + HBridge Using an Bridge to control DC Motors
Pinball: The Eagle Schematic All of the circuits into an Eagle schematic
Pinball: The Printed Circuit Board 1.0 The first Eagle PCB layout of the printed circuit board
Pinball: The PCB Version 1.0 Fail Problems with the first version of the Eagle PCB layout
Pinball: PCB Layout 1.2 Updates using Eagle Fixing the errors on the first two versions of the Eagle PCB
Pinball: Assemble and Reflow the 1.2 PCB Assembling the Eagle PCB
Pinball: Testing the Eagle PCB Firmware to test the newly built Pinball printed circuit board
Pinball: Debugging the Motor Driver Fixing the motor driver PSoC project
Pinball: Hot-Air Reworking the Accelerometer Solder Using a Hot-Air Rework tool to reflow a QFN
Pinball: Debugging the LM317 Power Supply- A Tale of Getting Lucky Debugging the LM317/LM117 power supply

Pinball: Lotsa Blinking LEDs

When I saw the Pinball machine prototype I knew that we needed lots of blinking LEDs.  After all everybody needs lotsa blinking lights.  However, I also knew that I wanted to keep the cost down.  Moreover, I am planning on using a PSoC that has 25 GPIO pins so I am somewhat pin limited.  I started by looking around a little bit on Arrow’s website for a bright blue LED and I found this one.  It is a pretty typical LED with the following characteristics:

  • The Lens is 5MM (Physically it should fit well into the game)
  • Blue (OK.. I like blue)
  • The average forward current IAF=20mA (OK that is very common)
  • The typical forward voltage VF=3.5V (OK that is very common)
  • The luminous intensity is 7000mcd (wow that is really bright.  mcd = millicandelas which is a unit of brightness)

What do these metrics mean?  First, they want you to operate the LED at 20mA of current and 3.5V of “forward voltage”.  The power supply in my system is going to be 5V, but the LED wants to be 3.5.V?  In order to get the correct voltage across the LED I will build a circuit that looks like this:

Screen Shot 2016-08-10 at 6.33.26 AM

You can see that the voltage across the resistor will be 5v-3.5 = 1.5V.  So what size does the resistor need to be to make the current be 20mA?  From Ohms Law (V=IR or R=V/I) you need the R=1.5V/20mA=75Ohms.

The next thing that I did was build a circuit on my bench to test and see how things were working.  In the box of parts in my lab I had an LED with a forward voltage of 3V so I calculate that my resistor needed to be 100Ohms.

When I measure (using my Fluke meter) I find out that the parameters of the system are actually:

  • Vcc = 4.7 (instead of 5V)
  • The LED VF=2.97 (instead of 3.0)
  • The R=98.8 Ohms (instead of 100)
  • The IAF = 17.5mA (instead of 20)

OK.  All of that makes sense.  The next step in building the blinking LEDs is to drive the same circuit with a PSoC pin just to make sure everything is still OK.  To do this I build a schematic in PSoC Creator that looks like this:

Screen Shot 2016-08-10 at 6.58.23 AM

And I configure the GPIO like this:

  • Select “Initial drive state: High” which means that the pin will start at Vcc
  • Select “External terminal” so that I can draw the whole circuit on the outside of the PSoC using the annotation components

Screen Shot 2016-08-10 at 6.57.48 AM

When I program the project and measure the output I get:

  • VF=2.9V
  • VR=1.35
  • IAF=13.7mA = 1.35V/98.8Ohm

These results are confusing because VF+VR=4.25V yet when I measured the power supply it is 4.9V.  Where did the other 650mV go?  When I first took the measurement I was worried for a moment that I had drawn to much current out of the PSoC and something was bad.  But there was no smoke so that didn’t explain anything.  Still confused as I was drawing only 13mA and the chip is capable of delivering 25mA on a GPIO pin.  Here is a snap from the PSoC data sheet where you can see SID4 is 25mA.

Screen Shot 2016-08-10 at 7.14.07 AM

The bottom line is 13mA < 25mA so if to much current isn’t the problem then what it is?  The answer is that the output impedance of the chip is not 0.   What is “output impedance”?  Inside of the chip there is an PMOS transistor that is used to drive the “1” (or an NMOS for “0”) onto the output pin of the chip (the circuit on the left side of the picture).  When this transistor is On and you are driving a 1 onto the output pin, a good model for the on PMOS transistor is a resistor (the equivalent circuit on the right)

Screen Shot 2016-08-10 at 8.34.48 AM

In the case of my circuit the output impedance (from Ohms Law) must be

R = 0.65v / 13.7mA = 47.7 Ohms

OK that is curious.  The next question is what is the output impedance of the pulldown transistor?  To find the answer I build the same circuit except using a pulldown in the PSoC and powering it with the VCC directly.  In fact I built all 4 combinations (power from the VCC, ground from the ground, power from the chip and ground from the chip).

Screen Shot 2016-08-11 at 6.14.20 AM

Here is the table of results.

Configuration V(VCC-LED) VF VR V(R-GND) Total Act VCC-GND IAF Rhigh Rlow
Only Pullup 0.65 2.90 1.35 0 4.91 4.9 13.7 47.7 0
Pullup and Pulldown 0.62 2.88 1.26 0.13 4.90 4.9 12.8 48.9 10.2
Pulldown Only 0 2.95 1.60 0.17 4.71 4.7 16.2 0 10.5
No PSoC 0 2.97 1.73 0 4.7 4.7 17.5 0 0

Does all of this make sense?  What does the data sheet say?  It turns out that the data sheet does not specify the output impedance.  Instead, it give the worst case output voltage for a high and a low AT a given current and VCC spec.  From the spec SID59 (data sheet below) you can see that the worst case Voh is -0.6v at Ioh=4mA and 3V VDD.  That spec says that IF you power the chip at 3V AND you draw 4mA out, then the “high” or “1” output will be NO LESS than 2.4V.  This is another way of saying that the output impedance of that condition is no worse than 0.6V/4mA = 150 ohms.

Screen Shot 2016-08-10 at 7.15.12 AM

Why is Voh specified as a worst case current/voltage combination?  The basic answer is the output buffer has a transistor, actually several transistors, driving the output.  The actual V/I characteristic of a transistor is not as simple as just a resistor and it depends on the voltage of the gate, source, and drain.  But this would be too much complexity to publish and is unneeded as GPIOs are used to drive logic signals outside of the chip.  In the digital output situation you just need to insure that the HIGH output has a high enough voltage to be a logic 1 and that a LOW output is low enough to be a logic 0.  In a normal system, logic signals do not require very much current-generally <1mA so 4mA is a worst case scenario.

In the next post I will talk in detail about how to turn 8 GPIO Pins into 16 outputs.

You can find all of the source code and files at the IOTEXPERT site on github.

Index Description
Pinball: Newton's Attic Pinball An introduction to the project and the goals
Pinball: Lotsa Blinking LEDs Everyone needs a bunch of LEDs on their Pinball Machine
Pinball: Matrix LEDs (Part 1) Saving PSoC pins by using a matrix scheme
Pinball: Matrix LEDs (Part 2) Solving some problems with the matrix
Pinball: Matrix LEDs Component How to turn the Matrix LED into a component
Pinball: A Switch Matrix Implementing a bunch of switches
Pinball: Switch Matrix Component (Part 1) The switch matrix component implementation
Pinball: Switch Matrix Component (Part 2) The firmware for matrix component
Pinball: Switch Matrix Component (Part 3) Test firmware for the matrix component
Pinball: The Music Player (Part 1) The schematic and symbol for a Music Player component
Pinball: The Music Player (Part 2) The Public API for the Music Player component
Pinball: The Music Player (Part 3) The firmware to make the sweet sweet music
Pinball: The Music Player (Part 4) The test program for the music player
Pinball: The Motors + HBridge Using an Bridge to control DC Motors
Pinball: The Eagle Schematic All of the circuits into an Eagle schematic
Pinball: The Printed Circuit Board 1.0 The first Eagle PCB layout of the printed circuit board
Pinball: The PCB Version 1.0 Fail Problems with the first version of the Eagle PCB layout
Pinball: PCB Layout 1.2 Updates using Eagle Fixing the errors on the first two versions of the Eagle PCB
Pinball: Assemble and Reflow the 1.2 PCB Assembling the Eagle PCB
Pinball: Testing the Eagle PCB Firmware to test the newly built Pinball printed circuit board
Pinball: Debugging the Motor Driver Fixing the motor driver PSoC project
Pinball: Hot-Air Reworking the Accelerometer Solder Using a Hot-Air Rework tool to reflow a QFN
Pinball: Debugging the LM317 Power Supply- A Tale of Getting Lucky Debugging the LM317/LM117 power supply

Pinball: Newton’s Attic Pinball

One of the most important Cypress distributors is Arrow Electronics.  Recently, I have been talking with our inside people about using Arrow to supply chips for use in a Maker style PSoC project.  Moreover, I will be speaking at Maker Faire NYC in October, and I would like to have a Maker project to show there.  But what project?

In the (incomplete) series about Physics Lab I introduced you to my friend Billy and his non-profit company Newton’s Attic.  He teaches Physics and Engineering classes to Middle School and High School kids. In one of the classes (called Pinball Wizard) taught at Newton’s Attic the kids build a Pinball machine which they take home.  Here are a couple of pictures:

0731161220 0731161219

The current focus of the class is on the creative and mechanical side of building the pinball machine.  When I saw the prototype, I immediately thought that I should build an electronics toolkit for easy installation into the machines.  So that is what I am going to do.  To make matters more interesting I am going to finish it and post about it most every day before Maker Faire NYC on 10/1.

The big picture requirements are:

  1. Easy for the kids to install
  2. Low cost (<$30)
  3. Configurable over BLE via a smart phone
  4. No programming required
  5. Small (about the size of a deck of cards)
  6. Glitzy (lots of blinking lights and beeping buzzers)

With all of that in mind I am currently planning on ~$40 (I’m currently over my goal)

  1. A PSoC4 BLE as the central processor $12 with 25 IO Pins
  2. An I2C based LCD $8 and 2 Pins
  3. 2 Capsense Buttons $0 and 2 Pins
  4. 2 Buzzers (One for music and one for beeping) $2 and 2 Pins
  5. 16 LEDs in a 4×4 matrix $2.5 and 8 Pins
  6. 9 Switches in a 3×3 matrix $8 and 6 Pins
  7. 1 Printed Circuit Board $5
  8. 5V wall wart $5
  9. 2 Small DC Motors $2 and 4 pins

My plan is to build an iOS and an Android App that will allow you to configure the electronics.

  1. Configure beeps (frequency and duration)
  2. Configure the switches to trigger beeps
  3. Configure the switches to count points
  4. Configure the switches to trigger LEDs
  5. Configure patterns of LEDs (flashing and sequence)
  6. Configure songs (notes, duration, tempo)
  7. Set the triggers and speed for the motors

For the next month I am going to (try) to post each day my progress towards finishing the Pinball machine.

You can find all of the source code and files at the IOTEXPERT site on github.

Index Description
Pinball: Newton's Attic Pinball An introduction to the project and the goals
Pinball: Lotsa Blinking LEDs Everyone needs a bunch of LEDs on their Pinball Machine
Pinball: Matrix LEDs (Part 1) Saving PSoC pins by using a matrix scheme
Pinball: Matrix LEDs (Part 2) Solving some problems with the matrix
Pinball: Matrix LEDs Component How to turn the Matrix LED into a component
Pinball: A Switch Matrix Implementing a bunch of switches
Pinball: Switch Matrix Component (Part 1) The switch matrix component implementation
Pinball: Switch Matrix Component (Part 2) The firmware for matrix component
Pinball: Switch Matrix Component (Part 3) Test firmware for the matrix component
Pinball: The Music Player (Part 1) The schematic and symbol for a Music Player component
Pinball: The Music Player (Part 2) The Public API for the Music Player component
Pinball: The Music Player (Part 3) The firmware to make the sweet sweet music
Pinball: The Music Player (Part 4) The test program for the music player
Pinball: The Motors + HBridge Using an Bridge to control DC Motors
Pinball: The Eagle Schematic All of the circuits into an Eagle schematic
Pinball: The Printed Circuit Board 1.0 The first Eagle PCB layout of the printed circuit board
Pinball: The PCB Version 1.0 Fail Problems with the first version of the Eagle PCB layout
Pinball: PCB Layout 1.2 Updates using Eagle Fixing the errors on the first two versions of the Eagle PCB
Pinball: Assemble and Reflow the 1.2 PCB Assembling the Eagle PCB
Pinball: Testing the Eagle PCB Firmware to test the newly built Pinball printed circuit board
Pinball: Debugging the Motor Driver Fixing the motor driver PSoC project
Pinball: Hot-Air Reworking the Accelerometer Solder Using a Hot-Air Rework tool to reflow a QFN
Pinball: Debugging the LM317 Power Supply- A Tale of Getting Lucky Debugging the LM317/LM117 power supply

The Creek: Creek Server 1.2

In the previous post, I talked about two problems that I had discovered in my system.  I addressed first one,  a serious bug in the data collection, last time.  In this post Ill address the slow performance of the website.  A common way to solve a performance problem is with a cache.  Instead of running the web page charts in real time, I will create them automatically every couple of minutes, then serve up a cached version.   In some ways this kind of sucks.  If I had known that I was going to go this way then there would have been 0 need of Tomcat and the Java Server Pages.  Oh well.

I start this process by copying the CreekHistory java object into the “getCreek” part of my project.  I then modify the main batch Java program, called “CreekServer” to understand the CreekHistory object.

Screen Shot 2016-05-08 at 11.19.48 AM

Then I add a new function “createHtml” to the CreekHistory object.  This function creates the webpage with the current information on it.  Basically

  1. A table of the last three hours [line 221-235]
  2. Link to the current chart [line 237]
  3. Link to the floods charts [line 237/238]

Screen Shot 2016-05-08 at 11.26.31 AM

I then add the “Current” command to the “runi2c” batch program.

Screen Shot 2016-05-08 at 11.39.43 AM

This program is run every 2 minutes by the crontab on the Raspberry Pi.  I picked 2 minutes because that is a good bit longer than each job takes to run in total.   Notice that I check to see if the jobs are already running and quit the “runi2c” job if the chart creation process is already going on.

At this point I have (at least) several things which are ugly

  1. I don’t have a good back up system
  2. I duplicate the “CreekHistory” object in the JSP as well as the “getCreek”
  3. I duplicate the “readProperties” method into a bunch of different objects
  4. I have 5Vs (I think) on the I2C pins of the Raspberry Pi, which I don’t understand why this isn’t a problem
  5. I need to get the PSoC4 Bootloader Host going on the Raspberry Pi

Index Description
The Creek: IOT for the Elkhorn Creek Introduction
The Creek: Solution Architecture 1.0 Overall architecture
The Creek: Creek Board 1.1 Eagle layout of the board
The Creek: Creek Board 1.0 – RCCA A discussion of the errors in the 1.0 board
The Creek: CYPI, a Raspberry Pi to Arduino Bridge PSoC4 <--> Raspberry Pi Bridge Board
The Creek: PSoC4 Creator Schematic and Firmware Firmware to interface with the temperature and pressure sensors
The Creek: Testing the Firmware Using tools to verify that the PSoC 4 Firmware is working correctly
The Creek: Testing the Bootloader Make sure that you can load new firmware into the PSoC
The Creek: Software Architecture All of the Raspberry Pi software connections
The Creek: Install MySql Instruction to configure MySql
The Creek: Install Tomcat Instruction to configure Tomcat JSP Server
The Creek: Data Collection Java (Part 1) The Java program that reads the I2C and saves it in the database
The Creek: Data Collection Java (Part 2) The Java program that reads the I2C and saves it in the database
The Creek: Create the Chart with JFreeChart Using open source Java charting software to create plots of the Creek Depth
The Creek: Flood Event Data Processor A batch program to create analyze the database and create a table of flood events
The Creek: Flood Event Web Page A batch program to create the flood event web page
The Creek: Creek Server 1.1 Updates to all of the back off server programs to integrate charts
The Creek: JSP Web Page for www.elkhorn-creek.org The JSP program to make the table and display the website
The Creek: Raspberry Pi Clock Stretching Sorting out a bug in the system having to do with the Broadcomm Raspberry Pi Master not functioning well with clock stretching
The Creek: Creek Server 1.2 Caching the web pages to make them faster


The Creek: Web Pages with Java Server Pages (JSP)

The last piece in the Elkhorn Creek IOT puzzle are the webpages that let you view the creek data on the internet.  There are two pages, one with a table of the data and a chart and the other a dump CSV file of the database.  When it came time to work on this post, I realized that I had little memory of the evils deeds I had originally done to make the JSP pages work.  As I sorted through the code that was existing on the current production Raspberry Pi environment, all I could see was an undocumented mess.

Making dynamic web pages is ugly business.  As best I can tell, there is no clean way do this job (though I am planning on showing some ways to make it better in future posts).  A JSP is an interleaved mashup of HTML and Java.  To make a JSP, you create a file with sections of both languages separated by markers.   In the following example you can see an example that rolls two dice (generates a random number between 1-6).  The sections of code that are Java are marked with a “<%” and a “%>”.

<html>
<head><title>Roll the dice</title></head>
<body>
<%
int die1 = (int)(Math.random() * 6 + 0.5);
int die2 = (int)(Math.random() * 6 + 0.5);
%>
<h2> Die1 = <%= die1 %></h2>
<h2> Die2 = <%= die2 %></h2>

<a href=”<%= request.getRequestURI() %>”><h3>Try Again</h3></a>
</body>
</html>

When a web request is made, the Tomcat JSP Webserver takes the page (in JSP format)

  1. Converts it to Java (turns raw HTMLs into java commands e.g. “<html>” turns into “out.println(“<html>”);”
  2. Runs the compiler
  3. Executes the java program and pipes the output back to your web browser

To makes things go faster Tomcat will cache the output of 1+2 and only rerun it if something has changed.

Since I last worked on this system there is one thing that had greatly improved.  Specifically, this time I knew about Netbeans which is the Sun Microsystems IDE for editing Java.  Netbeans is cool for this project because:

  • It knows about Java (so it knows how to edit, highlight, search, refactor, syntax check etc)
  • It knows about JSP (so it knows how to edit…)
  • It knows how to edit Java Properties files
  • It has a JSP web server (GlassFish) integrated into the tool.  This allowed me to debug the web pages on my Mac (instead of on the RPi)
  • It knows how to make “war” files (the file format that you use to deploy a JSP web application)

The Netbeans project navigator lets you look at (and into) all of the files that are part of the JSP Web Application.  In the screenshot below you can see the organization of my project.  It has

  • A classes folder which will contain the compiled java classes.  It can also hold a “properties” file.  In this case I have a properties file called “config.properties” which contains the URL, User and Password for the mysql database
  • basic.jsp: The JSP file which displays the table and graph
  • index.html: a file which just loads the basic.jsp
  • CreekHistory.java: A java class to interact with the MySql Database.  This is essentially the “Model” of the MVC
  • A libraries folder with mysql-connector-java-5.1.6-bin.jar: the mysql library to connect to the database

Screen Shot 2016-05-03 at 7.13.26 AM

I like to use the Model View Controller (MVC) design paradigm of user interface programming.  In this methodology the model represents the data.  It knows nothing about user interfaces, how to create them, how to display them.  It is completely agnostic about GUI.  The view is a mechanism to display data. In this JSP web application, the view is just the raw html that is displayed on the web.  The last piece is the controller (aka the view controller).  It takes data out of the model and puts it into the view.  Here is a nice picture from Apples website (but if you google you will find lots of discussion about MVC programming)

model_view_controller_2x

The first thing that I created was Java class called CreekHistory.java.  This class has the responsibility to read the last 4 hours of depth and temperature data from the MySql database and put it into 15 minute buckets (using linear interpolation), and store the results into an array for easy retrieval by the controller.

In the first block of code (lines 29-31) I declare a few private variable that hold information out of the properties file about the database connection. The I declare a bunch of public variables which are the data interface to the model.

  • depth[] + temperature[] arrays of doubles that contain the depth and temperature in 15 minute buckets
  • depthDelta[] and temperatureDelta[] doubles that contain the change in depth and temperature since the start aka [0]
  • startTime a timestamp of the first datapoint (from the MySql database)

In the next clock of code (lines 43-46) I declare some constants (so that I don’t have magic numbers in my code).

On line 48 I declare a reference to a JspWriter.  This reference will allow me to print debugging information to the HTML output.  This is a clear violation of the MVC so I only use it for printing debugging information as it is a serious PITA to debug JSP code.

And finally the constructor which calls the function to read the properties file and then initialize the arrays.

Screen Shot 2016-05-04 at 6.25.48 AM

In the next section of code I have three helper functions.

The first function “interpolate” just performs a linear interpolation between two datapoints given known timestamps.

The “cToF” function just converts the a temperature from the bogus Centigrade units to useable Fahrenheit.

The last function, “readProperties” finds the config.properties file and reads the values into the global Properties class.  The only magic in this function occurs on lines 194-195 where it uses the ClassLoader object to search through the “classes” directory to find the file with the properties.


Screen Shot 2016-05-04 at 6.32.46 AM

The last function is “loadData” which has two sections.  The first section sets up and executes the MySql query to get the current Elkhorn Creek data.

Screen Shot 2016-05-04 at 6.40.44 AM

Once it has the data, it iterates through the data from the MySql database to find the datapoints that bracket the 15 minute buckets, then interpolates the results, then store it in the array.

Screen Shot 2016-05-04 at 6.51.08 AM

Finally the last part of the web server is the JSP page which outputs the actual HTML.

Lines 1-2 load two Java classes which I use on other sections of the page.  Specifically the Timestamp class which I use to do Time math, and the CreekHistory class which is the “model”

Lines 15-18 initialize the CreekHistory model object and tell it to load its data.  Notice on line 16 if I set the CreekHistory “out” public variable then it will put out debugging information.

Lines 24-37 just spit out an HTML table of the data from the CreekHistory model.

Screen Shot 2016-05-04 at 7.04.07 AM

That is all there is to it.  As with all of the code on this website you can get it from github.

Index Description
The Creek: IOT for the Elkhorn Creek Introduction
The Creek: Solution Architecture 1.0 Overall architecture
The Creek: Creek Board 1.1 Eagle layout of the board
The Creek: Creek Board 1.0 – RCCA A discussion of the errors in the 1.0 board
The Creek: CYPI, a Raspberry Pi to Arduino Bridge PSoC4 <--> Raspberry Pi Bridge Board
The Creek: PSoC4 Creator Schematic and Firmware Firmware to interface with the temperature and pressure sensors
The Creek: Testing the Firmware Using tools to verify that the PSoC 4 Firmware is working correctly
The Creek: Testing the Bootloader Make sure that you can load new firmware into the PSoC
The Creek: Software Architecture All of the Raspberry Pi software connections
The Creek: Install MySql Instruction to configure MySql
The Creek: Install Tomcat Instruction to configure Tomcat JSP Server
The Creek: Data Collection Java (Part 1) The Java program that reads the I2C and saves it in the database
The Creek: Data Collection Java (Part 2) The Java program that reads the I2C and saves it in the database
The Creek: Create the Chart with JFreeChart Using open source Java charting software to create plots of the Creek Depth
The Creek: Flood Event Data Processor A batch program to create analyze the database and create a table of flood events
The Creek: Flood Event Web Page A batch program to create the flood event web page
The Creek: Creek Server 1.1 Updates to all of the back off server programs to integrate charts
The Creek: JSP Web Page for www.elkhorn-creek.org The JSP program to make the table and display the website
The Creek: Raspberry Pi Clock Stretching Sorting out a bug in the system having to do with the Broadcomm Raspberry Pi Master not functioning well with clock stretching
The Creek: Creek Server 1.2 Caching the web pages to make them faster


The Creek: Creek Server 1.1

The last few weeks I have been building up the java programs that form the “back office” part of my system.  This is composed of

  • i2cb.java: A program that reads I2C registers of the Creek Depth and Temperature and inserts them into the creekdata database.
  • MakeChart.java: A program to create a PNG graph of Elkhorn Creek depth using JFreeChart
  • ProcessEvents.java: A program that searches the creekdata for “flooding events” and then inserts them into the flood event database.

Things worked OK, but I had several problems that I wanted to fix

  1. The MakeChart program was not using global properties file so I had duplicated things like the database password
  2. I had implemented myself into a design flaw (I wanted to chain information from i2cdb –> MakeChart –> ProcessEvents –> MakeChart
  3. I really wanted a single Java program with options to run all of the back office

The bottom line is this week will be spent fixing the design flaws and cleaning up the code.

The first thing that I did was create a new Java program called “CreekServer” which hooks all of the programs together and provides a unified command line interface.  This program looks at the first command line argument and decides to either:

  • Lines 12-15: print the help text
  • Lines 17-23: run the “MakeChart” function
  • Lines 24-29: run the ProcessEvents function, then update/create all of the historical flood charts [line 27]
  • Lines 30-34: run the GetData function

Screen Shot 2016-04-17 at 11.09.49 AM

The next block of code is a kludgey work around for my design flaw.  Specifically, after you have create a table full of the flood events you would like to create charts for each event.  However, I didn’t want to duplicate the chart object into the ProcessEvents class, so I decided to hack it into the system by adding a public interface to the ProcessEvents object.

  • [line 52] I tell the ProcessEvents object to read the floodevents table
  • [line 57-75] I iterate through all of the flood events that are in the public array of events (bad design)
  • [line 58-60] create the appropriate filename for the plot
  • [line 63] if the file doesnt exist (it was previously created) or the flood is ongoing (it has no end date) then create a new chart by calling the MakeChart object

Screen Shot 2016-04-17 at 11.32.27 AM

After I got done with the main program, I went back and fixed the ProcessEvents program to read its properties from the “config.properties” file.

Screen Shot 2016-04-17 at 11.49.54 AM

Finally, I fixed the properties problem in the MakeChart program:

Screen Shot 2016-04-17 at 12.02.08 PM

All of this code is available on the iotexpert github.

In the next post I am finally going to move into the JSP and Servlet code that builds the main site.

Index Description
The Creek: IOT for the Elkhorn Creek Introduction
The Creek: Solution Architecture 1.0 Overall architecture
The Creek: Creek Board 1.1 Eagle layout of the board
The Creek: Creek Board 1.0 – RCCA A discussion of the errors in the 1.0 board
The Creek: CYPI, a Raspberry Pi to Arduino Bridge PSoC4 <--> Raspberry Pi Bridge Board
The Creek: PSoC4 Creator Schematic and Firmware Firmware to interface with the temperature and pressure sensors
The Creek: Testing the Firmware Using tools to verify that the PSoC 4 Firmware is working correctly
The Creek: Testing the Bootloader Make sure that you can load new firmware into the PSoC
The Creek: Software Architecture All of the Raspberry Pi software connections
The Creek: Install MySql Instruction to configure MySql
The Creek: Install Tomcat Instruction to configure Tomcat JSP Server
The Creek: Data Collection Java (Part 1) The Java program that reads the I2C and saves it in the database
The Creek: Data Collection Java (Part 2) The Java program that reads the I2C and saves it in the database
The Creek: Create the Chart with JFreeChart Using open source Java charting software to create plots of the Creek Depth
The Creek: Flood Event Data Processor A batch program to create analyze the database and create a table of flood events
The Creek: Flood Event Web Page A batch program to create the flood event web page
The Creek: Creek Server 1.1 Updates to all of the back off server programs to integrate charts
The Creek: JSP Web Page for www.elkhorn-creek.org The JSP program to make the table and display the website
The Creek: Raspberry Pi Clock Stretching Sorting out a bug in the system having to do with the Broadcomm Raspberry Pi Master not functioning well with clock stretching
The Creek: Creek Server 1.2 Caching the web pages to make them faster

The Creek: Flood Event Web Page

In the previous post I talked about scanning through the Elkhorn Creek MySql database and finding flood events.  This is a very IO intensive task and as such is slower than crap.  It takes something like 20 seconds on the Raspberry Pi and as such is not very ideal for an interactive application.  So to make this better, I will create code that runs once per minute and then creates the “floods.html” with all a table of all of the floods and links to the charts.  It will also recreate the chart for any flood event that is in the database but doesn’t have a chart.

After the “ProcessEvents” run method has done its thing, there is a table in the database called “floodevents” that will have columns for the start,end and maxdepth of all of the floods.   To make things easy I would like a directory full of PNG files with the charts of the floods.  Each PNG file will contain one flood event and be named by the date of the flood.  To do this I create a function called “createCharts” that will:

  • [Line 71] Iterate through the list of events
  • [Lines ] Create a string that represents the filename
  • [lines] If that filename doesn’t exist (for some reason it was never created or it was deleted) or the flood isn’t over (and the chart needs to be redrawn) then:
  • [Lines 77-88] Create the chart of the flood

After this function has been run, there will be a directory full of charts.  I can then copy this directory to the Tomcat web apps directory

Screen Shot 2016-05-04 at 8.50.28 AM

As long as you know all of the floods, and you have created PNGs of the flood events you might as well also create and cache the HTML of the flood events.  This is simply done in the ProcessEvents object with the method “createHtml”.  This method take a filename  that will be the name of the HTML table file, then creates an HTML table, iterates through each of the events printing one row per flood event.


Screen Shot 2016-05-04 at 9.02.50 AM

As always you can get of all this code on the IOT Expert github site.

Index Description
The Creek: IOT for the Elkhorn Creek Introduction
The Creek: Solution Architecture 1.0 Overall architecture
The Creek: Creek Board 1.1 Eagle layout of the board
The Creek: Creek Board 1.0 – RCCA A discussion of the errors in the 1.0 board
The Creek: CYPI, a Raspberry Pi to Arduino Bridge PSoC4 <--> Raspberry Pi Bridge Board
The Creek: PSoC4 Creator Schematic and Firmware Firmware to interface with the temperature and pressure sensors
The Creek: Testing the Firmware Using tools to verify that the PSoC 4 Firmware is working correctly
The Creek: Testing the Bootloader Make sure that you can load new firmware into the PSoC
The Creek: Software Architecture All of the Raspberry Pi software connections
The Creek: Install MySql Instruction to configure MySql
The Creek: Install Tomcat Instruction to configure Tomcat JSP Server
The Creek: Data Collection Java (Part 1) The Java program that reads the I2C and saves it in the database
The Creek: Data Collection Java (Part 2) The Java program that reads the I2C and saves it in the database
The Creek: Create the Chart with JFreeChart Using open source Java charting software to create plots of the Creek Depth
The Creek: Flood Event Data Processor A batch program to create analyze the database and create a table of flood events
The Creek: Flood Event Web Page A batch program to create the flood event web page
The Creek: Creek Server 1.1 Updates to all of the back off server programs to integrate charts
The Creek: JSP Web Page for www.elkhorn-creek.org The JSP program to make the table and display the website
The Creek: Raspberry Pi Clock Stretching Sorting out a bug in the system having to do with the Broadcomm Raspberry Pi Master not functioning well with clock stretching
The Creek: Creek Server 1.2 Caching the web pages to make them faster


The Creek: Flood Event Data Processor

In the previous post I talked about using JFreeChart to create a plot of the last 8 hours.  I have never been satisfied with only 8 hours but had never spent the time to fix it.  To make matters worse I also wanted to have a website where I could see a list of the the flood events as well as plots of that data.  Well, this week I am going remedy this annoyance, and while I am at it, I am going to fix a bunch of things that I left hanging.

The Elkhorn Creek can do some crazy things.  Here is a plot that I made while I was working on these changes.  This was a spring flood that lasted 304 hours aka 12.6 days:

2015-03-04-18-35-40

As there are more than 1M records in my database I knew that the Raspberry Pi didn’t have the horsepower to scan the data and create the charts in real time.  The first step was to create a table to hold statistics about the events.  I decided to store a timestamp for the start and end as well as the maximum depth.  Here is the table description:

Screen Shot 2016-04-17 at 8.27.59 AM

The next step was to create a java program called “ProcessEvents.java” that would analyze the raw data in the creekdata table using the “known” events from the floodevents table.  The first thing that I did was create a helper class called StartEnd that hold one record from the floodevents table.  The lowest “id” in the floodevents table is 1 so the 0 default for id represents a record that is not yet in the database.

Screen Shot 2016-04-17 at 8.46.28 AM

The program works by implementing the following algorithm.

  1. Line 52: set a flag that you have not found an event
  2. Line 53: scan the floodevent database
  3. Line 58: If you didn’t find an event or there is an event ongoing (it has a start but no end)
  4. Line 60: If there has never been an event then start scanning for a “start” the creekdatase from the start (all data)
  5. Line 63: If there has been an event, then start scanning for a “start” the creekdata after the end of the current event
  6. Line 66: If you don’t find a “start” then there are no more events (or you didnt find one at all) so stop scanning
  7. Line 71: Now that you have a start, look for an “end”
  8. Line 75: If you found a new event then save it in the database
  9. Line 79: If you are in the middle of an event update the database

Screen Shot 2016-04-17 at 8.49.00 AM

Once all of the events have been found and put into the floodevents database the last step is to look at all of the events and fix the “max” depth column [Line 84]

Screen Shot 2016-04-17 at 9.02.47 AM

The “findStart” function returns a timestamp for the start of the next event.  If it doesn’t find one then it return null.  The function looks through all of the creek data starting from the beginning [line 149] or after a time [line 151].  My program has a little bit of hysteresis in that it “starts” a flood when it get to 2.0 feet and it “ends” a flood when it gets below 0.75 feet.  If there is a little bit of noise around the upper trip point or the lower trip point it won’t turn on/off.

Screen Shot 2016-04-17 at 9.29.35 AM

The “findEnd” function returns a timestamp for the end of the current event.  If it doesn’t find one then it return null.

Screen Shot 2016-04-17 at 9.30.40 AM

The “calcAndInsertMaxDepth” function:

  • Sets up a query to scans all of the events in the floodevents database [line 253]
  • Loop through all of the events [line 259]
  • Foreach event find the maximum depth [line 265]
  • Update the table with the current maximum depth [line 266]

Screen Shot 2016-04-17 at 9.04.39 AM

The “getMaxDepthFunction” function uses a feature of mysql that allows you to perform a function during a query.  In this case it looks for all of the data between a start and end and calculates the “max(depth)”.  This query will return only one resultset.  I get the maximum depth value from the result set using the “rs.getFloat(“max(depth)”)”

Screen Shot 2016-04-17 at 9.05.59 AM

The “depthUpdate” function takes in an “id” of one of the events and a calculated “maxDepth” then updates the “max” field for that id in the floodevents database.

Screen Shot 2016-04-17 at 9.07.06 AM

All of this code is available on the iotexpert github site in the java program “ProcessEvents.java” which is in the “getCreek/src” directory.

In the next post I will talk about all of the modifications to the chart creation program that I made to support creating the flood events charts.

Index Description
The Creek: IOT for the Elkhorn Creek Introduction
The Creek: Solution Architecture 1.0 Overall architecture
The Creek: Creek Board 1.1 Eagle layout of the board
The Creek: Creek Board 1.0 – RCCA A discussion of the errors in the 1.0 board
The Creek: CYPI, a Raspberry Pi to Arduino Bridge PSoC4 <--> Raspberry Pi Bridge Board
The Creek: PSoC4 Creator Schematic and Firmware Firmware to interface with the temperature and pressure sensors
The Creek: Testing the Firmware Using tools to verify that the PSoC 4 Firmware is working correctly
The Creek: Testing the Bootloader Make sure that you can load new firmware into the PSoC
The Creek: Software Architecture All of the Raspberry Pi software connections
The Creek: Install MySql Instruction to configure MySql
The Creek: Install Tomcat Instruction to configure Tomcat JSP Server
The Creek: Data Collection Java (Part 1) The Java program that reads the I2C and saves it in the database
The Creek: Data Collection Java (Part 2) The Java program that reads the I2C and saves it in the database
The Creek: Create the Chart with JFreeChart Using open source Java charting software to create plots of the Creek Depth
The Creek: Flood Event Data Processor A batch program to create analyze the database and create a table of flood events
The Creek: Flood Event Web Page A batch program to create the flood event web page
The Creek: Creek Server 1.1 Updates to all of the back off server programs to integrate charts
The Creek: JSP Web Page for www.elkhorn-creek.org The JSP program to make the table and display the website
The Creek: Raspberry Pi Clock Stretching Sorting out a bug in the system having to do with the Broadcomm Raspberry Pi Master not functioning well with clock stretching
The Creek: Creek Server 1.2 Caching the web pages to make them faster


The Creek: Create the Chart with JFreeChart

It is almost always better to see data in a plot than as raw values.  I knew that I wanted to be able to see the Elkhorn Creek Water Level.

creekdepth

The charting software that I am using has been done and re-done several times (including as I prepared this post).  I was committed to using Java and I wanted to find a toolkit for building charts.  After searching around on the internet a bit, I settled on JFreeChart which is an open source Java based plotting package.  I like to contribute to the good work of people so I bought the developers guide for $65 and it was well worth it.

I knew that creating a chart would take a bit of CPU and that the Raspberry Pi was a bit under powered as far as that goes.  This lead me to create a batch program which I run via crontab directly after I have collected the data (once per minute).  It appears to the web user that the chart is “fresh”, but really it is up to 1 minute old.

The “makeChart” program is broken up into the following parts

  • Setup the global settings
  • Read and process the command line arguments
  • Read in x-y data from the MySql Database
  • Make the chart

Setup the global settings

The first block of code (lines 2-16) just imports the different classes that I use in this program.  To make the org.jfree stuff work you need to have jcommon-1.0.16.jar and jfreechart-1.0.13.jar in your class path.  You can download them from the source forge project directory https://sourceforge.net/projects/jfreechart/files/

The second block of code (lines 20-26) setup global configuration variables which I declare as “final” so that I know that they are immutable.  It probably would have been better to make the filename be configurable with the command line arguments, but that is something for another day.  Publishing the MySql User and Password would be a problem except, that user can only access the MySql database from inside my network.

The last block of code (lines 32-40) just prints out the command like usage if they program is run with the “-help” argument.

Screen Shot 2016-04-15 at 12.21.46 PM

Read and process the command line arguments

The next step is setting up the Start date/time and the number of hours.  Java has a cool class called “LocalDateTime” which I use to represent the starting time of the data.  There is an absolutely mind boggling number of issues when you deal with dates and times.  I was to far down the road, but if I had it to do over again I would have used Joda Time.

If there is only 1 argument then there are two possibilities

Lines 44-60: The user did 1 command line argument

  • They typed in a number of hours.  On line 47 if the argv[0] string converts to an Integer with no Exception being thrown then I assume that is a number of hours from the current time
  • They typed in a date in the form of “yyyy-MM-dd” or “yyyy-MM-dd hh:mm:ss” or “yyyy-MM-dd hh:mm”.  If they typed 1 argument and it isn’t an integer then I called the “convertStringDateTime” function to try to parse the string.

Lines 65-80: The users did 2 command line arguments

  • The first argument has to be a date and I covert it to the LocalDateTime class using the same “convertStringDateTime” function (line 67)
  • The second argument has to be an integer number of hours and I just use the “Integer(String)” to convert it to a number.

If any of these steps fail, then the program exits.

If there are 0 arguments (line 82-85) then set the date to the current date/time and the hours to the global constant runTimeDefault

Screen Shot 2016-04-15 at 11.10.14 AM

The next block of code takes the command line argument and trys to turn it into a date/time.  To do this I use the DateTimeFormatter class.  Basically I try three different date/time formats to see if I can find one that works.  If there is nothing that works I throw an Exception.

Screen Shot 2016-04-15 at 11.11.08 AM

Read in x-y data from the MySql Database

This function sets up the SQL statement to read the data into a JDBCXYDataset class (from jfree.org) .  The JDBCDataset class can be passed to the charting program to create the plot of the data.  The function is pretty simple, it just takes the input date/time and number of hours.  Then creates an end date/time and embeds that information into the SQL statement.  Finally it runs the MySql query and returns the data.

Screen Shot 2016-04-15 at 11.11.18 AM

Create the chart

The last step is to call the JFreeChart class to build the chart which is done on line 88-96.  Once the chart is created, I setup the axis to have a range of 0.0 –> maxDepthChart (If the water is 23 feet deep then my floor is just getting covered )  (lines 98-101).  And finally create the PNG file (line 103).

Screen Shot 2016-04-15 at 11.10.47 AM

Index Description
The Creek: IOT for the Elkhorn Creek Introduction
The Creek: Solution Architecture 1.0 Overall architecture
The Creek: Creek Board 1.1 Eagle layout of the board
The Creek: Creek Board 1.0 – RCCA A discussion of the errors in the 1.0 board
The Creek: CYPI, a Raspberry Pi to Arduino Bridge PSoC4 <--> Raspberry Pi Bridge Board
The Creek: PSoC4 Creator Schematic and Firmware Firmware to interface with the temperature and pressure sensors
The Creek: Testing the Firmware Using tools to verify that the PSoC 4 Firmware is working correctly
The Creek: Testing the Bootloader Make sure that you can load new firmware into the PSoC
The Creek: Software Architecture All of the Raspberry Pi software connections
The Creek: Install MySql Instruction to configure MySql
The Creek: Install Tomcat Instruction to configure Tomcat JSP Server
The Creek: Data Collection Java (Part 1) The Java program that reads the I2C and saves it in the database
The Creek: Data Collection Java (Part 2) The Java program that reads the I2C and saves it in the database
The Creek: Create the Chart with JFreeChart Using open source Java charting software to create plots of the Creek Depth
The Creek: Flood Event Data Processor A batch program to create analyze the database and create a table of flood events
The Creek: Flood Event Web Page A batch program to create the flood event web page
The Creek: Creek Server 1.1 Updates to all of the back off server programs to integrate charts
The Creek: JSP Web Page for www.elkhorn-creek.org The JSP program to make the table and display the website
The Creek: Raspberry Pi Clock Stretching Sorting out a bug in the system having to do with the Broadcomm Raspberry Pi Master not functioning well with clock stretching
The Creek: Creek Server 1.2 Caching the web pages to make them faster


The Creek: Install Tomcat

Apache Tomcat is a web server that allows you to create dynamic web pages using “Java Server Pages” (JSP).   Basically, you can embed Java into your HTML to create dynamic web pages.  Instead of writing Java that spits out HTML (CGI style) you write HTML with the Java embedded into it to create the dynamic part of your web page.  I use this to read the creek depth and temperature and put it into an HTML table, this will be the subject of a future post.

It is straight forward to install Tomcat onto your Raspberry Pi.  You use your old friend “apt-get install” to load Tomcat from somewhere out in the cloud.

  • sudo apt-get update
  • sudo apt-get install tomcat7  –fix-missing [wordpress turns double dash into endash… so use double -]
  • sudo apt-get install tomcat7-docs tomcat7-admin tomcat7-examples

Once you have started Tomcat you will be able to load up the default web page into your browser.  In my case it is “http://iotexpert:8080”.  The “8080” refers to the default port that Tomcat runs on.  If your install went OK, you should see the welcome screen:

Screen Shot 2016-04-03 at 10.29.35 AM

After you have it working, you will need to configure the Administration and Manager users.  To do this edit the “/etc/tomcat7/tomcat-users.xml” file and add a user.  I call my administration user “root” and gave it the excellent password “secret”.

Screen Shot 2016-04-03 at 11.35.34 AM

After you have made the changes you should restart Tomcat using “sudo service tomcat7 restart”.  Then when you click on the “manager web app” you will see this screen:

Screen Shot 2016-04-03 at 11.33.12 AM

And the Virtual Host Manager.

Screen Shot 2016-04-03 at 12.14.54 PM

At this point the Raspberry Pi has all of the required tools to make the Creek Server work.  In the next few posts Ill talk about the different programs that read the data, store it into the database and create the web pages.

Index Description
The Creek: IOT for the Elkhorn Creek Introduction
The Creek: Solution Architecture 1.0 Overall architecture
The Creek: Creek Board 1.1 Eagle layout of the board
The Creek: Creek Board 1.0 – RCCA A discussion of the errors in the 1.0 board
The Creek: CYPI, a Raspberry Pi to Arduino Bridge PSoC4 <--> Raspberry Pi Bridge Board
The Creek: PSoC4 Creator Schematic and Firmware Firmware to interface with the temperature and pressure sensors
The Creek: Testing the Firmware Using tools to verify that the PSoC 4 Firmware is working correctly
The Creek: Testing the Bootloader Make sure that you can load new firmware into the PSoC
The Creek: Software Architecture All of the Raspberry Pi software connections
The Creek: Install MySql Instruction to configure MySql
The Creek: Install Tomcat Instruction to configure Tomcat JSP Server
The Creek: Data Collection Java (Part 1) The Java program that reads the I2C and saves it in the database
The Creek: Data Collection Java (Part 2) The Java program that reads the I2C and saves it in the database
The Creek: Create the Chart with JFreeChart Using open source Java charting software to create plots of the Creek Depth
The Creek: Flood Event Data Processor A batch program to create analyze the database and create a table of flood events
The Creek: Flood Event Web Page A batch program to create the flood event web page
The Creek: Creek Server 1.1 Updates to all of the back off server programs to integrate charts
The Creek: JSP Web Page for www.elkhorn-creek.org The JSP program to make the table and display the website
The Creek: Raspberry Pi Clock Stretching Sorting out a bug in the system having to do with the Broadcomm Raspberry Pi Master not functioning well with clock stretching
The Creek: Creek Server 1.2 Caching the web pages to make them faster


The Creek: Collect Data (Part 2)

In the last post I went through all of the setup work for the I2CDB program.  Now I will give you the main course.  My program is divided into five functions

  • main: a simple function that loads the configuration file, attaches to the I2C bus, reads the data from the I2C slave and saves it into the database.
  • getI2CBus: uses the Pi4J library to attach to the I2C Master and initialize the two gobal variables bus1 and bus2.
  • readProperties: reads the “config.properties” file containing the global configuration (like the database name, userid and password) as well as the I2C registers, addresses and names.
  • insertStringDatabase: run the MySql insert function.
  • i2readVariables: read the data from the I2C, setup the insert string, and call the insert function.  This (long) function is where all of the action is at.

I am sure that more could be done to handle exceptions, mostly do a few retrys, but I decided to just print out the error message.

main

This function is called when the i2cdb program is run by the “runi2c” shell script.  It simply

  • reads in the properties file
  • attaches to the Raspberry Pi i2c master
  • reads the i2c slave
  • saves the data into the MySql database
  • print out an error message if there is some exception

Screen Shot 2016-04-10 at 9.02.35 AM

readProperties

This function reads the “config.properties” file into the global class “prop”.  The Properties class handles key/value pairs and knows how to read a file of “key=value” lines.  You can make whatever keys you want, and they have whatever value you want.  Later in the program I use the Integer(String) constructor to convert the String “123” into the Integer 123.

Screen Shot 2016-04-10 at 9.10.21 AM

insertStringDatabase

This function handles the interface to MySql:

  • 159 Takes an input sql command formatted into a string like “insert into creekdata.creekdata (created_at,depth,temperature) values (“2016-04-10 13:16:43.261″,1.568,21.199991);”
  • 163-165 Makes a connection to the “dburl” that it gets from the config.properties file. The URL specifies, which protocol (jdbc), which port and IP address and what database.  e.g “dburl=jdbc:mysql://192.168.15.82/creekdata”
  • 167-169: Executes the insert command

Screen Shot 2016-04-10 at 9.10.30 AM

getI2CBus

The Broadcom 2835 ARM controller is the main chip that runs the Raspberry Pi.  It is essentially a cell phone MCU.  As with most MCUs it has fixed function serial communication blocks embedded into the chip.  In this case the RPi device driver enumerates the I2C blocks as “0” and “1”.  I have no idea what block 0 is attached to.  Block 1 is attached to the GPIO pins on the RPi.  The geti2C function makes a connection to the two controllers.  If you are unable to attach to either of the controllers then I throw an exception.  Hopefully this will future proof this code for updated version of the RPi.

Screen Shot 2016-04-10 at 9.02.45 AM

i2readVariables

Finally the function that does all of the work.  Big picture, this function:

  • iterates over all of the number of variables specified by “i2vars”
    • Figures out the I2C Bus, Address, Register Address and # of bytes
    • Reads the bytes into a “buffer”
    • Converts the buffer to the correct endian-ness
    • Converts the buffer to the correct type (uint8, int8, uint16, int16, float,double)
    • saves the name of the MySql column into the insertNames[] array
    • saves the value of the variable into the insertVals[] array
  • builds up a string with the MySQL “insert ….” command
  • run the insert

The start of the i2readVariables (I really should have called this i2cReadVariables) gets things going

  • I noticed that the I2C reads are not perfectly reliable and it sometimes takes several reads to get a successful read.  I believe that the Broadcom chip does not like to have its I2C clock stretched.  I use the variables I2CReadSuccess and I2CRetryCount to keep track of failures and to retry.
  • Lines 51-52 declare arrays to hold the names of the MySql Columns and the Values to insert.  I declare them as “Object” so that they can hold Integers or Floats.
  • Lines 56-60 look at the properties class to figure out the I2C Bus, I2C Slave Address, I2C Register #, the type of data, and the endinaness
  • Lines 63-68 set the nbytes variable to the right number of bytes to read.  One sin that I perform in this code is to embed the property name (uint8, …) into the code.  Even worse I duplicated the name a few places.
  • Line 70: declare a buffer of bytes to hold the data read from the I2C Slave

Screen Shot 2016-04-10 at 10.12.10 AM

The next block of code reads the I2C Slave.

  • Lines 71-81 attaches to the device on the correct I2C bus.  If there a problem it throws an exception which terminates this function.  Perhaps it would have been better to have a retry scheme, but I didn’t.
  • Lines 83-84: Setup the retry and success variables.  The retry scheme counts down from the hardcoded 20.  When I was running tests I noticed that it may fail 2-3-4 times.
  • Line 86: Sets up a loop that runs until
    • You have had a successful read as indicated by I2CReadSuccess == true
    • You have retried 20 times as indicated by I2CRetryCount == 0
  • Line 88: Reads the I2C Slave
  • Lines 91-97: If there is a failed read as indicated by an Exception being thrown, then sleep for 200ms and try again.
  • Lines 101-104: If you fall out of the loop and haven’t had a succesfull read then throw an exception and exit the read process

Screen Shot 2016-04-10 at 10.23.58 AM

The next block of code uses a cool class called “ByteBuffer” to help convert the individual bytes read from the I2C Slave into Java variables of the right type.

  • Line 106 takes the array of bytes and turns it into a ByteBuffer
  • Lines 108-111 look at the endian-ness setup in the config.properties and then convert the ByteBuffer to the correct endianness.  Originally I did this design using a PSoC3 which was Big Endian… but it now uses a PSoC4 which is little endian.
  • Lines 113-118 convert the ByteBuffer to a value of the right type as specified by the config.properties file.  One trick is that Java does not like unsigned so the bitwise “and” is used to convert the signed values to unsigned.
  • Line 119 saves the MySql column name of the variable

Screen Shot 2016-04-10 at 10.31.47 AM

The last block of code builds up the MySql String and then calls the insert function

  • Lines 122 & 126-129: If the user has specified that he wants a timestamp, then create that timestamp and add it to the MySql Insert statement
  • Line 124: setup the MySql Statement template
  • Lines 130-133 iterate through the column names and add them to the MySql Statement
  • Lines 135-139 if they have asked for a timestamp then add that value to the insert statement
  • Lines 141-143 iterate through all of the values and add them to the insert statement
  • Lines 144-147: finish the MySql Statement, print it out and run it.

Screen Shot 2016-04-10 at 10.37.34 AM

I like this program because I can create a new template file without having to change the program.  Basically I created a generic interface that can bridge from an I2CSlave that collects data and then write that data into the database.

In the next posts Ill show you the user interface web pages.

Index Description
The Creek: IOT for the Elkhorn Creek Introduction
The Creek: Solution Architecture 1.0 Overall architecture
The Creek: Creek Board 1.1 Eagle layout of the board
The Creek: Creek Board 1.0 – RCCA A discussion of the errors in the 1.0 board
The Creek: CYPI, a Raspberry Pi to Arduino Bridge PSoC4 <--> Raspberry Pi Bridge Board
The Creek: PSoC4 Creator Schematic and Firmware Firmware to interface with the temperature and pressure sensors
The Creek: Testing the Firmware Using tools to verify that the PSoC 4 Firmware is working correctly
The Creek: Testing the Bootloader Make sure that you can load new firmware into the PSoC
The Creek: Software Architecture All of the Raspberry Pi software connections
The Creek: Install MySql Instruction to configure MySql
The Creek: Install Tomcat Instruction to configure Tomcat JSP Server
The Creek: Data Collection Java (Part 1) The Java program that reads the I2C and saves it in the database
The Creek: Data Collection Java (Part 2) The Java program that reads the I2C and saves it in the database
The Creek: Create the Chart with JFreeChart Using open source Java charting software to create plots of the Creek Depth
The Creek: Flood Event Data Processor A batch program to create analyze the database and create a table of flood events
The Creek: Flood Event Web Page A batch program to create the flood event web page
The Creek: Creek Server 1.1 Updates to all of the back off server programs to integrate charts
The Creek: JSP Web Page for www.elkhorn-creek.org The JSP program to make the table and display the website
The Creek: Raspberry Pi Clock Stretching Sorting out a bug in the system having to do with the Broadcomm Raspberry Pi Master not functioning well with clock stretching
The Creek: Creek Server 1.2 Caching the web pages to make them faster