In the previous post I talked about using JFreeChart to create a plot of the last 8 hours. I have never been satisfied with only 8 hours but had never spent the time to fix it. To make matters worse I also wanted to have a website where I could see a list of the the flood events as well as plots of that data. Well, this week I am going remedy this annoyance, and while I am at it, I am going to fix a bunch of things that I left hanging.
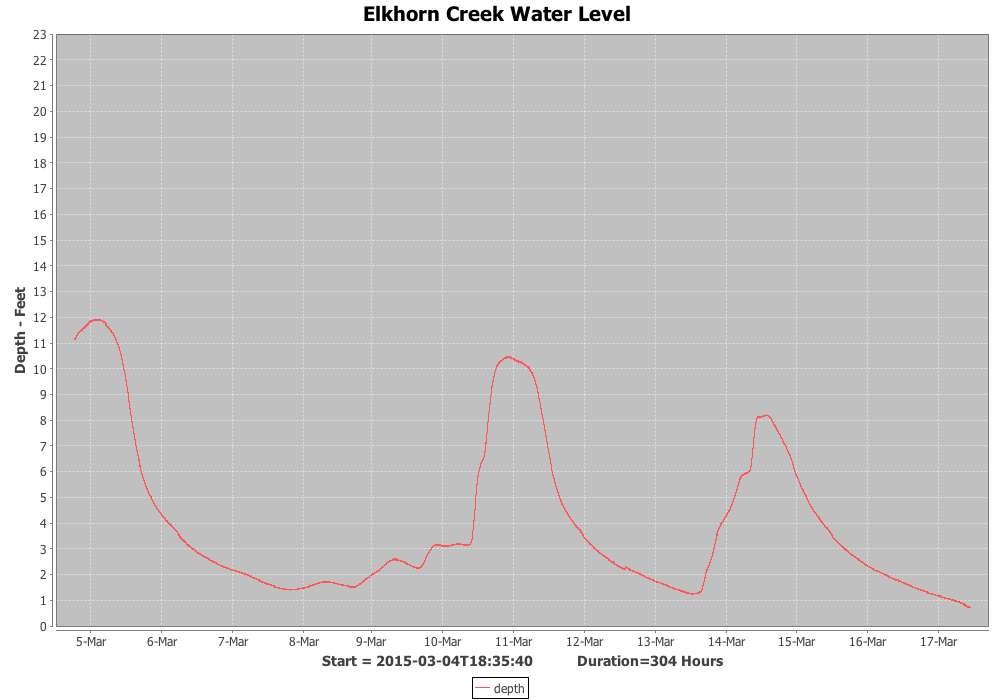
The Elkhorn Creek can do some crazy things. Here is a plot that I made while I was working on these changes. This was a spring flood that lasted 304 hours aka 12.6 days:
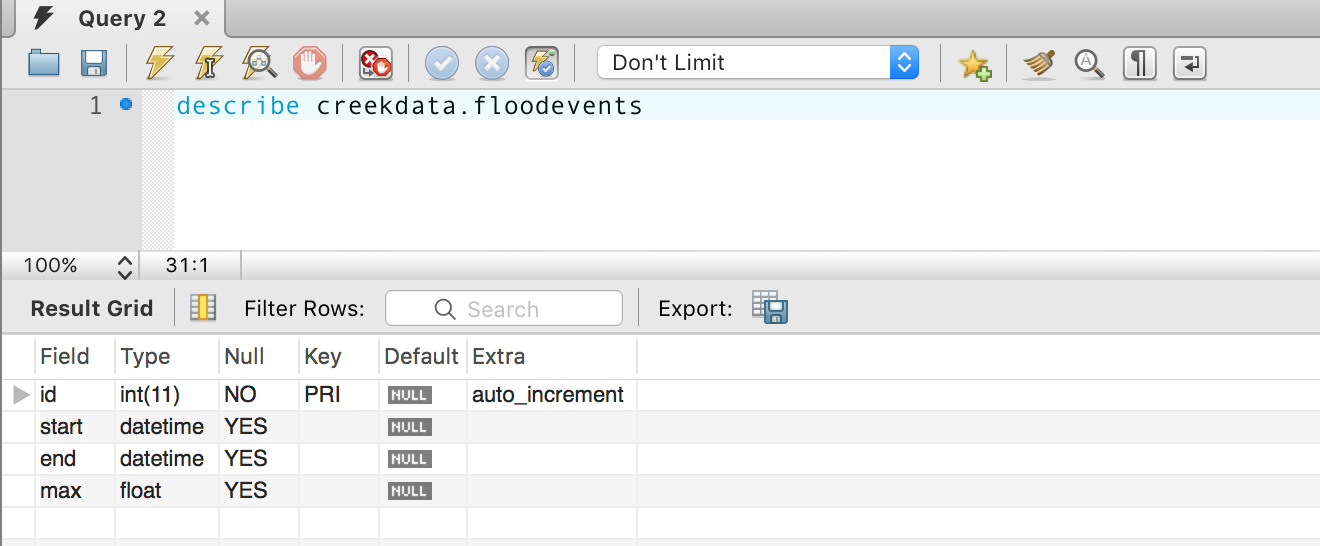
As there are more than 1M records in my database I knew that the Raspberry Pi didn’t have the horsepower to scan the data and create the charts in real time. The first step was to create a table to hold statistics about the events. I decided to store a timestamp for the start and end as well as the maximum depth. Here is the table description:
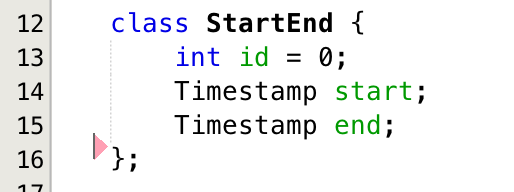
The next step was to create a java program called “ProcessEvents.java” that would analyze the raw data in the creekdata table using the “known” events from the floodevents table. The first thing that I did was create a helper class called StartEnd that hold one record from the floodevents table. The lowest “id” in the floodevents table is 1 so the 0 default for id represents a record that is not yet in the database.
The program works by implementing the following algorithm.
- Line 52: set a flag that you have not found an event
- Line 53: scan the floodevent database
- Line 58: If you didn’t find an event or there is an event ongoing (it has a start but no end)
- Line 60: If there has never been an event then start scanning for a “start” the creekdatase from the start (all data)
- Line 63: If there has been an event, then start scanning for a “start” the creekdata after the end of the current event
- Line 66: If you don’t find a “start” then there are no more events (or you didnt find one at all) so stop scanning
- Line 71: Now that you have a start, look for an “end”
- Line 75: If you found a new event then save it in the database
- Line 79: If you are in the middle of an event update the database

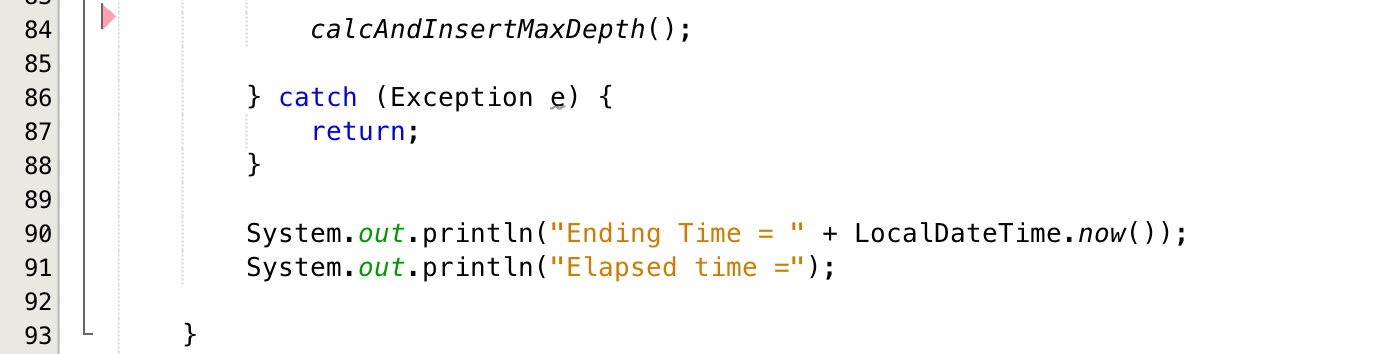
Once all of the events have been found and put into the floodevents database the last step is to look at all of the events and fix the “max” depth column [Line 84]
The “findStart” function returns a timestamp for the start of the next event. If it doesn’t find one then it return null. The function looks through all of the creek data starting from the beginning [line 149] or after a time [line 151]. My program has a little bit of hysteresis in that it “starts” a flood when it get to 2.0 feet and it “ends” a flood when it gets below 0.75 feet. If there is a little bit of noise around the upper trip point or the lower trip point it won’t turn on/off.
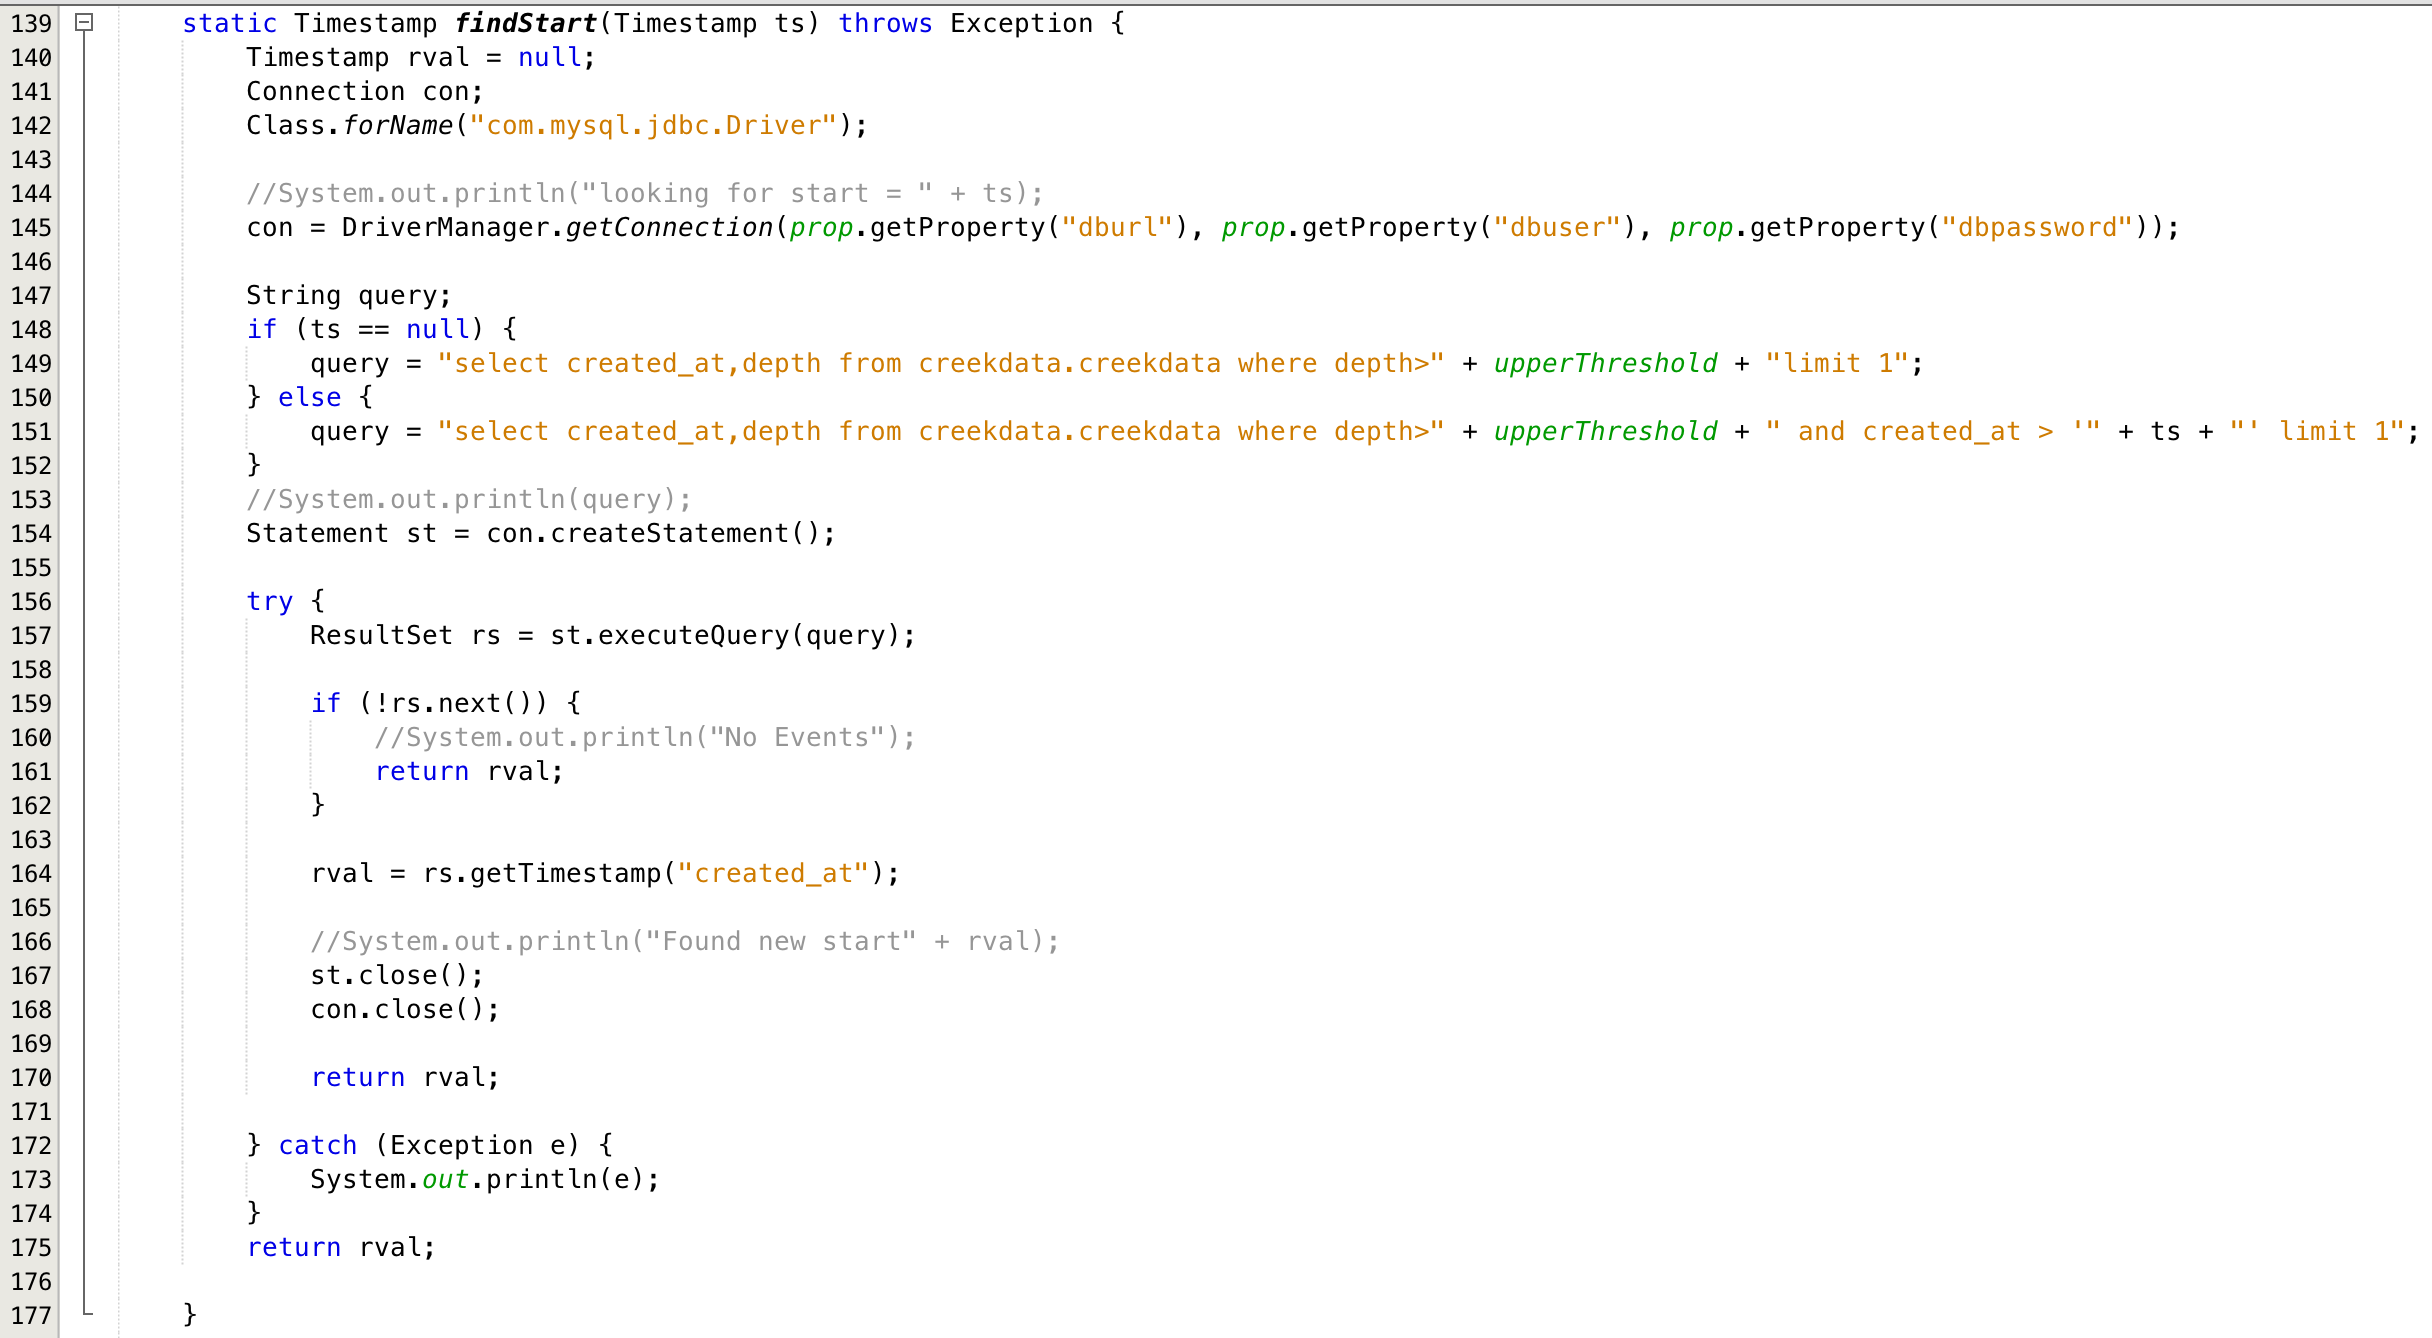
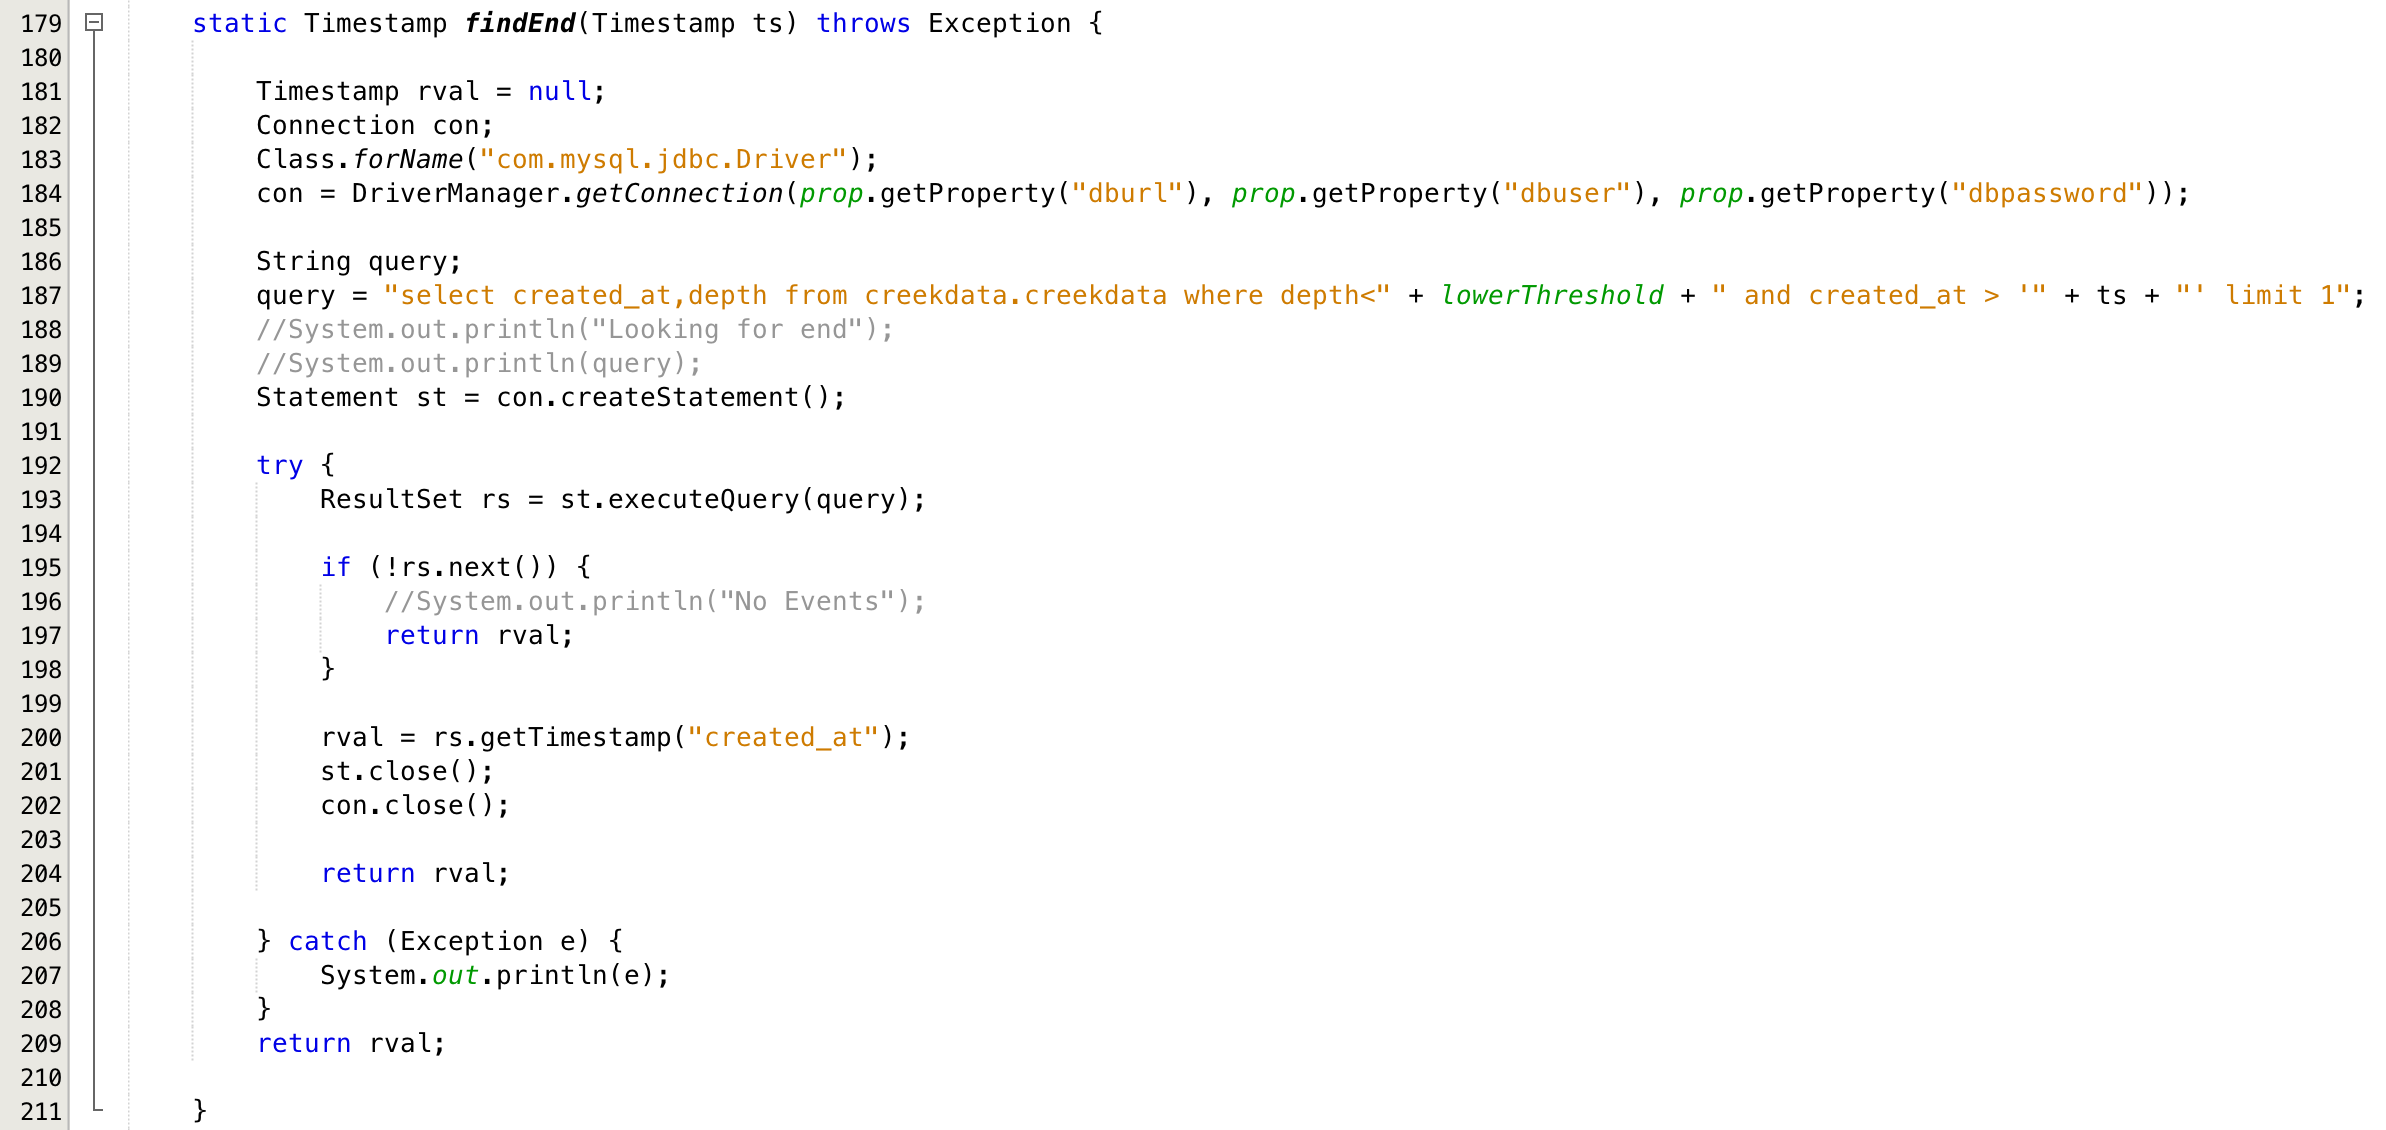
The “findEnd” function returns a timestamp for the end of the current event. If it doesn’t find one then it return null.
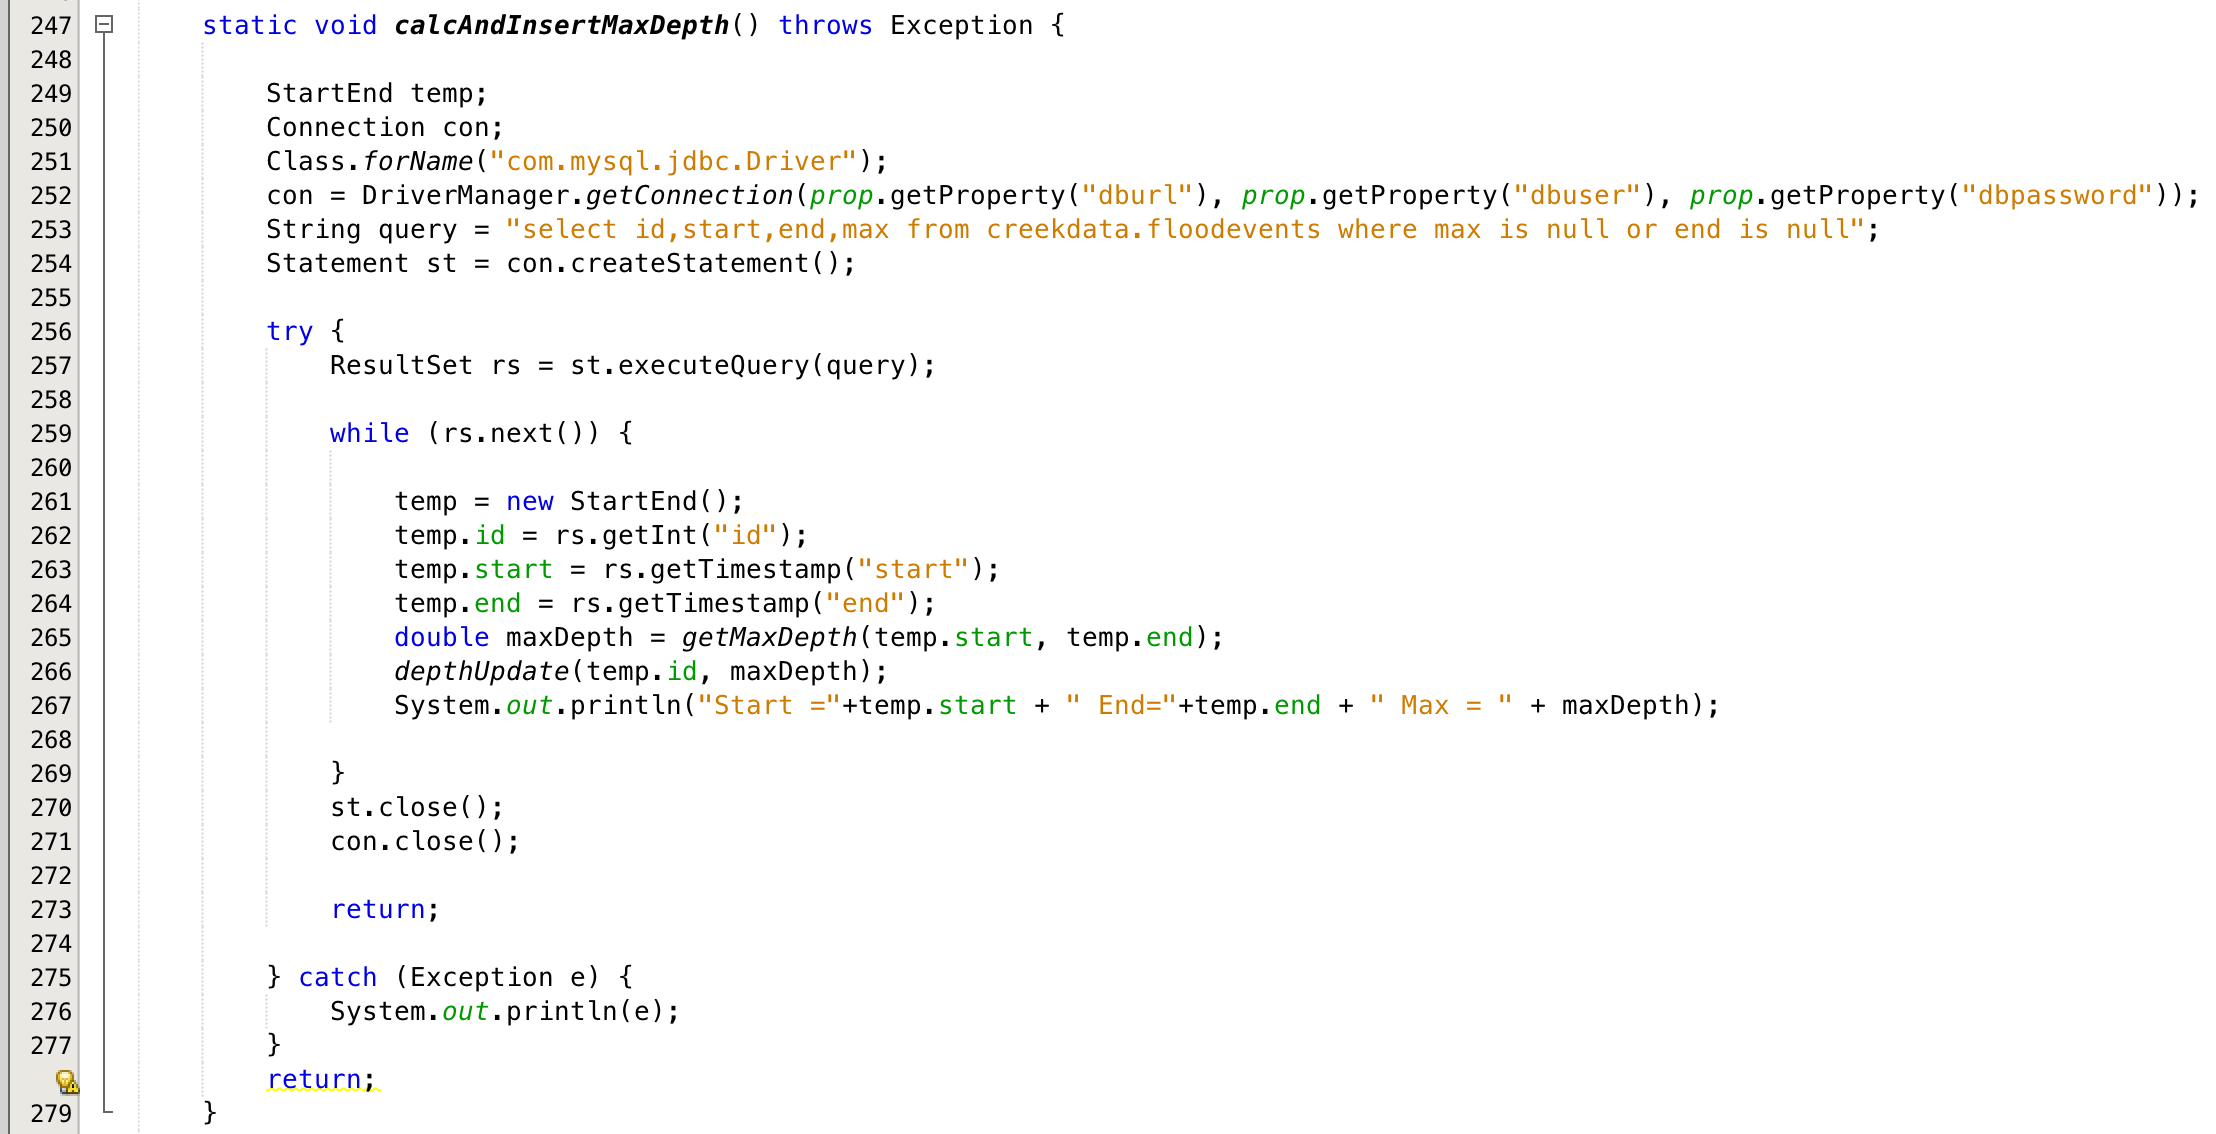
The “calcAndInsertMaxDepth” function:
- Sets up a query to scans all of the events in the floodevents database [line 253]
- Loop through all of the events [line 259]
- Foreach event find the maximum depth [line 265]
- Update the table with the current maximum depth [line 266]
The “getMaxDepthFunction” function uses a feature of mysql that allows you to perform a function during a query. In this case it looks for all of the data between a start and end and calculates the “max(depth)”. This query will return only one resultset. I get the maximum depth value from the result set using the “rs.getFloat(“max(depth)”)”
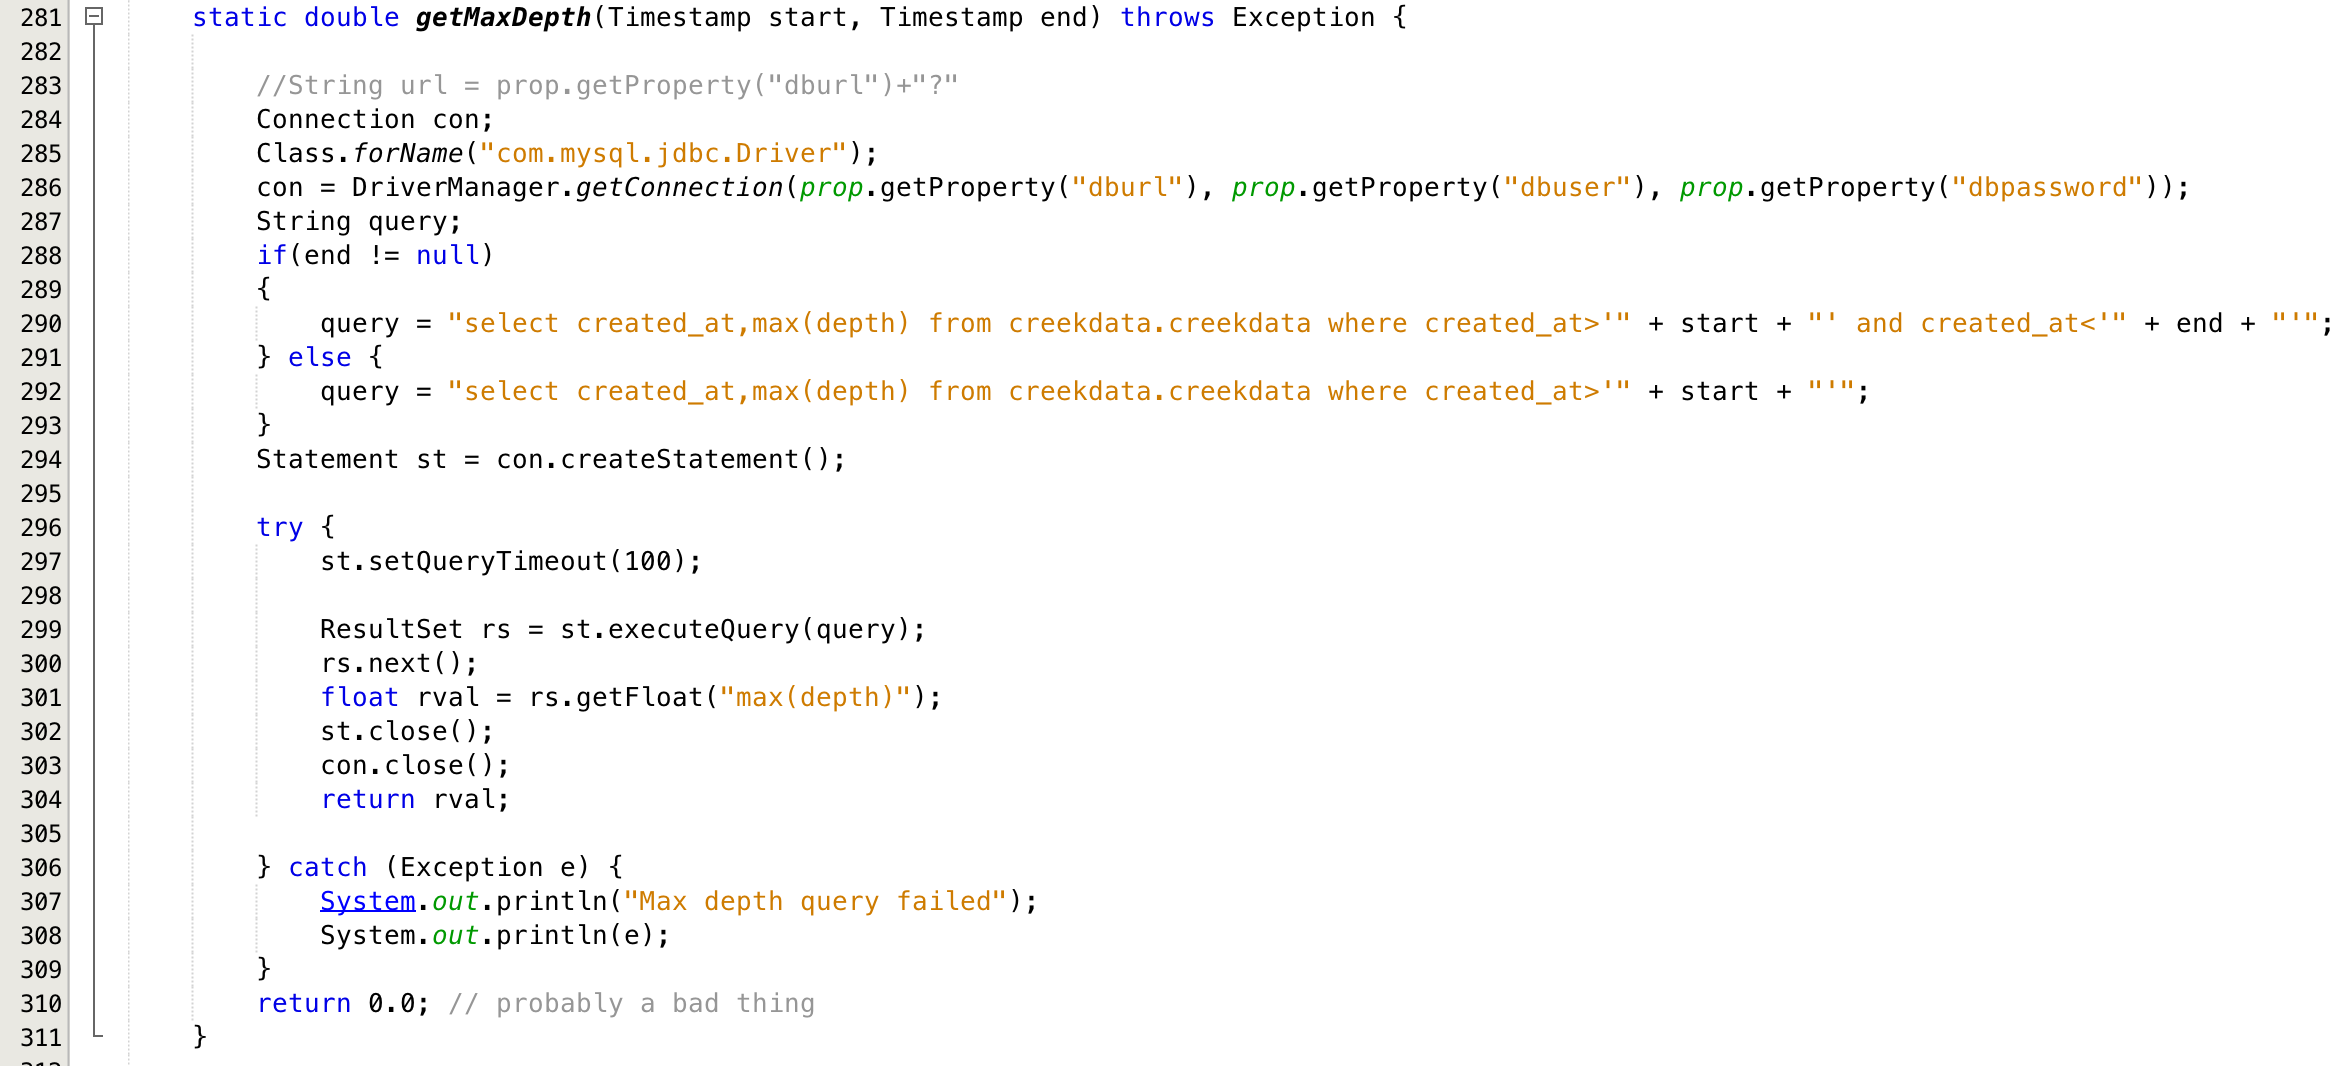
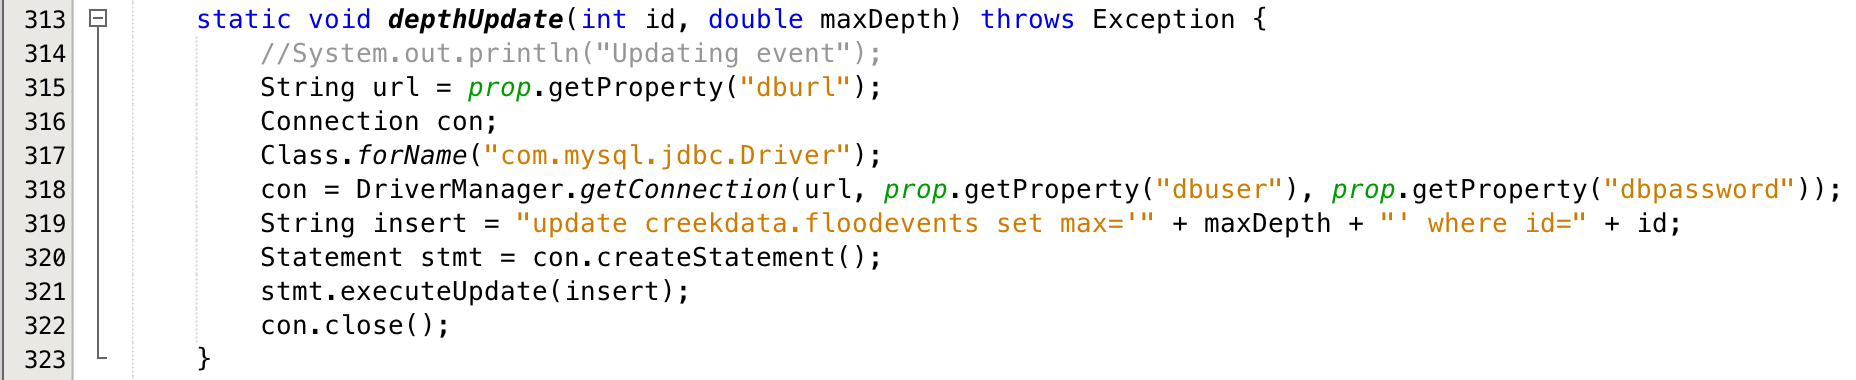
The “depthUpdate” function takes in an “id” of one of the events and a calculated “maxDepth” then updates the “max” field for that id in the floodevents database.
All of this code is available on the iotexpert github site in the java program “ProcessEvents.java” which is in the “getCreek/src” directory.
In the next post I will talk about all of the modifications to the chart creation program that I made to support creating the flood events charts.
Index
Description
The Creek: IOT for the Elkhorn Creek
Introduction
The Creek: Solution Architecture 1.0
Overall architecture
The Creek: Creek Board 1.1
Eagle layout of the board
The Creek: Creek Board 1.0 – RCCA
A discussion of the errors in the 1.0 board
The Creek: CYPI, a Raspberry Pi to Arduino Bridge
PSoC4 <--> Raspberry Pi Bridge Board
The Creek: PSoC4 Creator Schematic and Firmware
Firmware to interface with the temperature and pressure sensors
The Creek: Testing the Firmware
Using tools to verify that the PSoC 4 Firmware is working correctly
The Creek: Testing the Bootloader
Make sure that you can load new firmware into the PSoC
The Creek: Software Architecture
All of the Raspberry Pi software connections
The Creek: Install MySql
Instruction to configure MySql
The Creek: Install Tomcat
Instruction to configure Tomcat JSP Server
The Creek: Data Collection Java (Part 1)
The Java program that reads the I2C and saves it in the database
The Creek: Data Collection Java (Part 2)
The Java program that reads the I2C and saves it in the database
The Creek: Create the Chart with JFreeChart
Using open source Java charting software to create plots of the Creek Depth
The Creek: Flood Event Data Processor
A batch program to create analyze the database and create a table of flood events
The Creek: Flood Event Web Page
A batch program to create the flood event web page
The Creek: Creek Server 1.1
Updates to all of the back off server programs to integrate charts
The Creek: JSP Web Page for www.elkhorn-creek.org
The JSP program to make the table and display the website
The Creek: Raspberry Pi Clock Stretching
Sorting out a bug in the system having to do with the Broadcomm Raspberry Pi Master not functioning well with clock stretching
The Creek: Creek Server 1.2
Caching the web pages to make them faster
No comment yet, add your voice below!