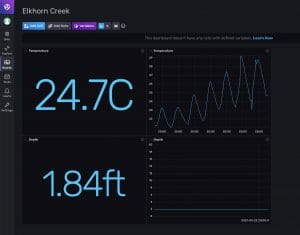
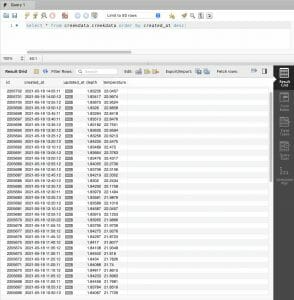
The last piece in the Elkhorn Creek IOT puzzle are the webpages that let you view the creek data on the internet. There are two pages, one with a table of the data and a chart and the other a dump CSV file of the database. When it came time to work on this post, I realized that I had little memory of the evils deeds I had originally done to make the JSP pages work. As I sorted through the code that was existing on the current production Raspberry Pi environment, all I could see was an undocumented mess.
Making dynamic web pages is ugly business. As best I can tell, there is no clean way do this job (though I am planning on showing some ways to make it better in future posts). A JSP is an interleaved mashup of HTML and Java. To make a JSP, you create a file with sections of both languages separated by markers. In the following example you can see an example that rolls two dice (generates a random number between 1-6). The sections of code that are Java are marked with a “<%” and a “%>”.
<html>
<head><title>Roll the dice</title></head>
<body>
<%
int die1 = (int)(Math.random() * 6 + 0.5);
int die2 = (int)(Math.random() * 6 + 0.5);
%>
<h2> Die1 = <%= die1 %></h2>
<h2> Die2 = <%= die2 %></h2>
<a href=”<%= request.getRequestURI() %>”><h3>Try Again</h3></a>
</body>
</html>
When a web request is made, the Tomcat JSP Webserver takes the page (in JSP format)
- Converts it to Java (turns raw HTMLs into java commands e.g. “<html>” turns into “out.println(“<html>”);”
- Runs the compiler
- Executes the java program and pipes the output back to your web browser
To makes things go faster Tomcat will cache the output of 1+2 and only rerun it if something has changed.
Since I last worked on this system there is one thing that had greatly improved. Specifically, this time I knew about Netbeans which is the Sun Microsystems IDE for editing Java. Netbeans is cool for this project because:
- It knows about Java (so it knows how to edit, highlight, search, refactor, syntax check etc)
- It knows about JSP (so it knows how to edit…)
- It knows how to edit Java Properties files
- It has a JSP web server (GlassFish) integrated into the tool. This allowed me to debug the web pages on my Mac (instead of on the RPi)
- It knows how to make “war” files (the file format that you use to deploy a JSP web application)
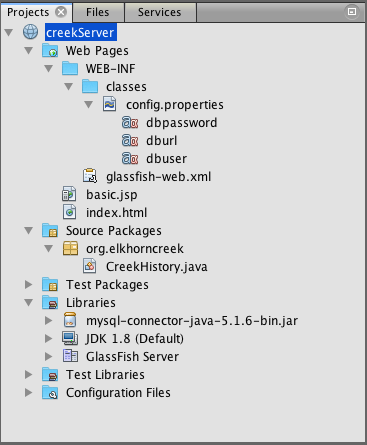
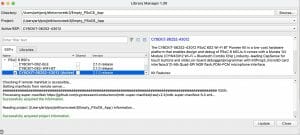
The Netbeans project navigator lets you look at (and into) all of the files that are part of the JSP Web Application. In the screenshot below you can see the organization of my project. It has
- A classes folder which will contain the compiled java classes. It can also hold a “properties” file. In this case I have a properties file called “config.properties” which contains the URL, User and Password for the mysql database
- basic.jsp: The JSP file which displays the table and graph
- index.html: a file which just loads the basic.jsp
- CreekHistory.java: A java class to interact with the MySql Database. This is essentially the “Model” of the MVC
- A libraries folder with mysql-connector-java-5.1.6-bin.jar: the mysql library to connect to the database
I like to use the Model View Controller (MVC) design paradigm of user interface programming. In this methodology the model represents the data. It knows nothing about user interfaces, how to create them, how to display them. It is completely agnostic about GUI. The view is a mechanism to display data. In this JSP web application, the view is just the raw html that is displayed on the web. The last piece is the controller (aka the view controller). It takes data out of the model and puts it into the view. Here is a nice picture from Apples website (but if you google you will find lots of discussion about MVC programming)

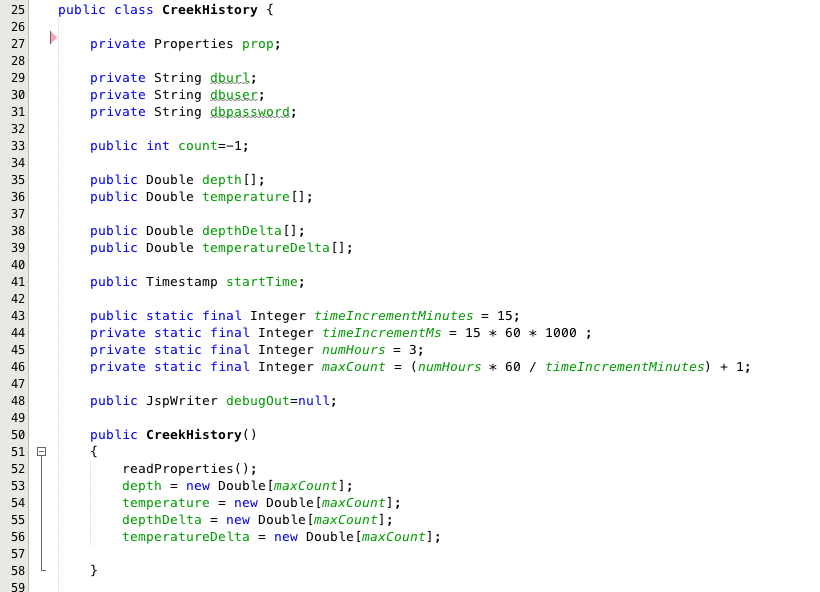
The first thing that I created was Java class called CreekHistory.java. This class has the responsibility to read the last 4 hours of depth and temperature data from the MySql database and put it into 15 minute buckets (using linear interpolation), and store the results into an array for easy retrieval by the controller.
In the first block of code (lines 29-31) I declare a few private variable that hold information out of the properties file about the database connection. The I declare a bunch of public variables which are the data interface to the model.
- depth[] + temperature[] arrays of doubles that contain the depth and temperature in 15 minute buckets
- depthDelta[] and temperatureDelta[] doubles that contain the change in depth and temperature since the start aka [0]
- startTime a timestamp of the first datapoint (from the MySql database)
In the next clock of code (lines 43-46) I declare some constants (so that I don’t have magic numbers in my code).
On line 48 I declare a reference to a JspWriter. This reference will allow me to print debugging information to the HTML output. This is a clear violation of the MVC so I only use it for printing debugging information as it is a serious PITA to debug JSP code.
And finally the constructor which calls the function to read the properties file and then initialize the arrays.
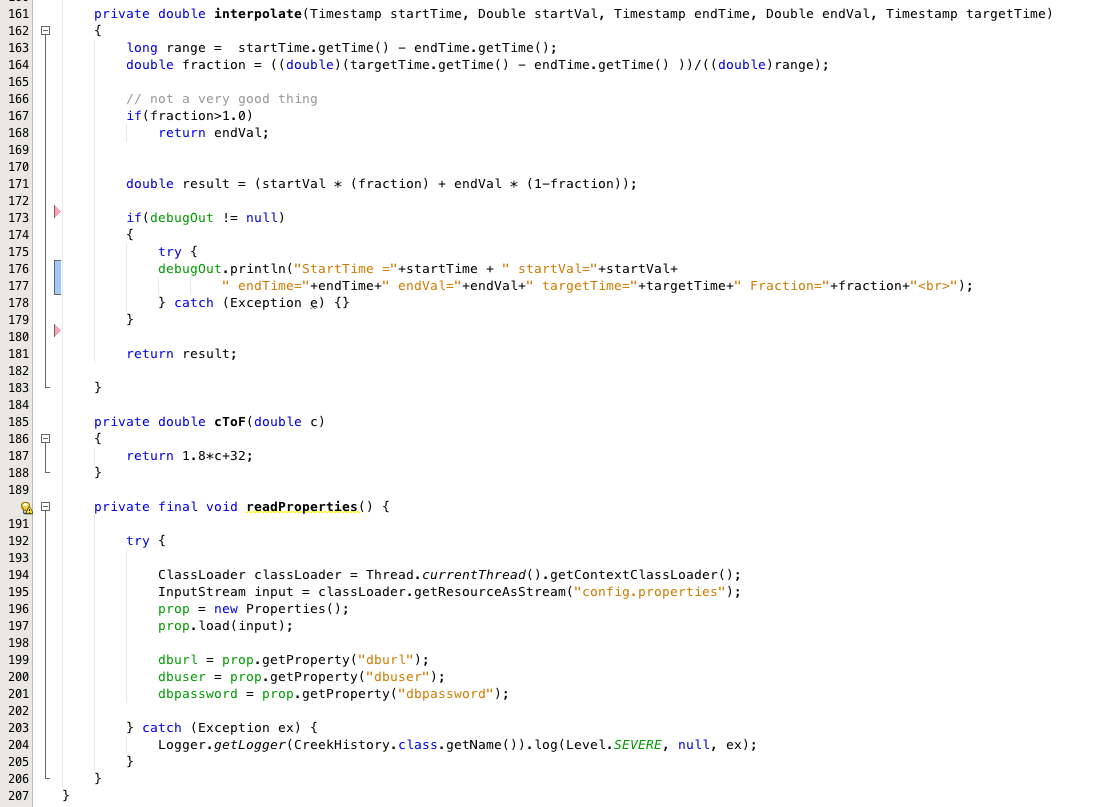
In the next section of code I have three helper functions.
The first function “interpolate” just performs a linear interpolation between two datapoints given known timestamps.
The “cToF” function just converts the a temperature from the bogus Centigrade units to useable Fahrenheit.
The last function, “readProperties” finds the config.properties file and reads the values into the global Properties class. The only magic in this function occurs on lines 194-195 where it uses the ClassLoader object to search through the “classes” directory to find the file with the properties.
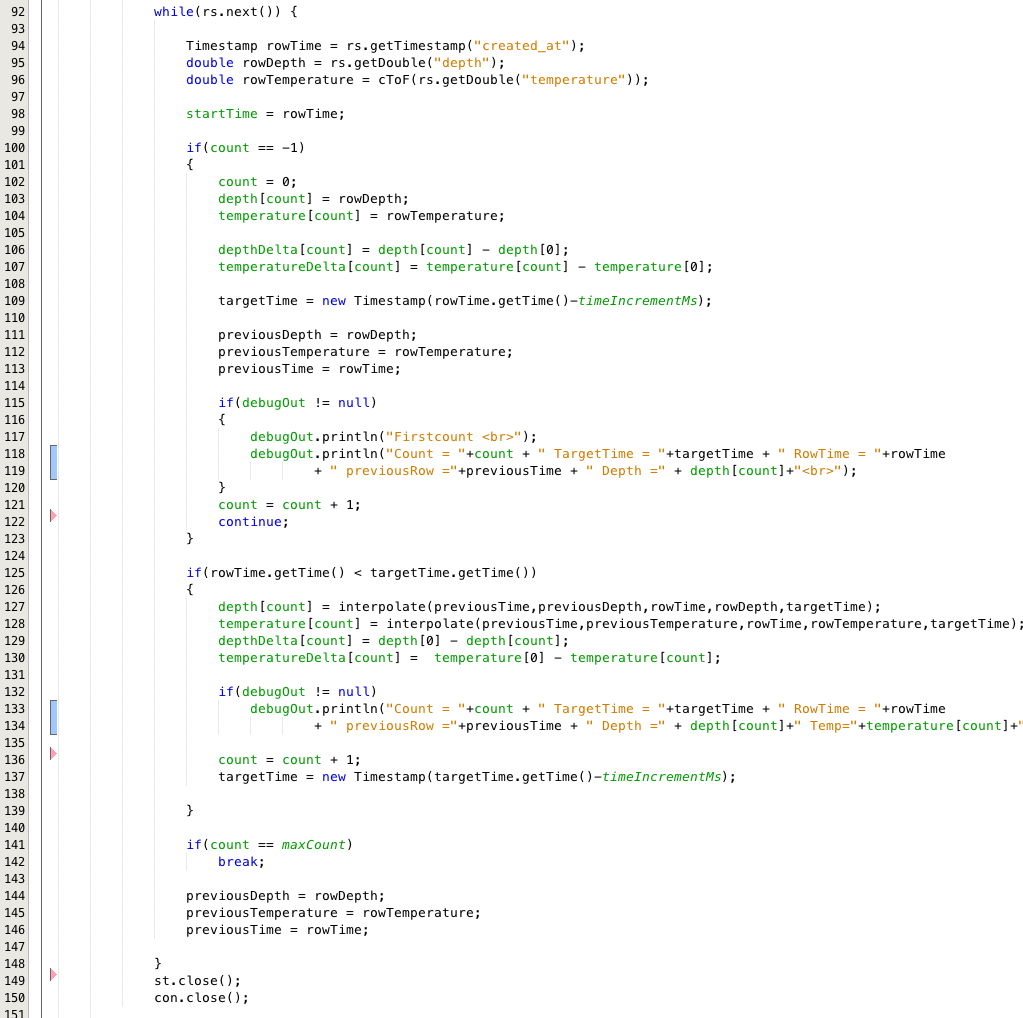
The last function is “loadData” which has two sections. The first section sets up and executes the MySql query to get the current Elkhorn Creek data.
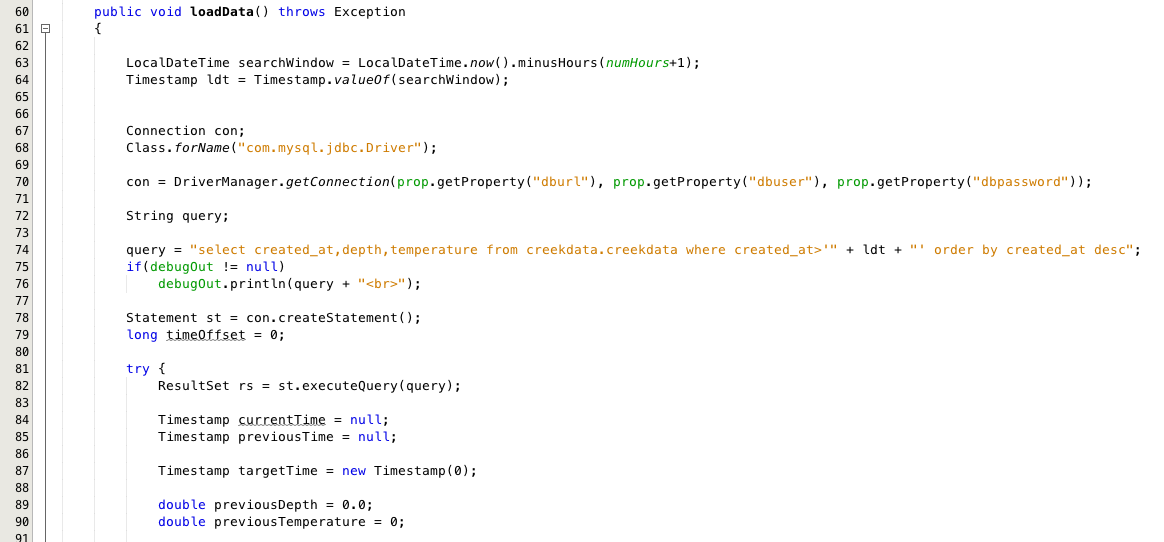
Once it has the data, it iterates through the data from the MySql database to find the datapoints that bracket the 15 minute buckets, then interpolates the results, then store it in the array.
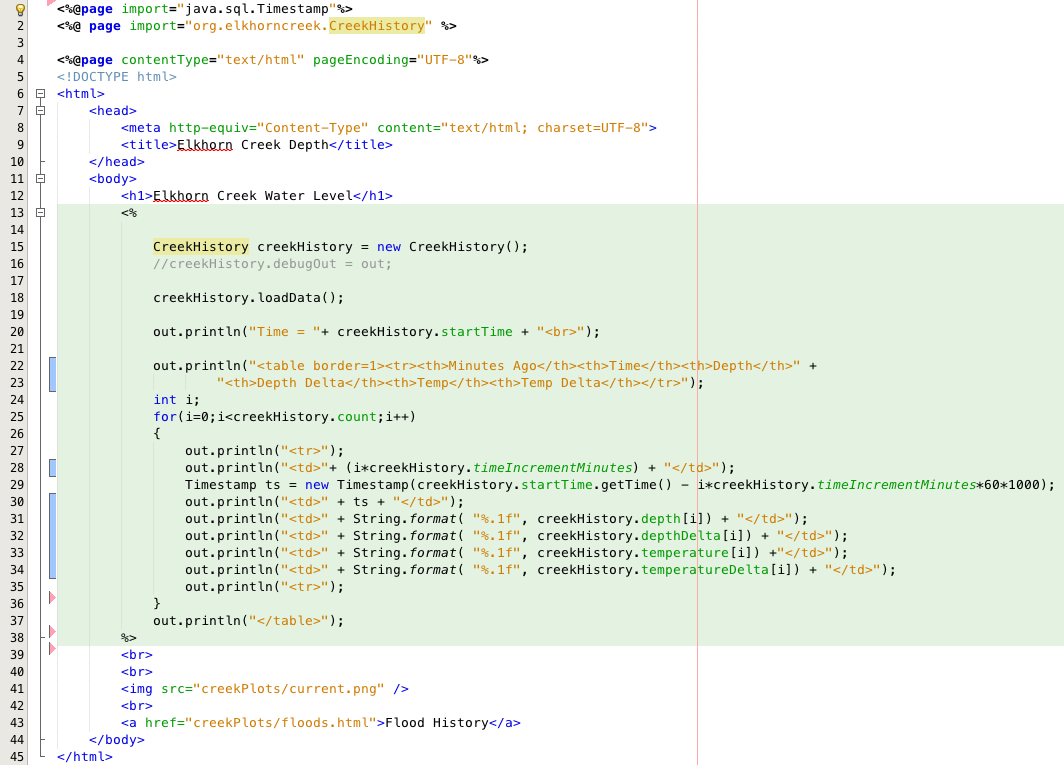
Finally the last part of the web server is the JSP page which outputs the actual HTML.
Lines 1-2 load two Java classes which I use on other sections of the page. Specifically the Timestamp class which I use to do Time math, and the CreekHistory class which is the “model”
Lines 15-18 initialize the CreekHistory model object and tell it to load its data. Notice on line 16 if I set the CreekHistory “out” public variable then it will put out debugging information.
Lines 24-37 just spit out an HTML table of the data from the CreekHistory model.
That is all there is to it. As with all of the code on this website you can get it from github.
Index
Description
The Creek: IOT for the Elkhorn Creek
Introduction
The Creek: Solution Architecture 1.0
Overall architecture
The Creek: Creek Board 1.1
Eagle layout of the board
The Creek: Creek Board 1.0 – RCCA
A discussion of the errors in the 1.0 board
The Creek: CYPI, a Raspberry Pi to Arduino Bridge
PSoC4 <--> Raspberry Pi Bridge Board
The Creek: PSoC4 Creator Schematic and Firmware
Firmware to interface with the temperature and pressure sensors
The Creek: Testing the Firmware
Using tools to verify that the PSoC 4 Firmware is working correctly
The Creek: Testing the Bootloader
Make sure that you can load new firmware into the PSoC
The Creek: Software Architecture
All of the Raspberry Pi software connections
The Creek: Install MySql
Instruction to configure MySql
The Creek: Install Tomcat
Instruction to configure Tomcat JSP Server
The Creek: Data Collection Java (Part 1)
The Java program that reads the I2C and saves it in the database
The Creek: Data Collection Java (Part 2)
The Java program that reads the I2C and saves it in the database
The Creek: Create the Chart with JFreeChart
Using open source Java charting software to create plots of the Creek Depth
The Creek: Flood Event Data Processor
A batch program to create analyze the database and create a table of flood events
The Creek: Flood Event Web Page
A batch program to create the flood event web page
The Creek: Creek Server 1.1
Updates to all of the back off server programs to integrate charts
The Creek: JSP Web Page for www.elkhorn-creek.org
The JSP program to make the table and display the website
The Creek: Raspberry Pi Clock Stretching
Sorting out a bug in the system having to do with the Broadcomm Raspberry Pi Master not functioning well with clock stretching
The Creek: Creek Server 1.2
Caching the web pages to make them faster
No comment yet, add your voice below!