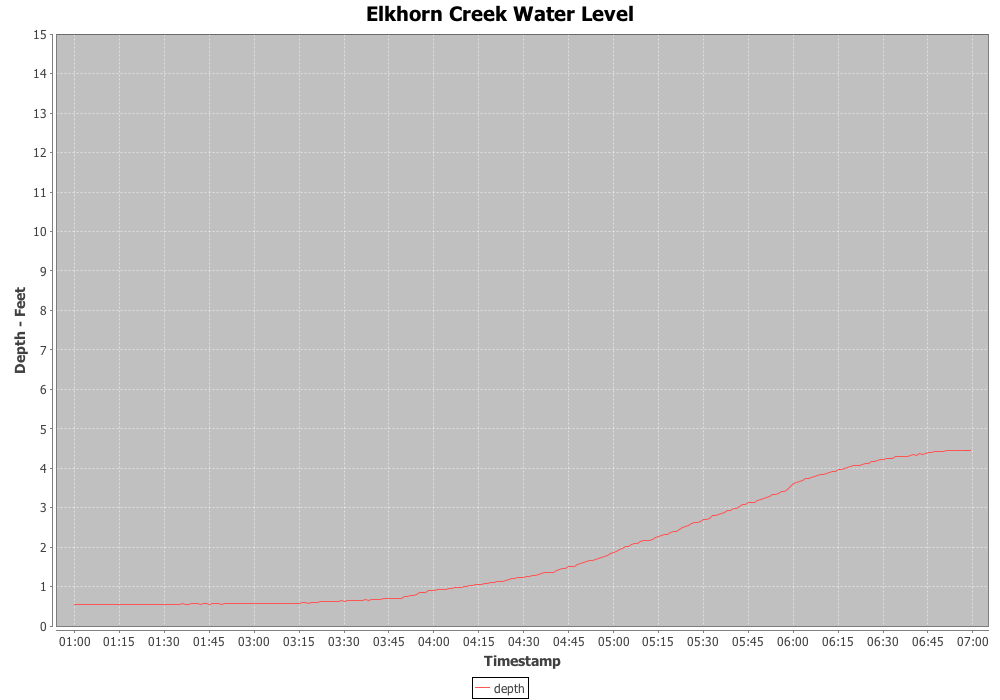
It is almost always better to see data in a plot than as raw values. I knew that I wanted to be able to see the Elkhorn Creek Water Level.
The charting software that I am using has been done and re-done several times (including as I prepared this post). I was committed to using Java and I wanted to find a toolkit for building charts. After searching around on the internet a bit, I settled on JFreeChart which is an open source Java based plotting package. I like to contribute to the good work of people so I bought the developers guide for $65 and it was well worth it.
I knew that creating a chart would take a bit of CPU and that the Raspberry Pi was a bit under powered as far as that goes. This lead me to create a batch program which I run via crontab directly after I have collected the data (once per minute). It appears to the web user that the chart is “fresh”, but really it is up to 1 minute old.
The “makeChart” program is broken up into the following parts
- Setup the global settings
- Read and process the command line arguments
- Read in x-y data from the MySql Database
- Make the chart
Setup the global settings
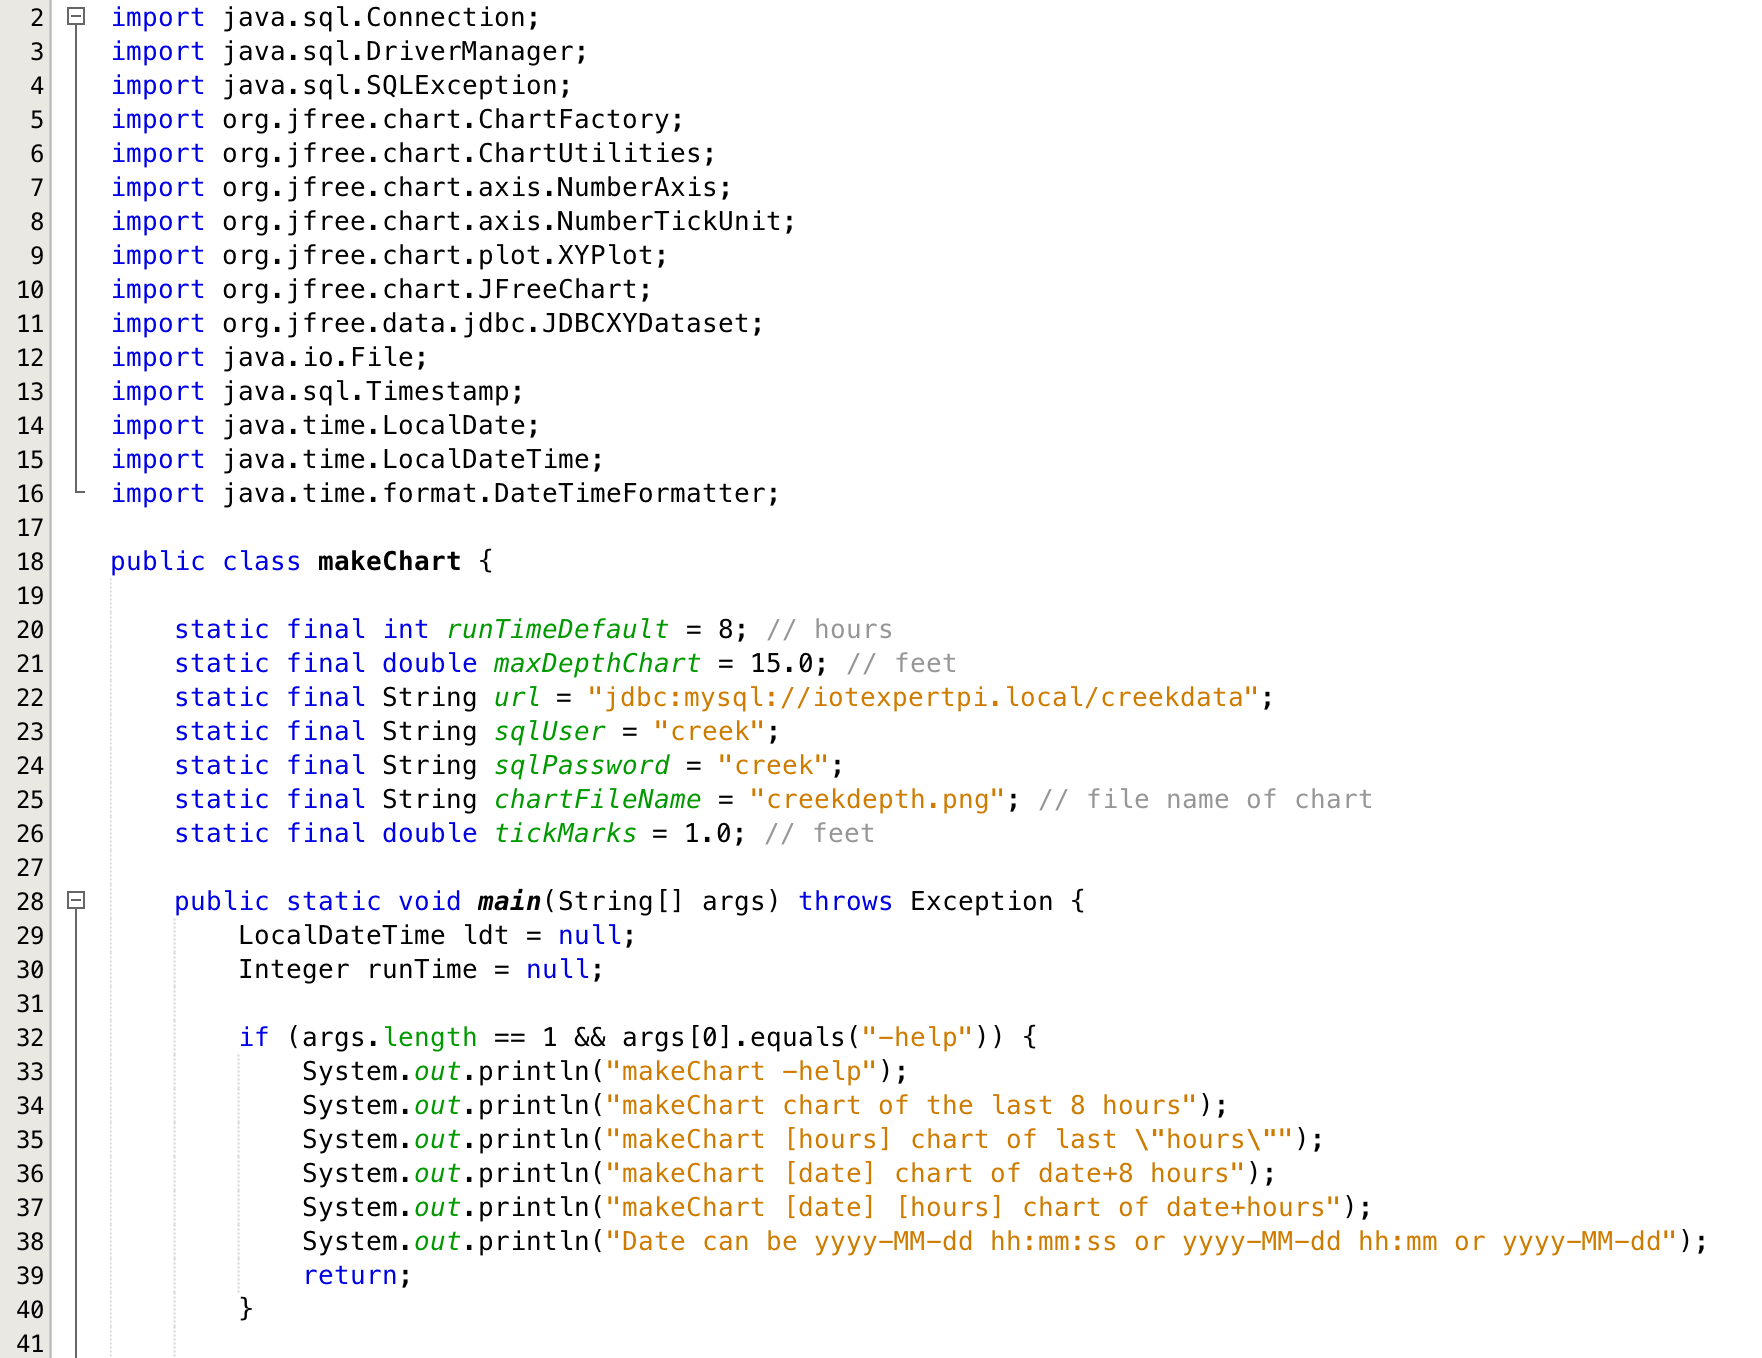
The first block of code (lines 2-16) just imports the different classes that I use in this program. To make the org.jfree stuff work you need to have jcommon-1.0.16.jar and jfreechart-1.0.13.jar in your class path. You can download them from the source forge project directory https://sourceforge.net/projects/jfreechart/files/
The second block of code (lines 20-26) setup global configuration variables which I declare as “final” so that I know that they are immutable. It probably would have been better to make the filename be configurable with the command line arguments, but that is something for another day. Publishing the MySql User and Password would be a problem except, that user can only access the MySql database from inside my network.
The last block of code (lines 32-40) just prints out the command like usage if they program is run with the “-help” argument.
Read and process the command line arguments
The next step is setting up the Start date/time and the number of hours. Java has a cool class called “LocalDateTime” which I use to represent the starting time of the data. There is an absolutely mind boggling number of issues when you deal with dates and times. I was to far down the road, but if I had it to do over again I would have used Joda Time.
If there is only 1 argument then there are two possibilities
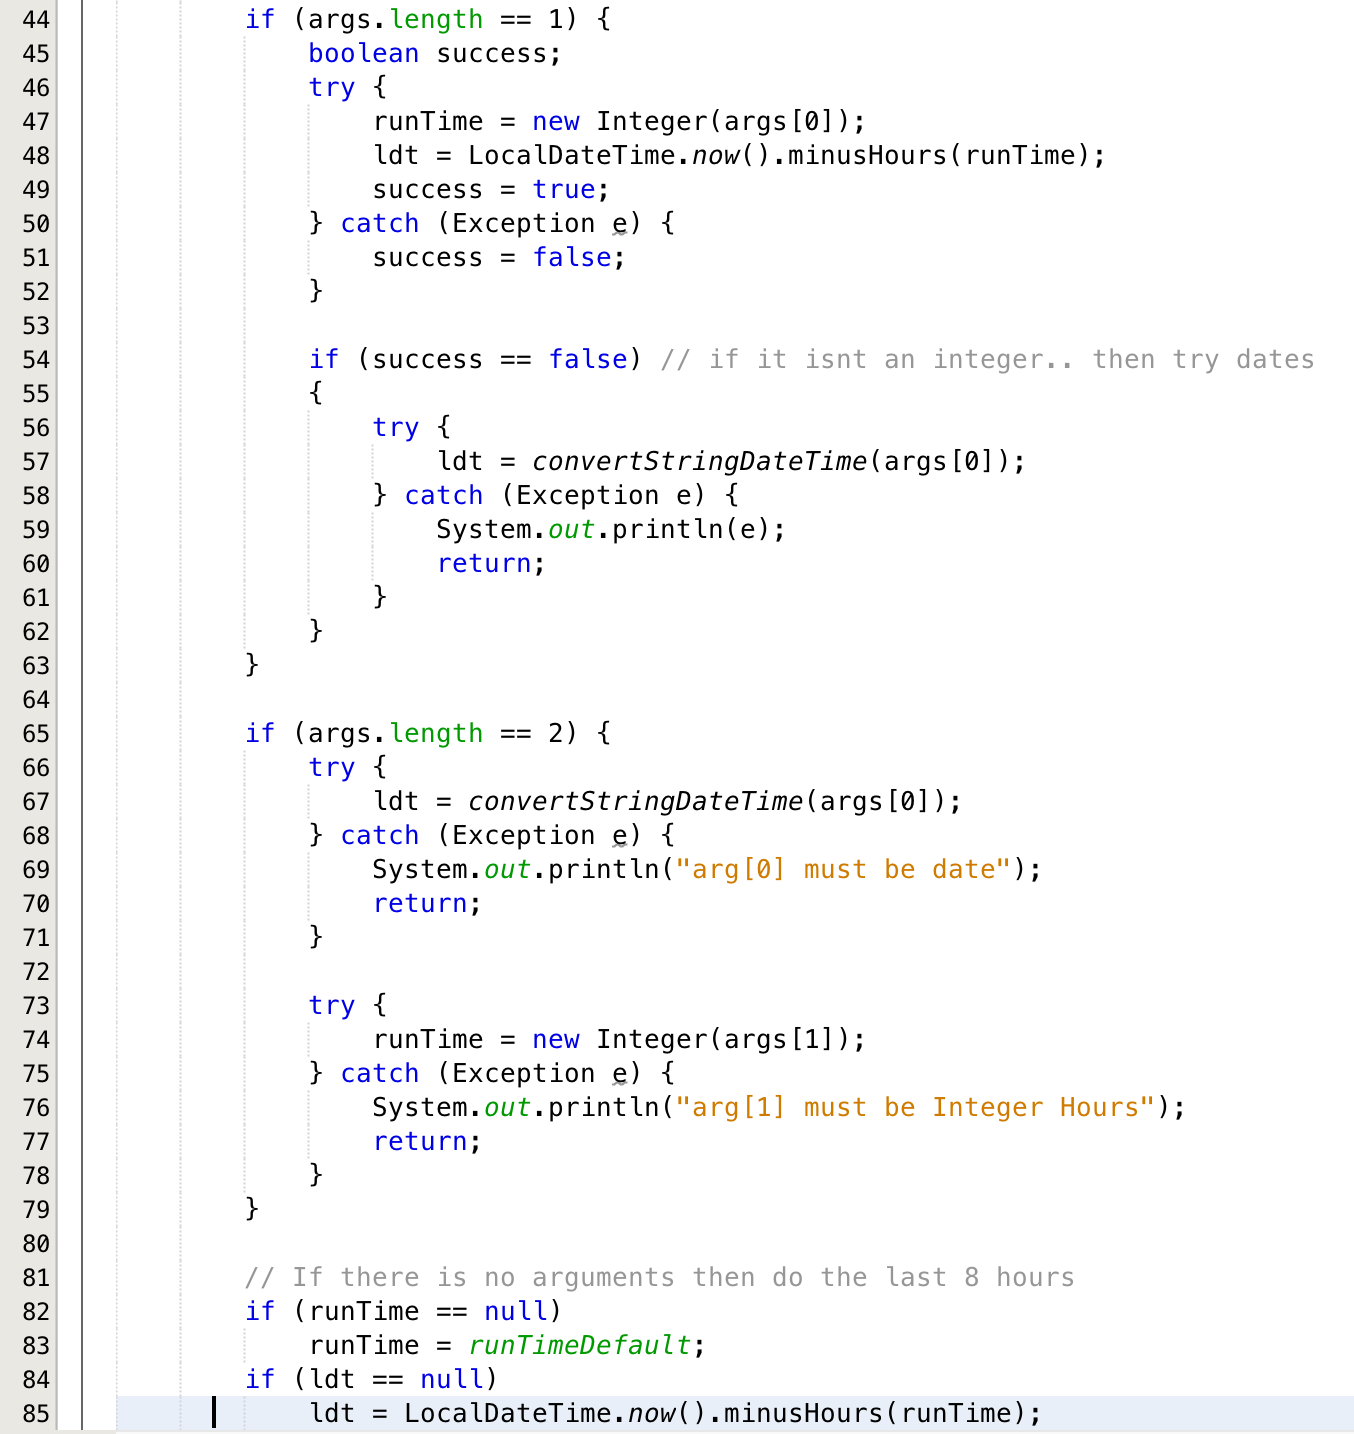
Lines 44-60: The user did 1 command line argument
- They typed in a number of hours. On line 47 if the argv[0] string converts to an Integer with no Exception being thrown then I assume that is a number of hours from the current time
- They typed in a date in the form of “yyyy-MM-dd” or “yyyy-MM-dd hh:mm:ss” or “yyyy-MM-dd hh:mm”. If they typed 1 argument and it isn’t an integer then I called the “convertStringDateTime” function to try to parse the string.
Lines 65-80: The users did 2 command line arguments
- The first argument has to be a date and I covert it to the LocalDateTime class using the same “convertStringDateTime” function (line 67)
- The second argument has to be an integer number of hours and I just use the “Integer(String)” to convert it to a number.
If any of these steps fail, then the program exits.
If there are 0 arguments (line 82-85) then set the date to the current date/time and the hours to the global constant runTimeDefault
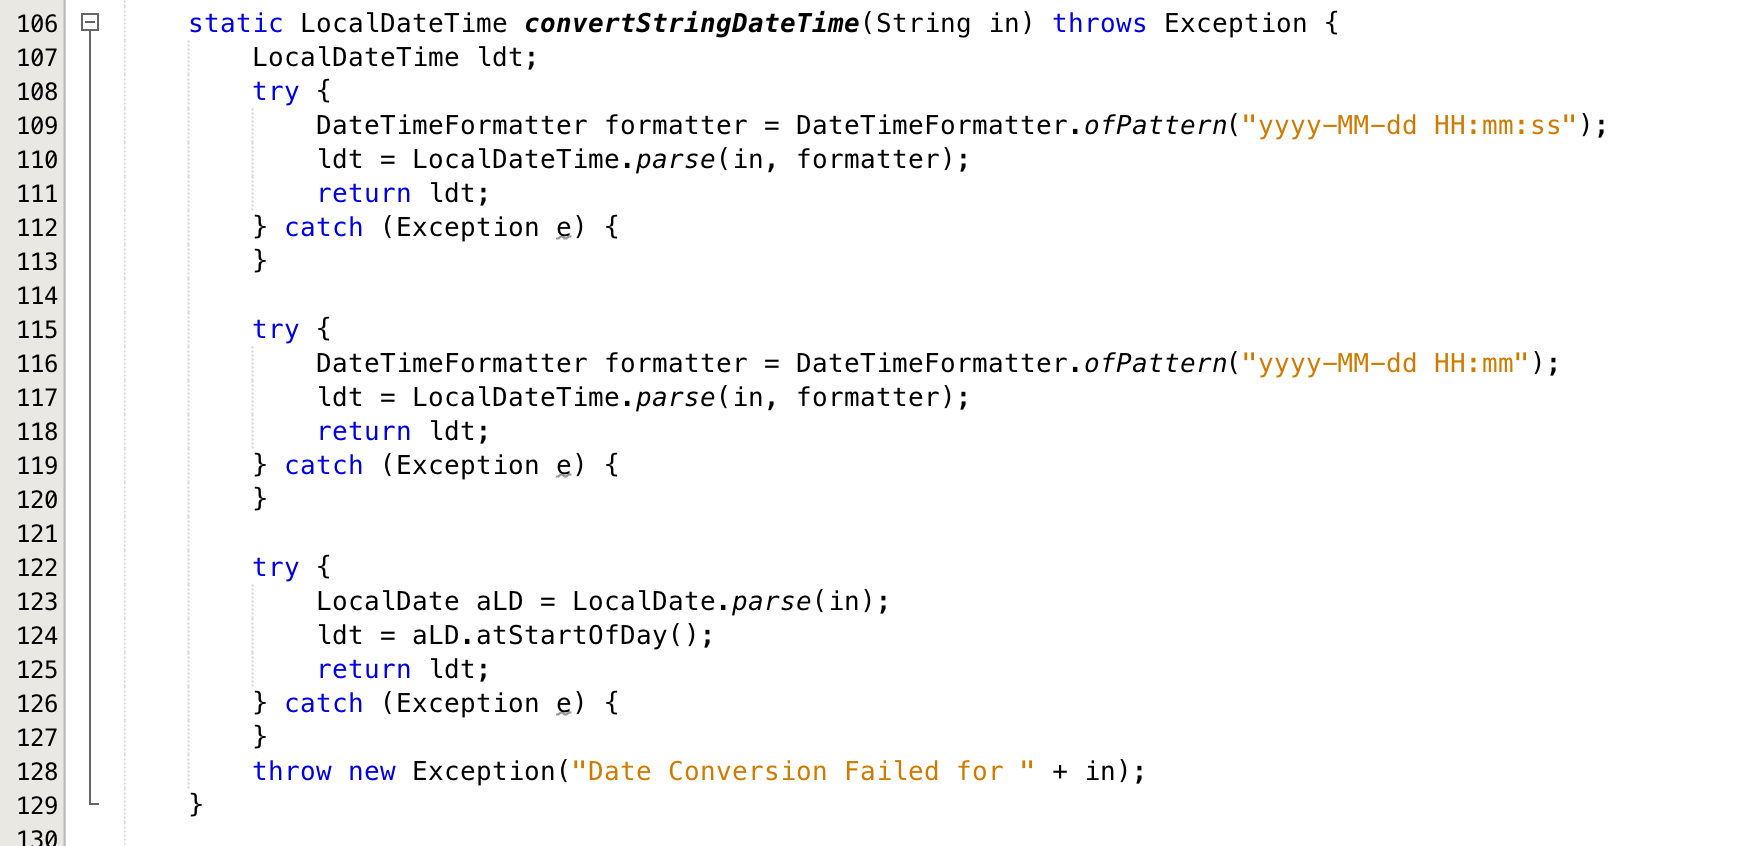
The next block of code takes the command line argument and trys to turn it into a date/time. To do this I use the DateTimeFormatter class. Basically I try three different date/time formats to see if I can find one that works. If there is nothing that works I throw an Exception.
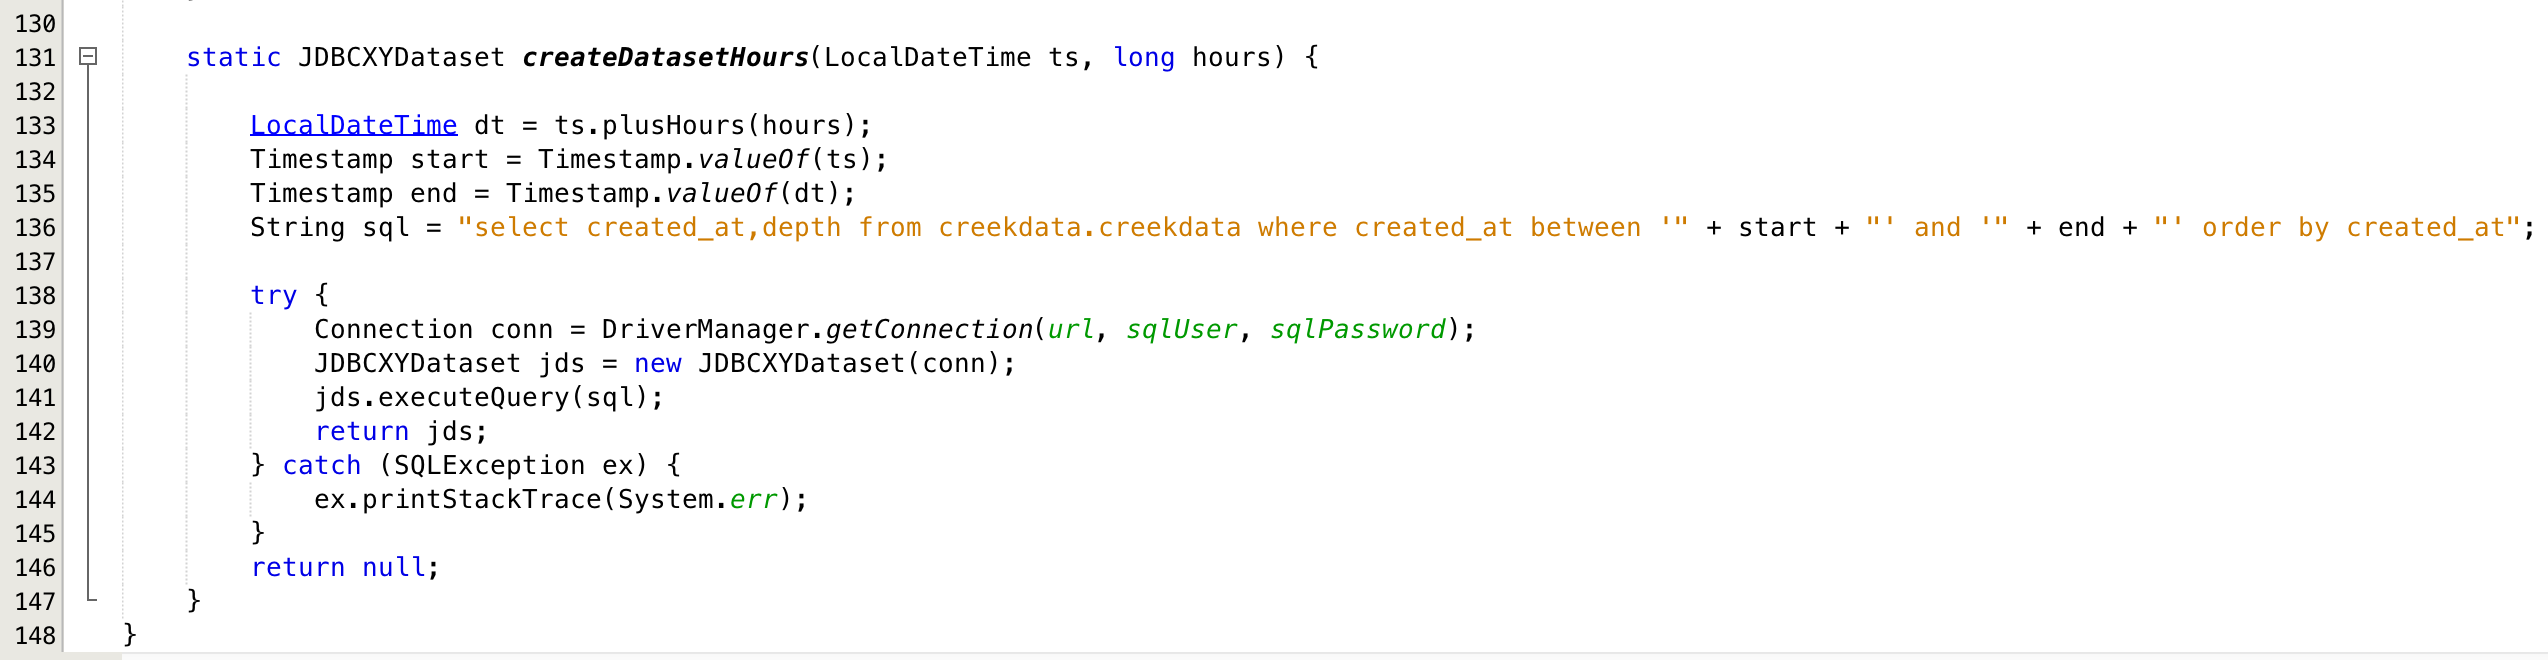
Read in x-y data from the MySql Database
This function sets up the SQL statement to read the data into a JDBCXYDataset class (from jfree.org) . The JDBCDataset class can be passed to the charting program to create the plot of the data. The function is pretty simple, it just takes the input date/time and number of hours. Then creates an end date/time and embeds that information into the SQL statement. Finally it runs the MySql query and returns the data.
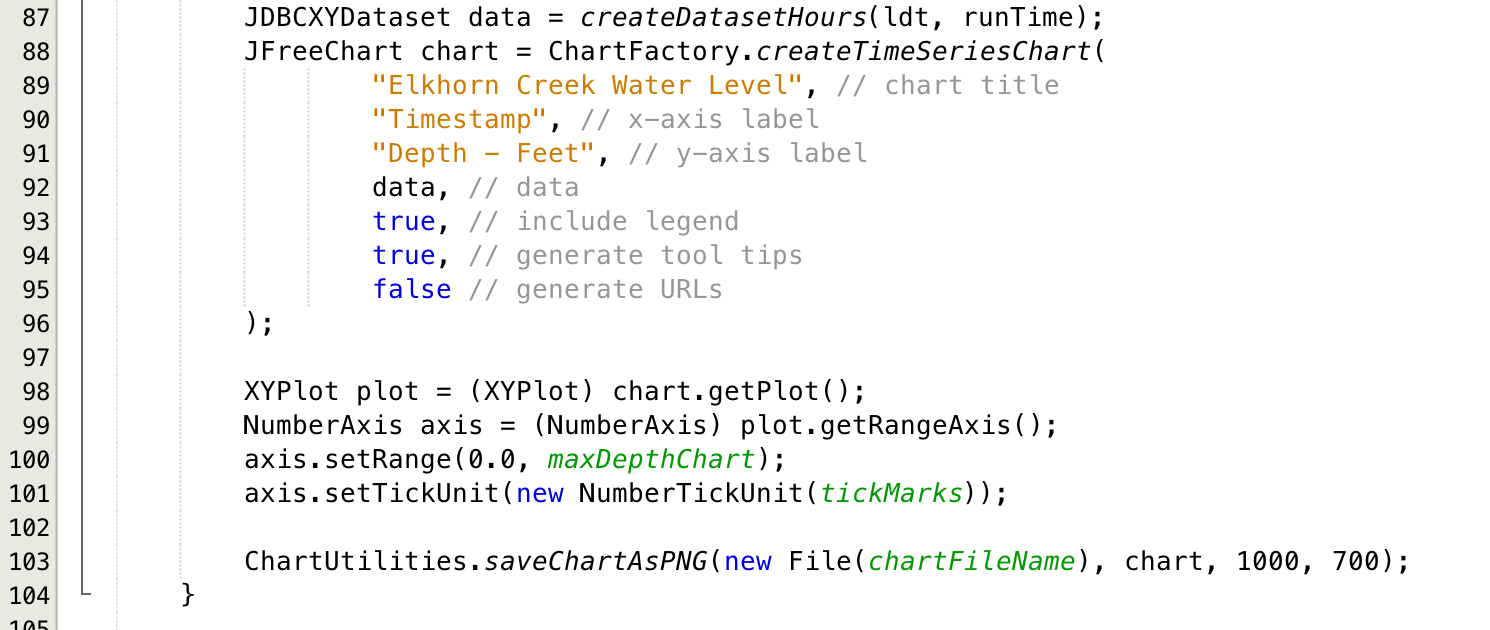
Create the chart
The last step is to call the JFreeChart class to build the chart which is done on line 88-96. Once the chart is created, I setup the axis to have a range of 0.0 –> maxDepthChart (If the water is 23 feet deep then my floor is just getting covered ) (lines 98-101). And finally create the PNG file (line 103).
Index
Description
The Creek: IOT for the Elkhorn Creek
Introduction
The Creek: Solution Architecture 1.0
Overall architecture
The Creek: Creek Board 1.1
Eagle layout of the board
The Creek: Creek Board 1.0 – RCCA
A discussion of the errors in the 1.0 board
The Creek: CYPI, a Raspberry Pi to Arduino Bridge
PSoC4 <--> Raspberry Pi Bridge Board
The Creek: PSoC4 Creator Schematic and Firmware
Firmware to interface with the temperature and pressure sensors
The Creek: Testing the Firmware
Using tools to verify that the PSoC 4 Firmware is working correctly
The Creek: Testing the Bootloader
Make sure that you can load new firmware into the PSoC
The Creek: Software Architecture
All of the Raspberry Pi software connections
The Creek: Install MySql
Instruction to configure MySql
The Creek: Install Tomcat
Instruction to configure Tomcat JSP Server
The Creek: Data Collection Java (Part 1)
The Java program that reads the I2C and saves it in the database
The Creek: Data Collection Java (Part 2)
The Java program that reads the I2C and saves it in the database
The Creek: Create the Chart with JFreeChart
Using open source Java charting software to create plots of the Creek Depth
The Creek: Flood Event Data Processor
A batch program to create analyze the database and create a table of flood events
The Creek: Flood Event Web Page
A batch program to create the flood event web page
The Creek: Creek Server 1.1
Updates to all of the back off server programs to integrate charts
The Creek: JSP Web Page for www.elkhorn-creek.org
The JSP program to make the table and display the website
The Creek: Raspberry Pi Clock Stretching
Sorting out a bug in the system having to do with the Broadcomm Raspberry Pi Master not functioning well with clock stretching
The Creek: Creek Server 1.2
Caching the web pages to make them faster
No comment yet, add your voice below!