FreeRTOS PSoC Template Project

Summary

In the last article I showed you clever FreeRTOS PSoC Component… and the talked about some of the issues that I had with it.  In this article I will talk about a self-contained FreeRTOS PSoC Template project that includes everything for FreeRTOS and Tracealyzer all in one project.  My idea was that when I start a new project I will just make a copy of the template project, rename it, then move on.

My FreeRTOS PSoC Template has

  • FreeRTOS with the files in in the same directory (i.e. not referenced externally)
  • Tracealyzer with the files in the same directory & all of the streamports including RTT and the UART DMA
  • All of the files organized into PSoC Creator folders
  • A template main.c
  • All of the build settings configured

This project is checked into GitHub and you can find it git@github.com:iotexpert/PSoC-FreeRTOS-Template.git

Building the FreeRTOS PSoC Template

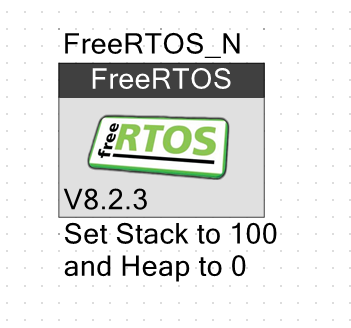
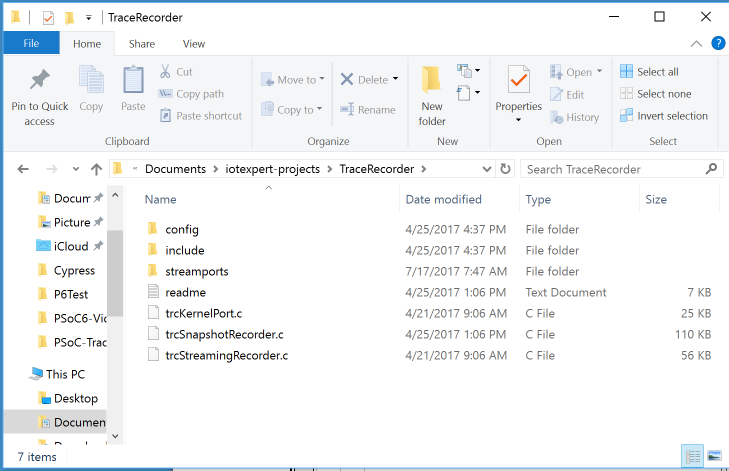
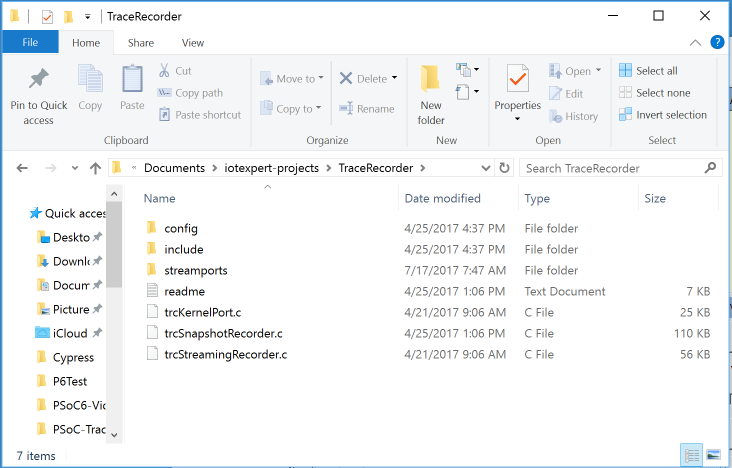
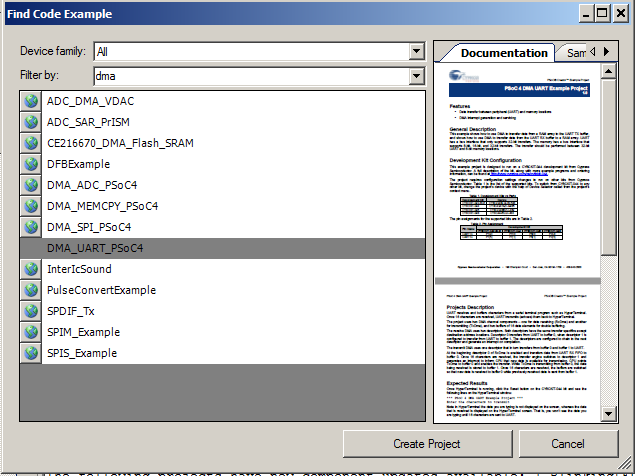
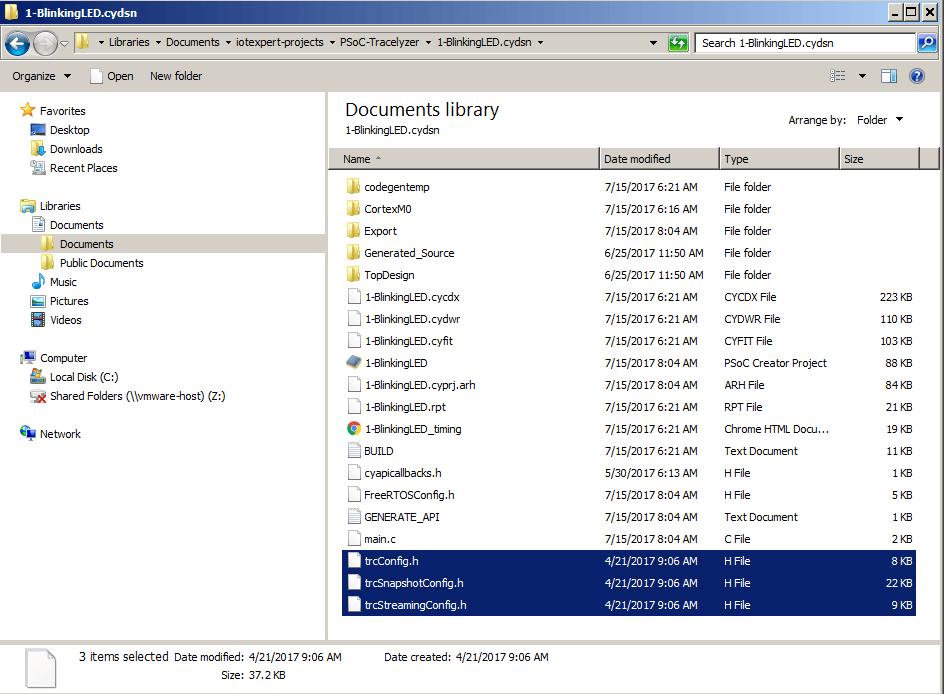
I started the process by creating a blank PSoC project called “FreeRTOS_Template”.  I then went into the Windows Explorer and copied the entire FreeRTOS source directory into the FreeRTOS PSoC Template Project directory.  Then I copied the Percepio TraceRecorder library into the FreeRTOS PSoC Template project.

FreeRTOS PSoC Template Directory Structure

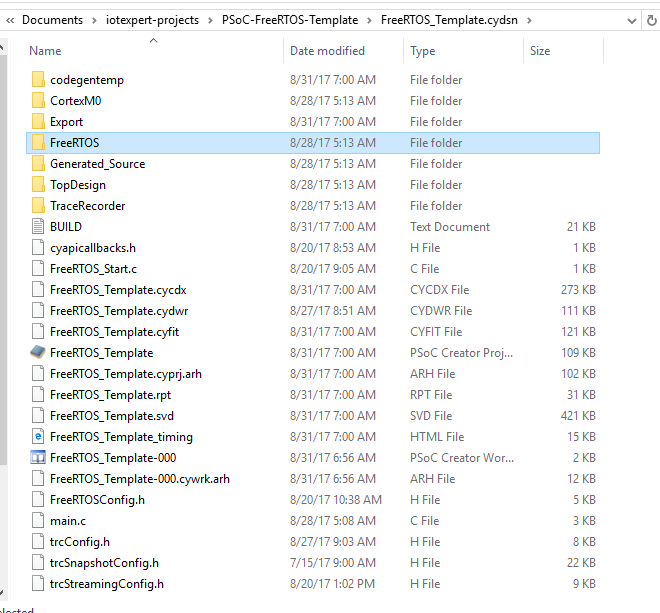
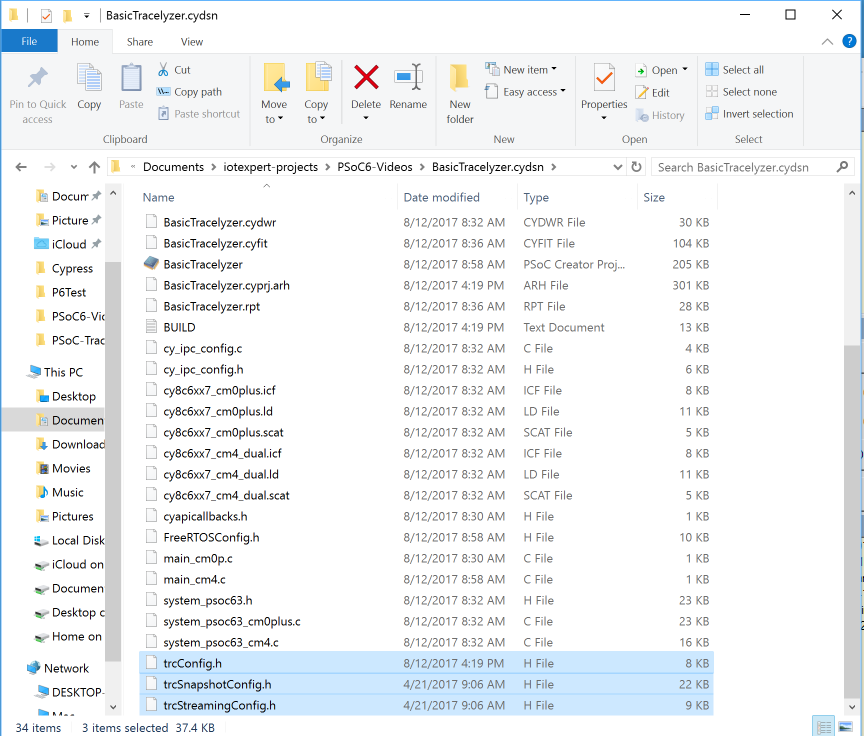
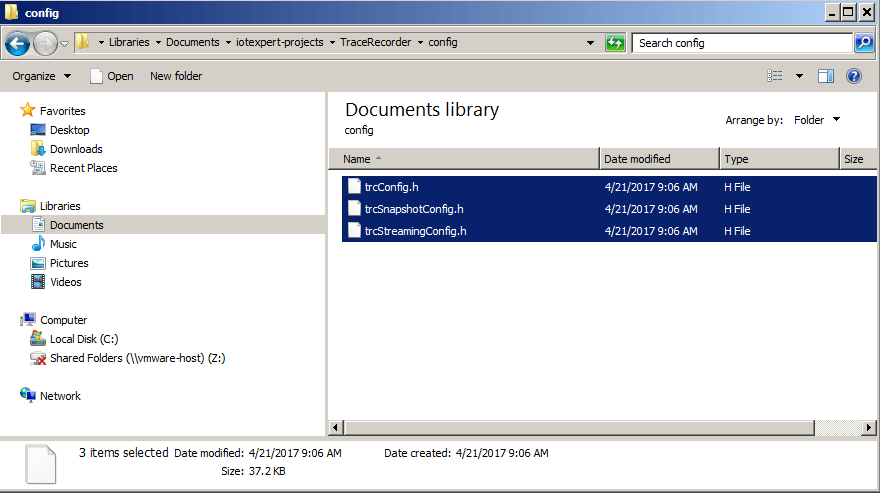
By having both of the source directories in my project it isolated this project from changes in the FreeRTOS or the TraceRecorder.  Obviously that is a double edged sword.  The next thing that I did was use the Windows Explorer to copy FreeRTOSConfig.h, trcConfig.h, trcSnapshotConfig.h and trcStreamingConfig.h into the project.   Once all of the files were in my project directory is was time to fix up the PSoC Creator Project.

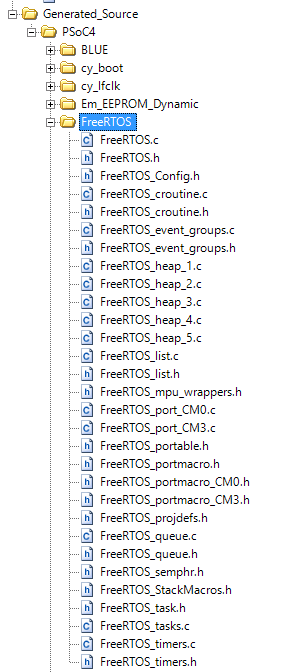
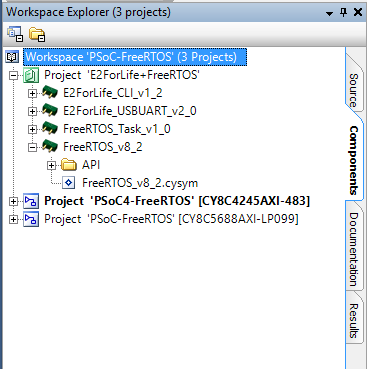
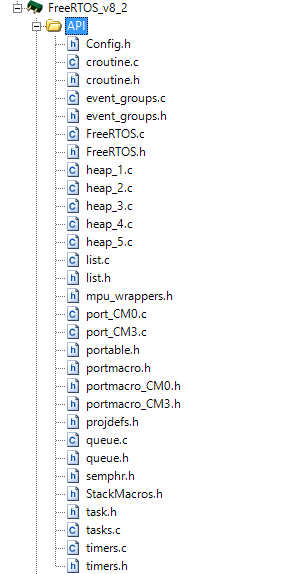
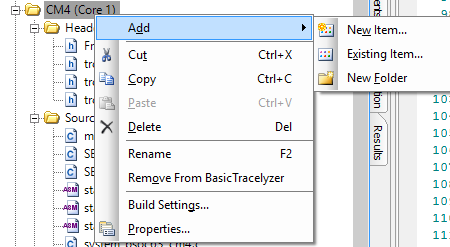
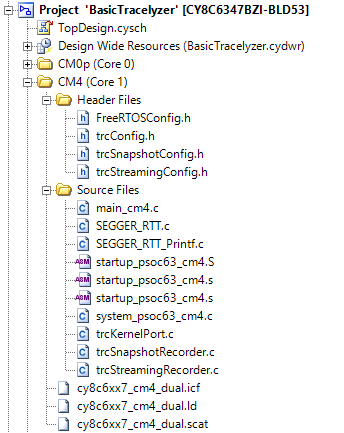
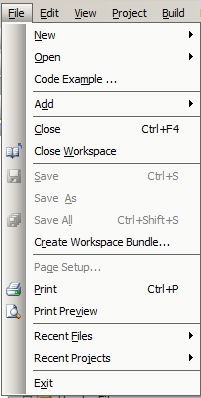
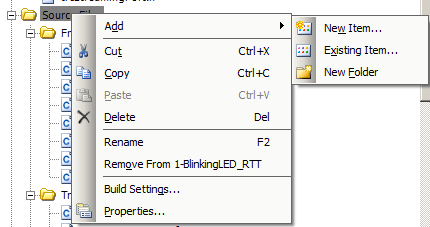
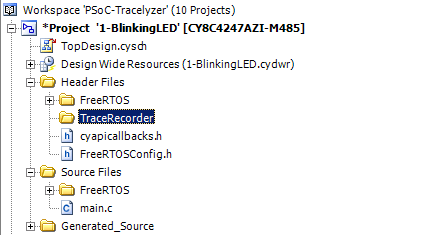
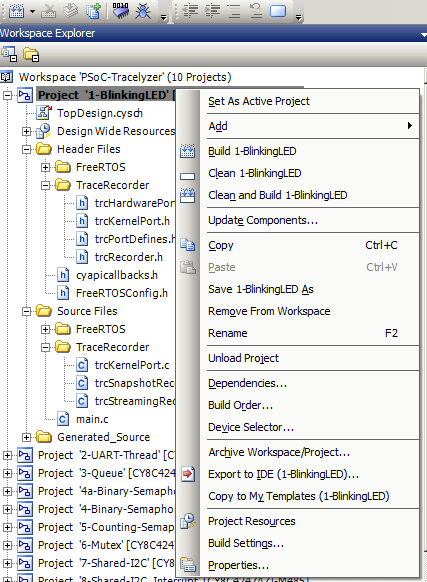
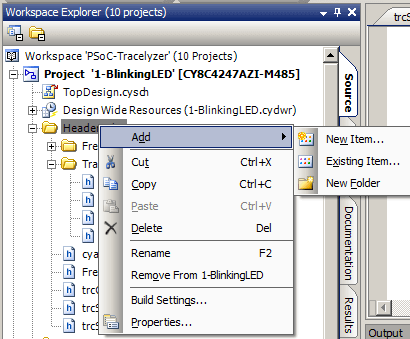
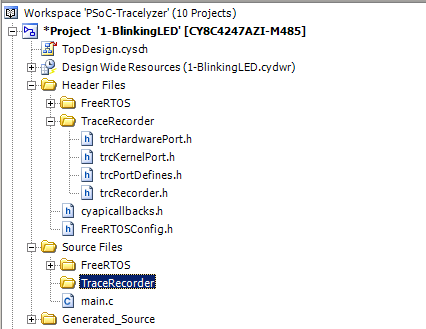
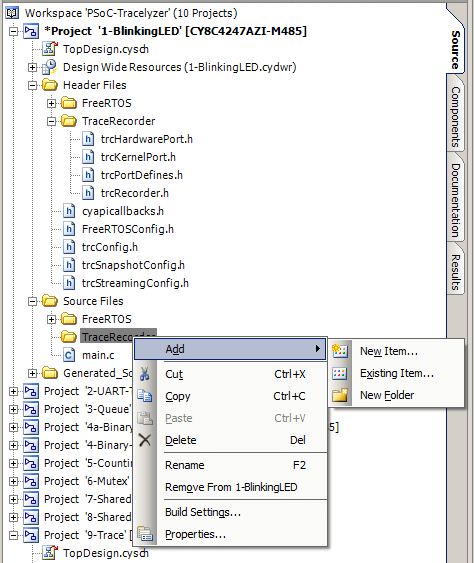
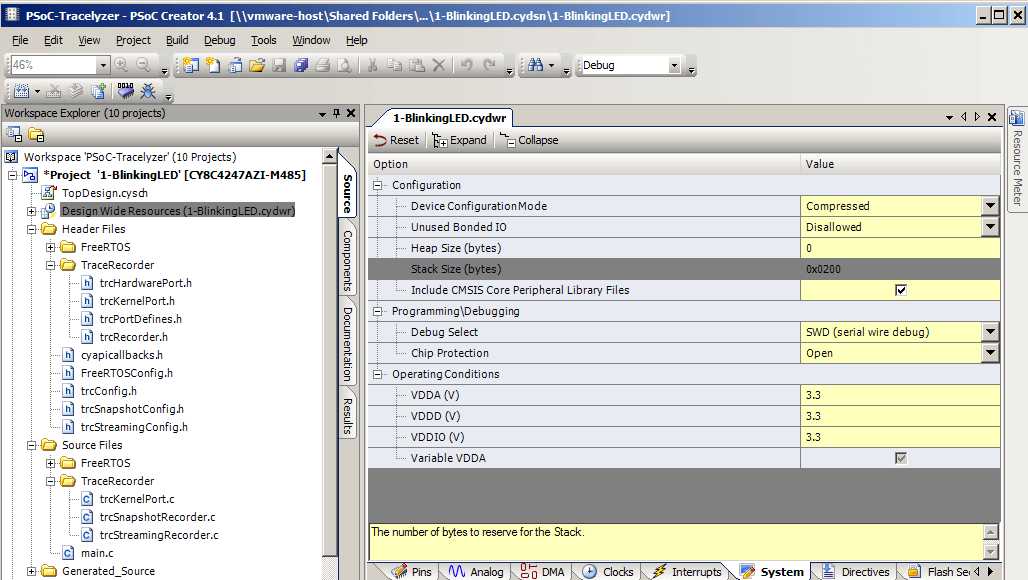
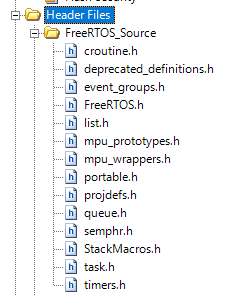
To do this I created a folder called “FreeRTOS_Source” in the “Header Files” and “Source Files” folders in my template project.  You can do this by right clicking and selecting “Add->New Folder”.  Then I added all of the appropriate .h and .c files from FreeRTOS source directory.  This gives me the following project view:

FreeRTOS PSoC Template PSoC Creator Header Files

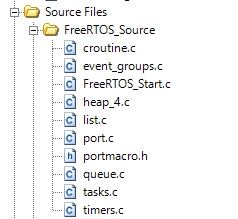
And Source Files (notice that I also added heap_4.c which I generally use for memory management)

FreeRTOS PSoC Template PSoC Creator Source Files

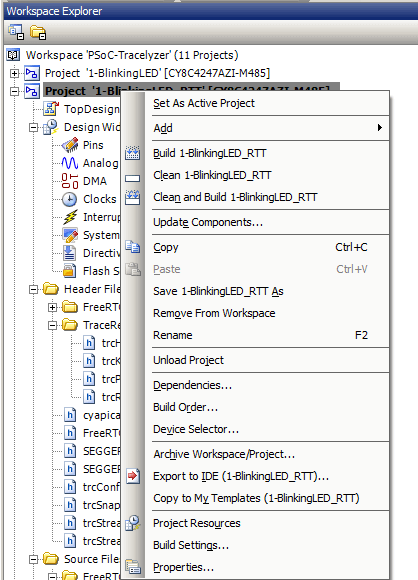
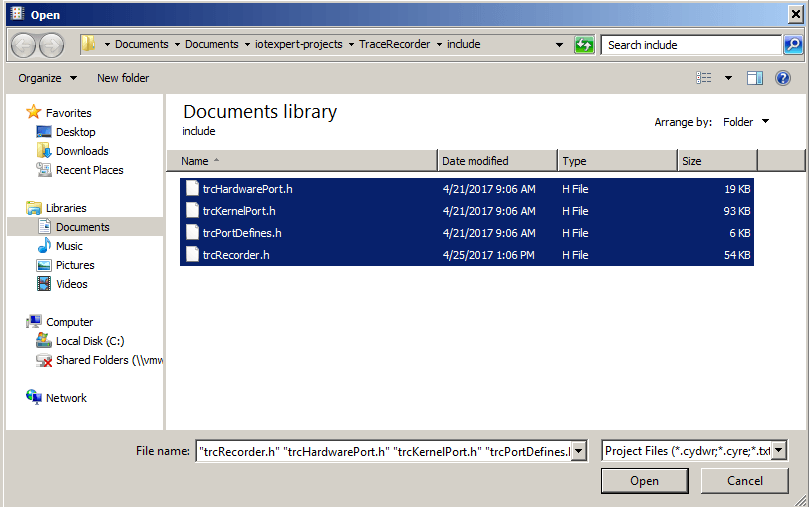
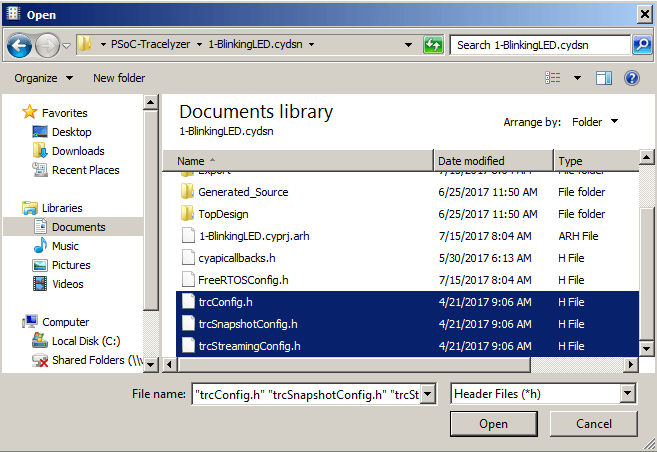
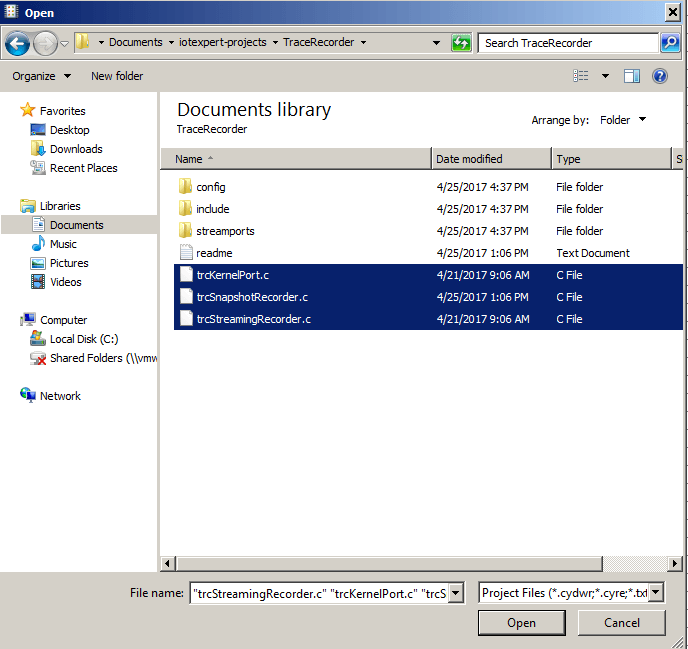
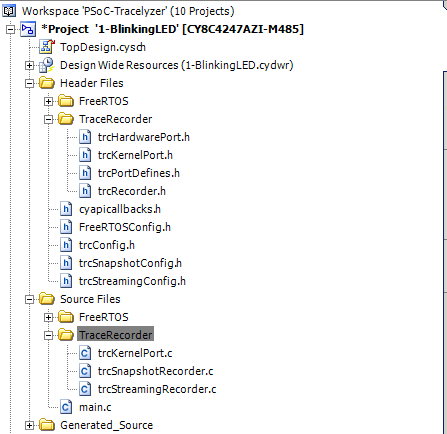
Then I add the configuration files FreeRTOSConfig.h, trcConfig.h, trcSnapshotConfig.h, trcStreamingConfig.h and trcStreamingport.h.  Next I do the same thing for the TraceRecorder library which makes my project look like this:

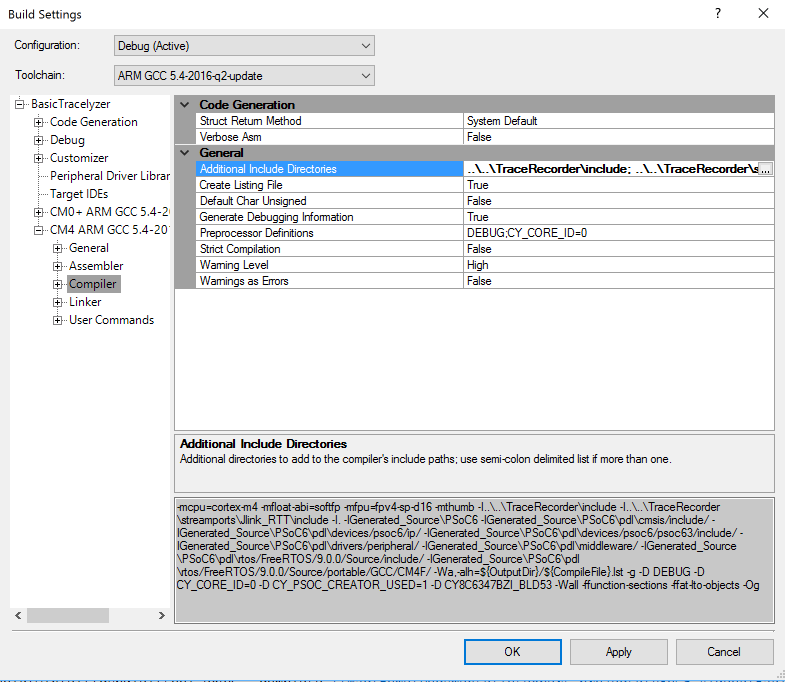
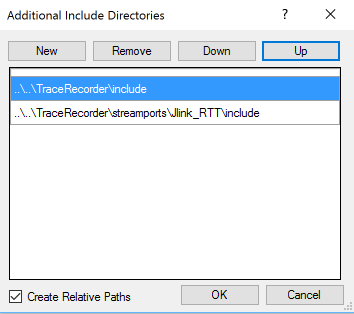
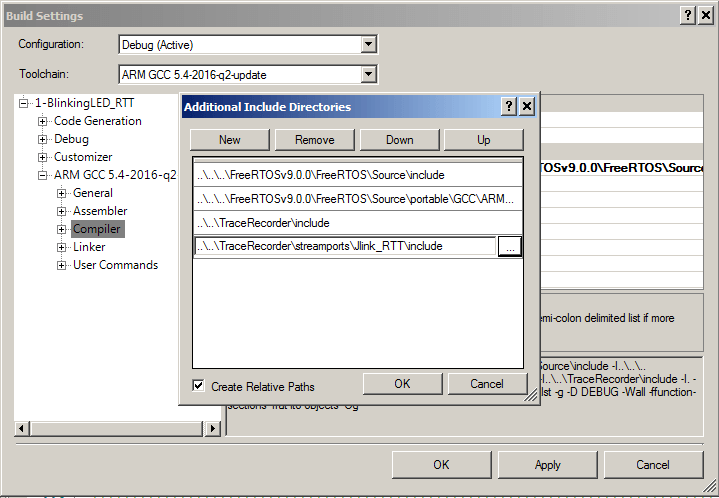
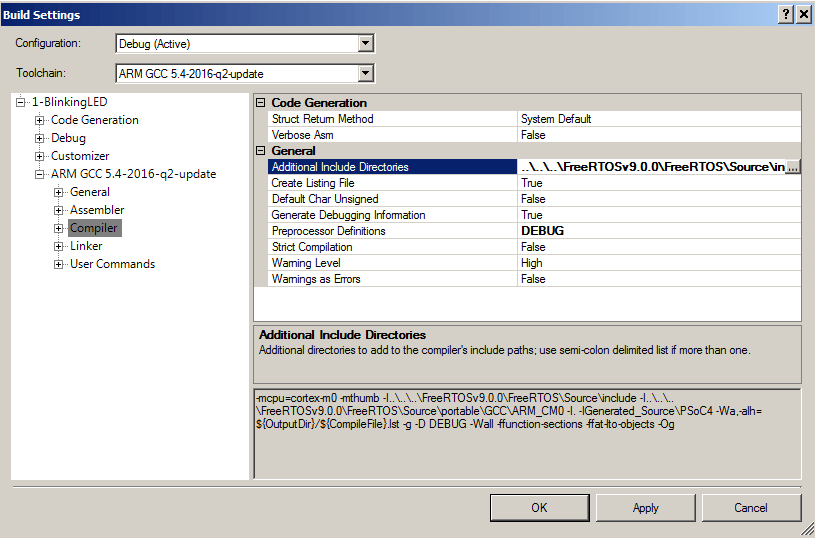
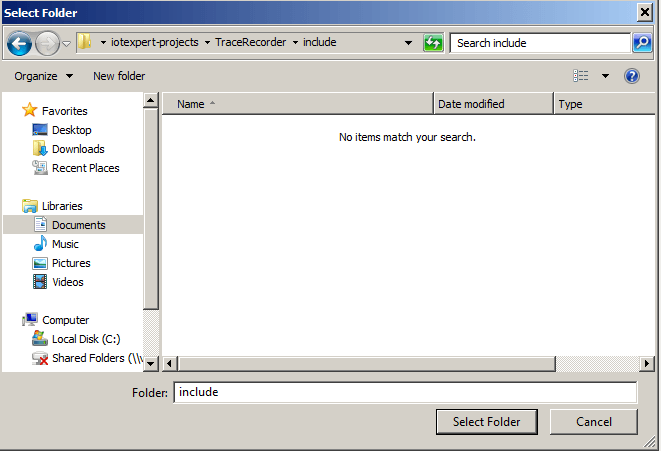
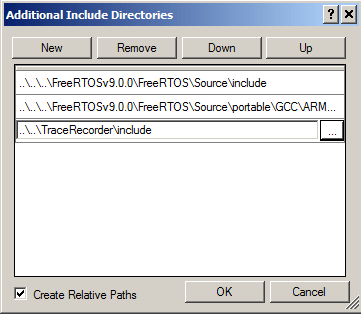
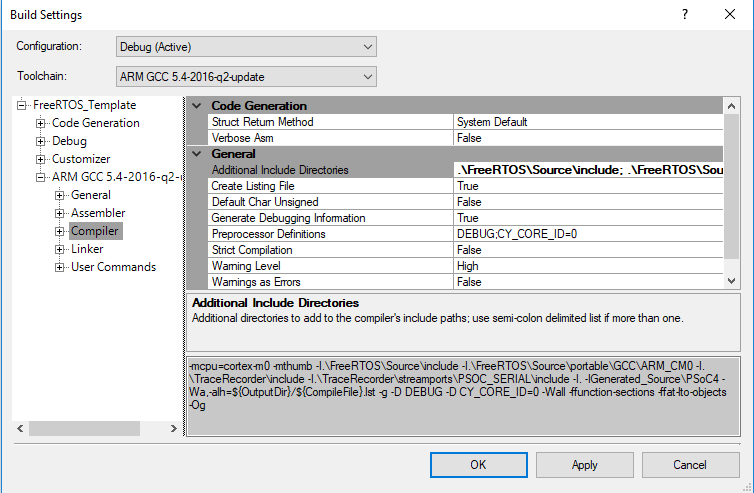
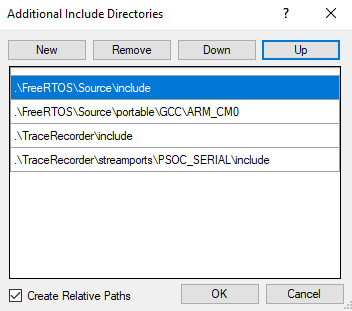
Then I modify the build settings to add the include directories:

FreeRTOS PSoC Template Build Settings

FreeRTOS PSoC Template PSoC Creator Include Path

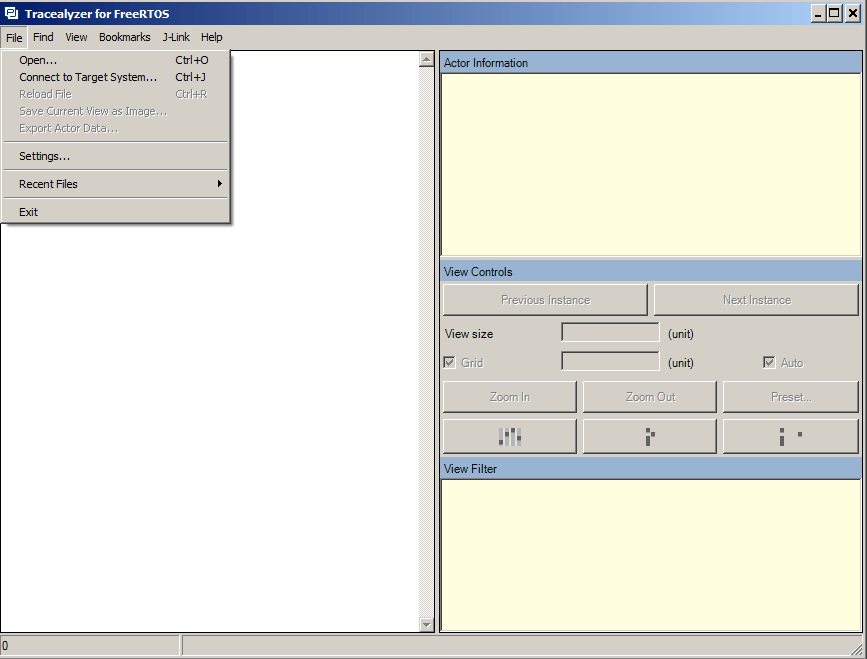
Now you can modify the FreeRTOSConfig.h to include all of the Tracealyzer stuff:

/* A header file that defines trace macro can be included here. */
#if ( configUSE_TRACE_FACILITY == 1 )
#include "trcRecorder.h"
#endif

#endif /* FREERTOS_CONFIG_H */

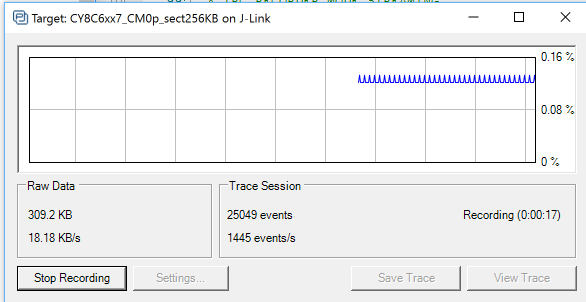
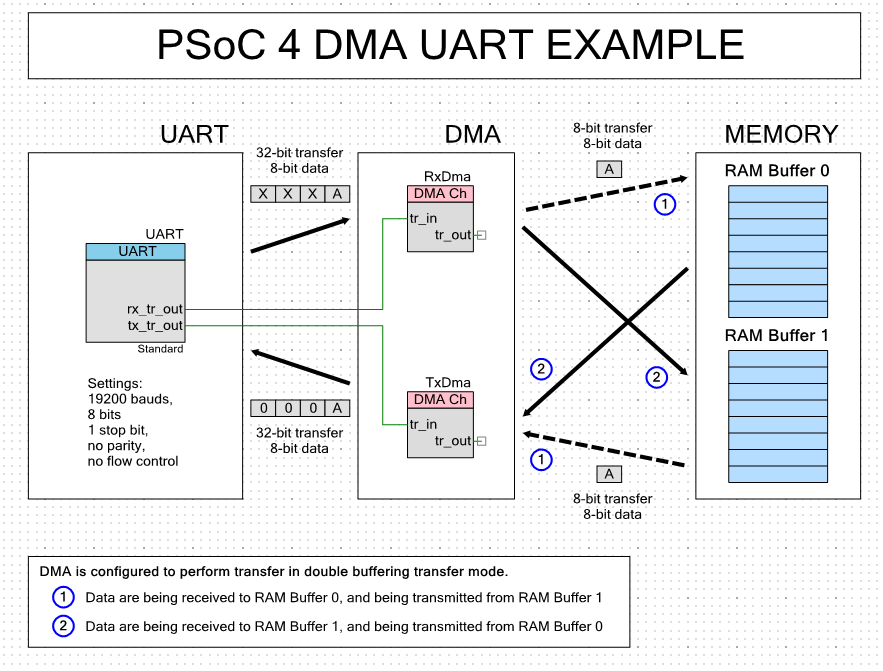
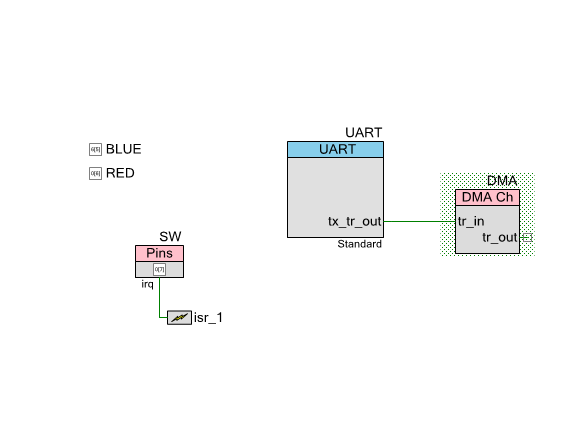
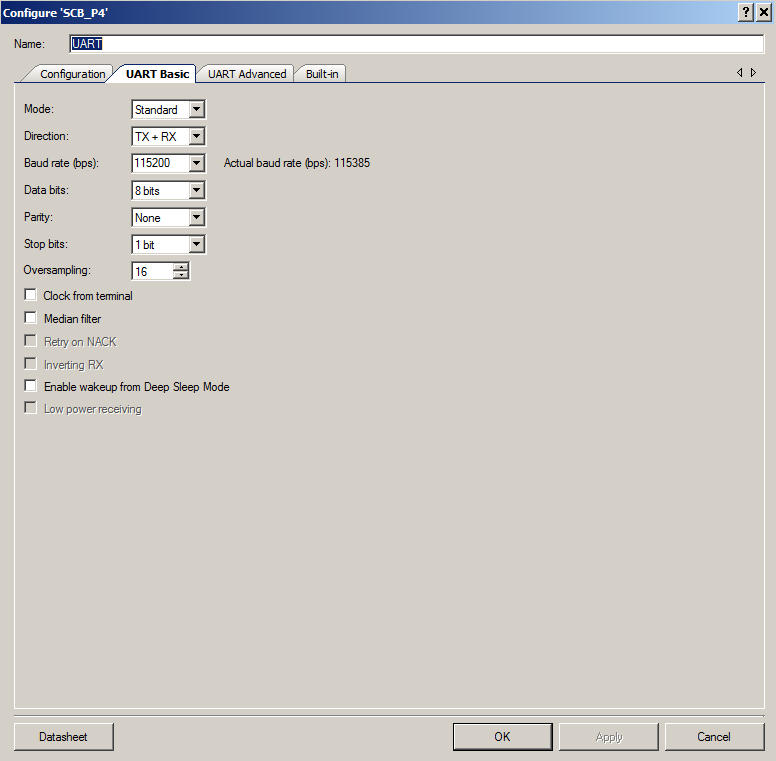
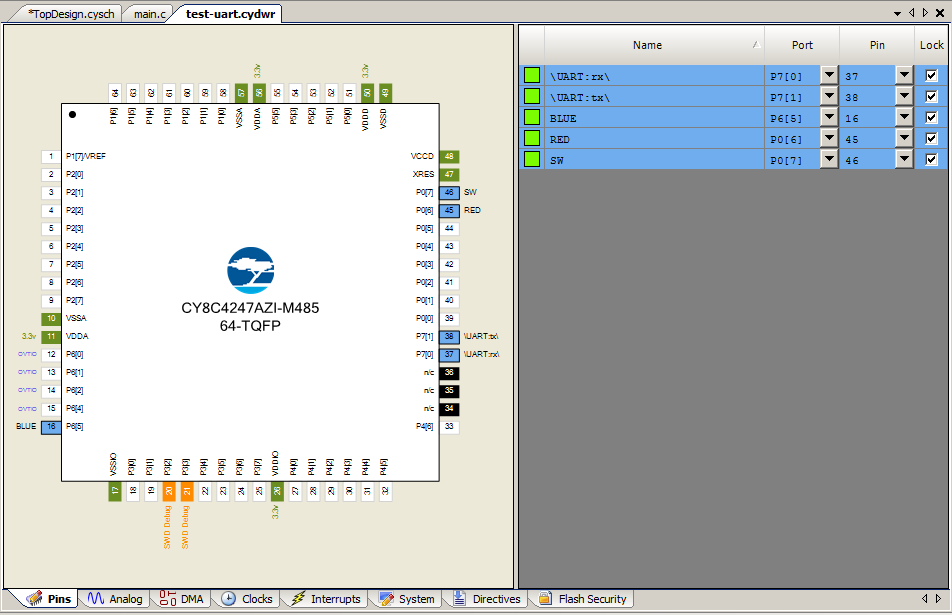
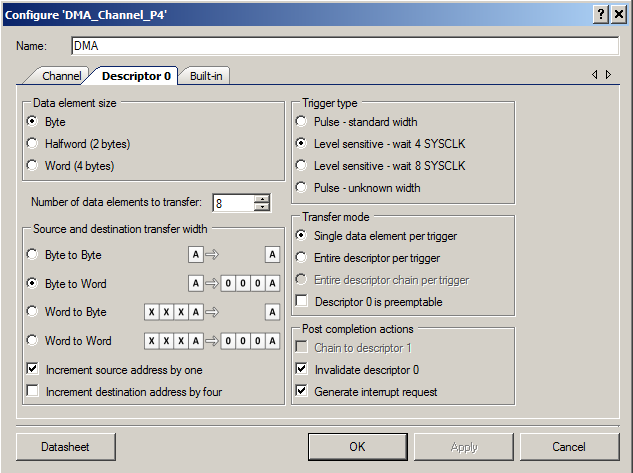
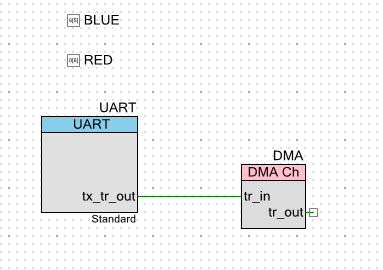
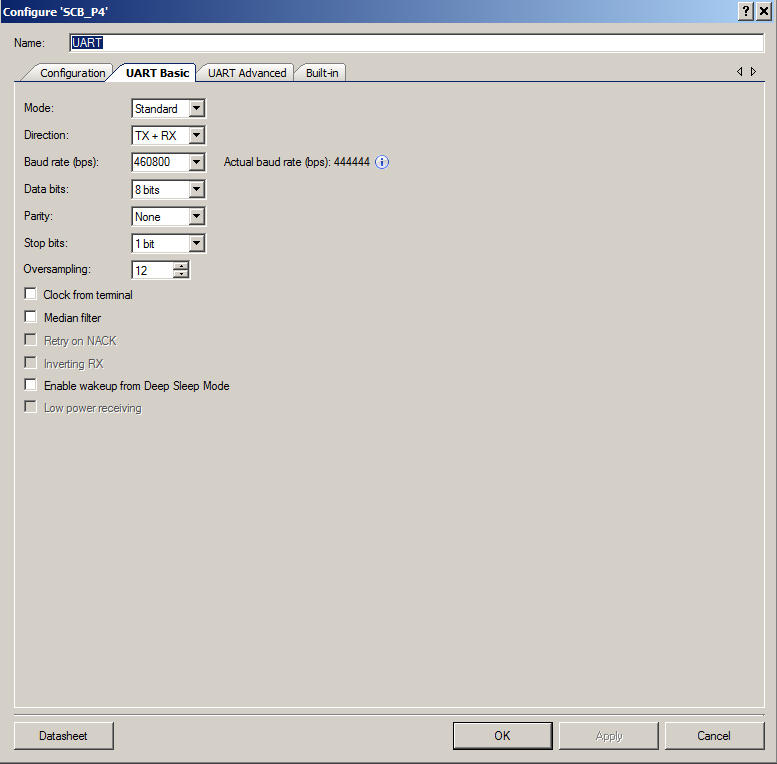
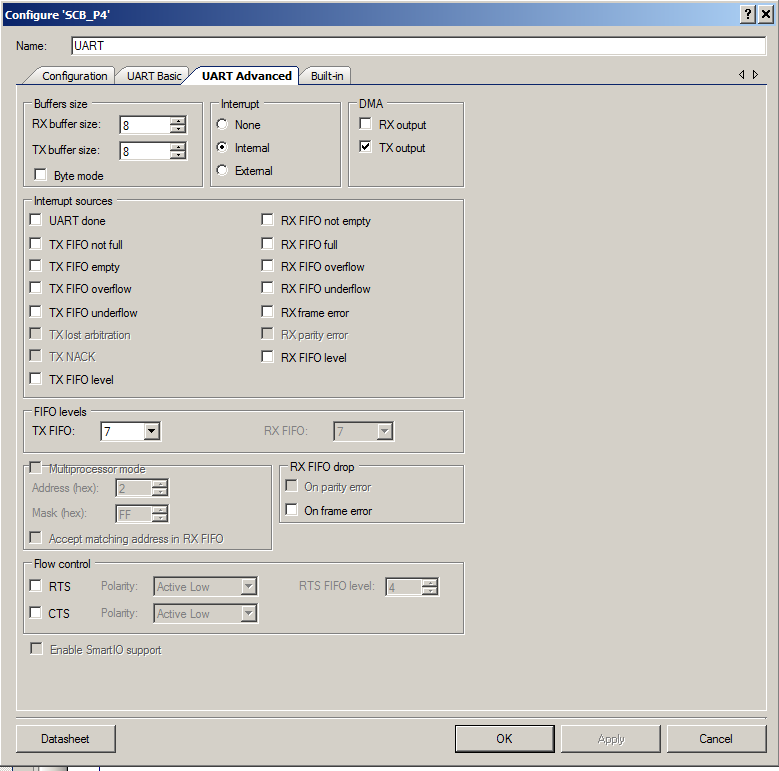
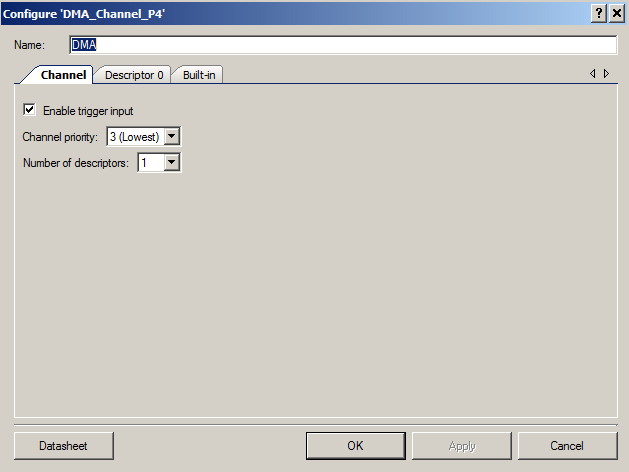
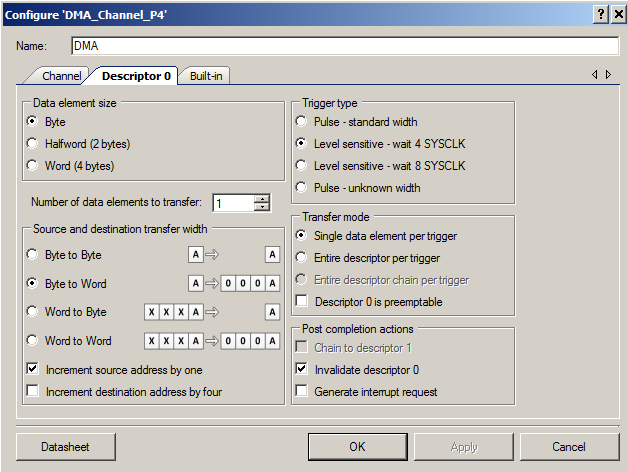
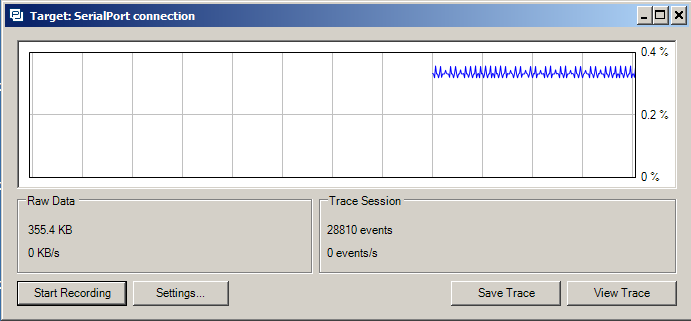
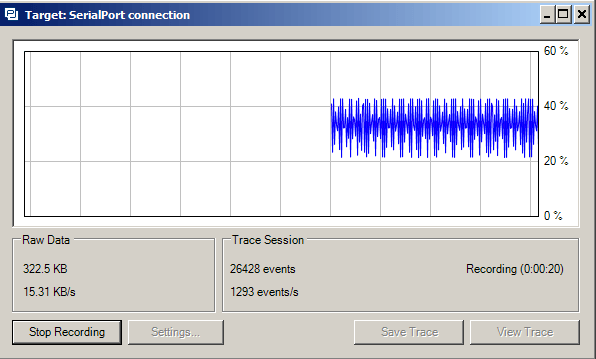
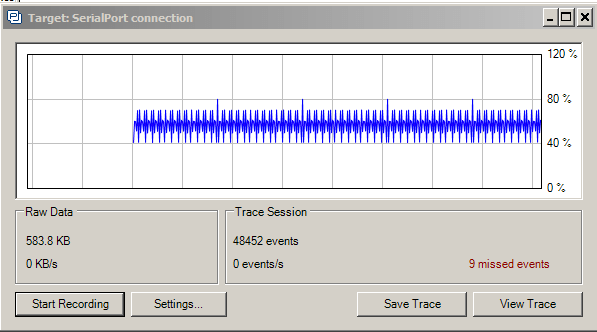
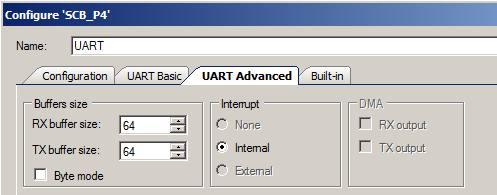
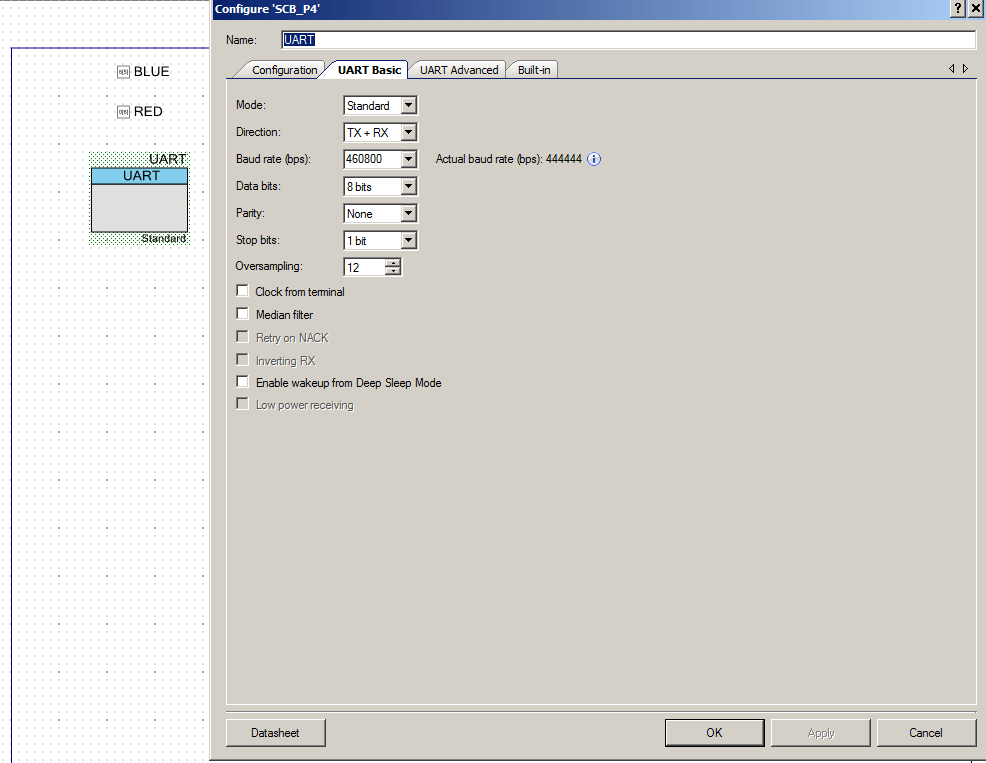
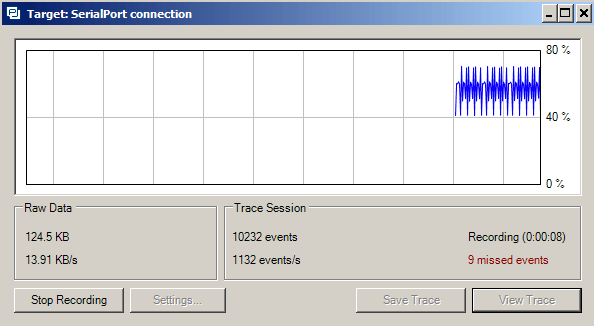
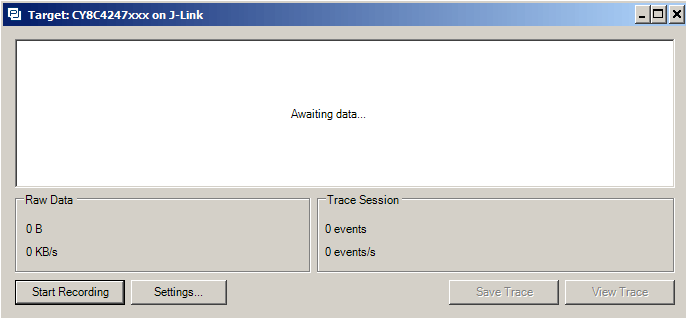
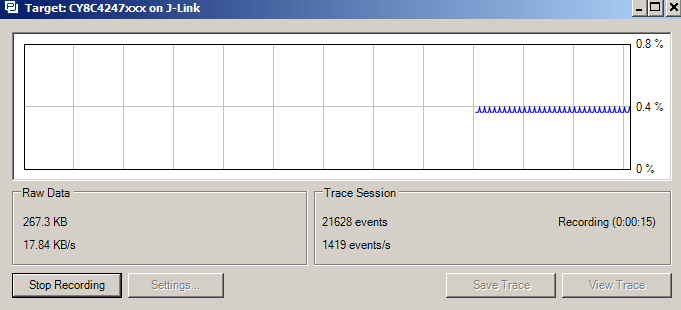
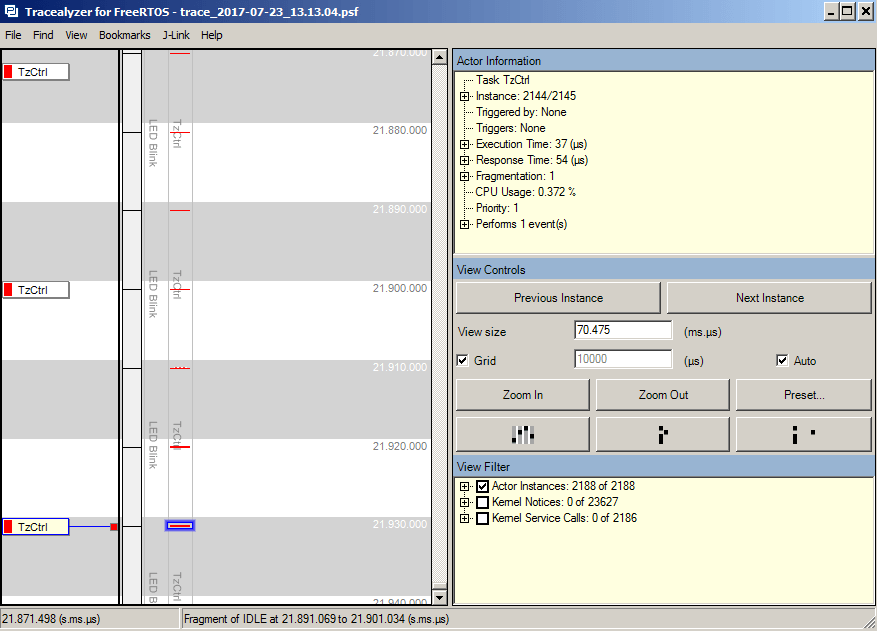
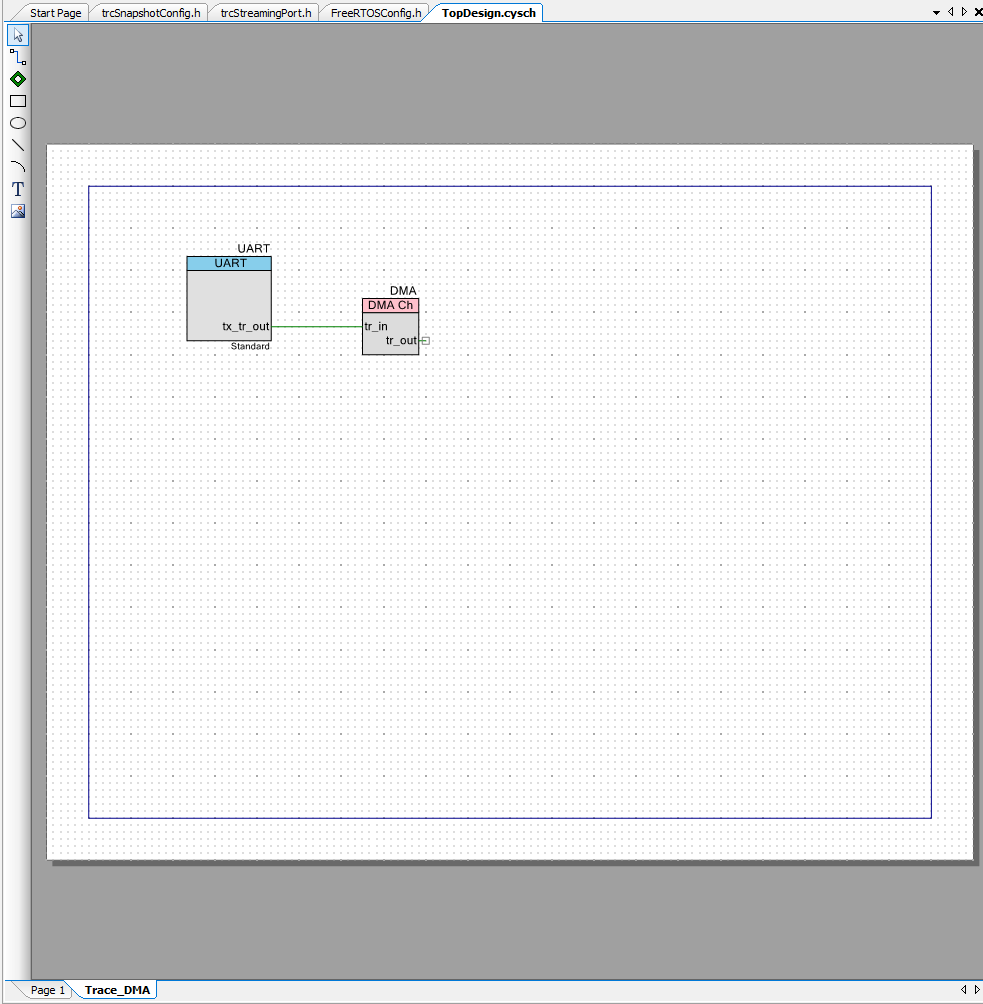
Then I setup a new tab in the schematic to contain the DMA UART Streamport.  You can read all about the UART DMA Streamport in this article.

FreeRTOS PSoC Template PSoC Creator Streamport Schematic

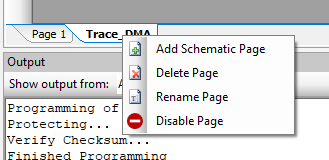
By putting that part of the stream port on a separate schematic page I can now do a right click and disable the page when I am not using the Tracealyzer streamport.  Disabling a page of the schematic completely removes everything from the build.

PSoC Creator Schematic Disable Settings

Next I create files called FreeRTOS_Start.h/.c to put in the startup code:

#include <project.h>
#include "FreeRTOS.h"

extern void xPortPendSVHandler(void);
extern void xPortSysTickHandler(void);
extern void vPortSVCHandler(void);

#define CORTEX_INTERRUPT_BASE          (16)
void FreeRTOS_Start()
{
    /* Handler for Cortex Supervisor Call (SVC, formerly SWI) - address 11 */
    CyIntSetSysVector( CORTEX_INTERRUPT_BASE + SVCall_IRQn,
        (cyisraddress)vPortSVCHandler );
    
    /* Handler for Cortex PendSV Call - address 14 */
	CyIntSetSysVector( CORTEX_INTERRUPT_BASE + PendSV_IRQn,
        (cyisraddress)xPortPendSVHandler );    
    
    /* Handler for Cortex SYSTICK - address 15 */
	CyIntSetSysVector( CORTEX_INTERRUPT_BASE + SysTick_IRQn,
        (cyisraddress)xPortSysTickHandler );
}

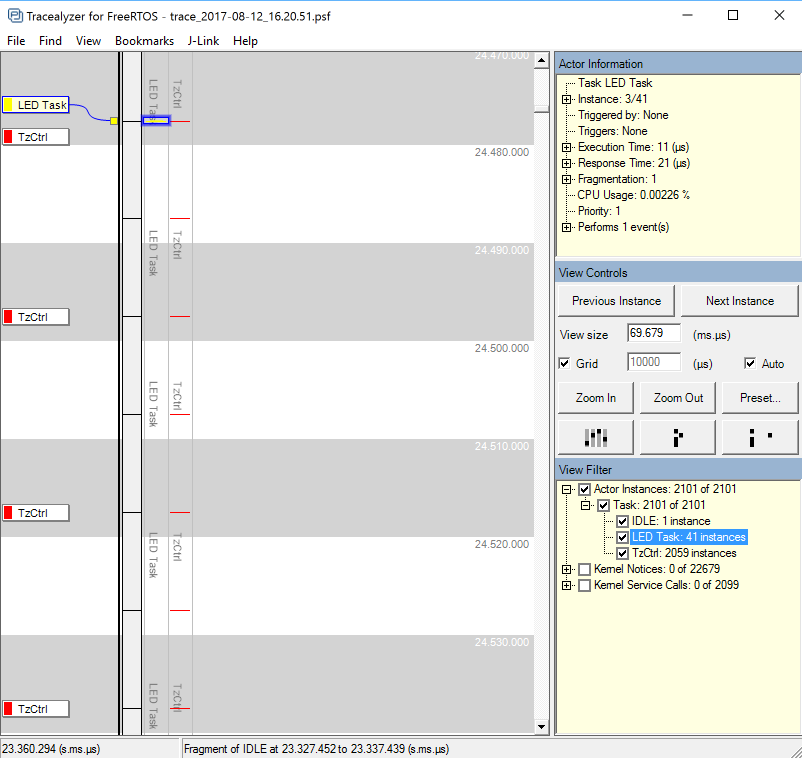
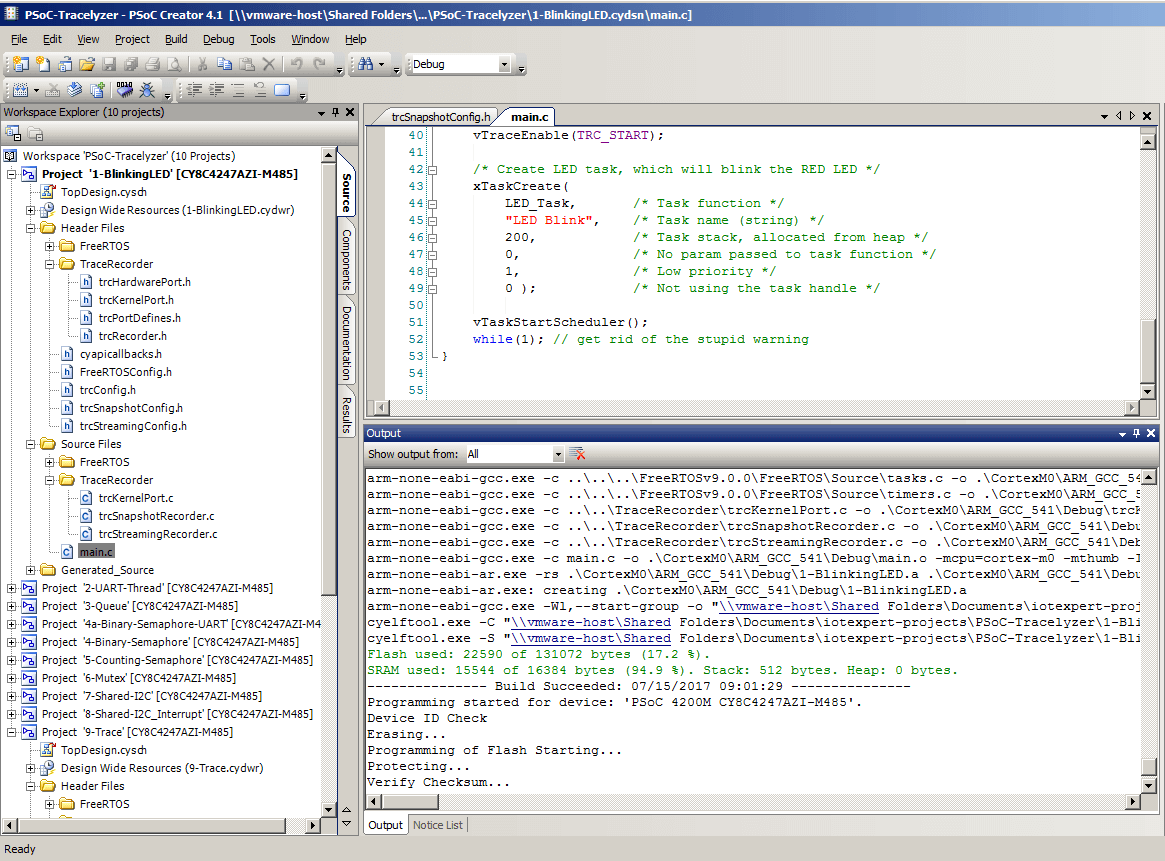
Finally I make a template main.c that starts everything and has a simple ledTask and instructions for changing Memory Management scheme and the TraceRecorder.

// This template has heap_4.c included in the project.  If you want a 
// different heap scheme then remove heap_4 from the project and add 
// the other scheme from FreeRTOS/Source/portable/memmag

// TraceRecorder
// There are methods
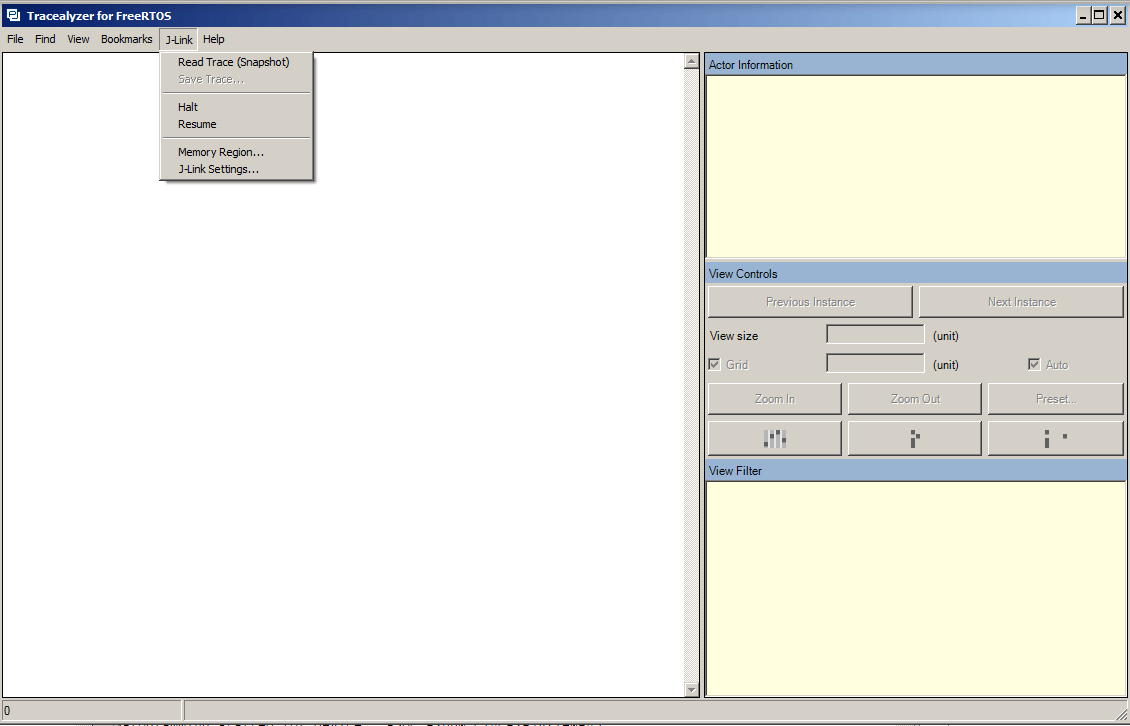
// 1. Snapshot mode
// 2. Streaming UART/DMA
// 3. Streaming JLINK RTT
//
// To use method 1: 
// - in FreeRTOSConfig.h make this line be 1 (currently line 45)
//#define configUSE_TRACE_FACILITY                1
// - in trcConfig.h configure the TRC_CFG_RECORDER 
// #define TRC_CFG_RECORDER_MODE TRC_RECORDER_MODE_SNAPSHOT
//
// To use method 2:
// - in FreeRTOSConfig.h make this line be 1 (currently line 45)
//#define configUSE_TRACE_FACILITY                1
// - in trcConfig.h configure the TRC_CFG_RECORDER
//#define TRC_CFG_RECORDER_MODE TRC_RECORDER_MODE_STREAMING
//
// This project currently has the PSoC UART Streaming Port
// add the TraceRecorder/streamports/PSoC_Serial/trcStreamingPort.c to the project
// add the TraceRecorder/streamports/PSoC_Serial/include/trcStreamingPort.h
// add the TraceRecorder/streamports/PSoC_Serial/include to the compiler include directories
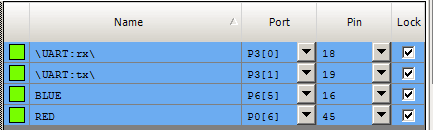
// Enable the Trace_DMA schematic sheet and make sure UART pins are assigned correctly
// This port depends on the UART being named UART and the DMA being named "DMA"
//
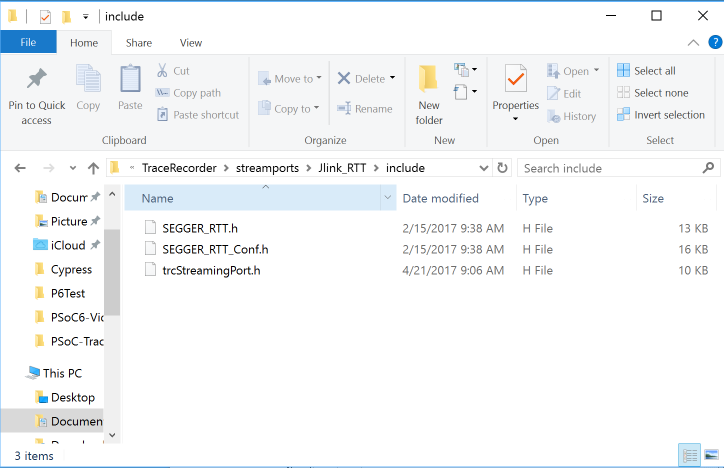
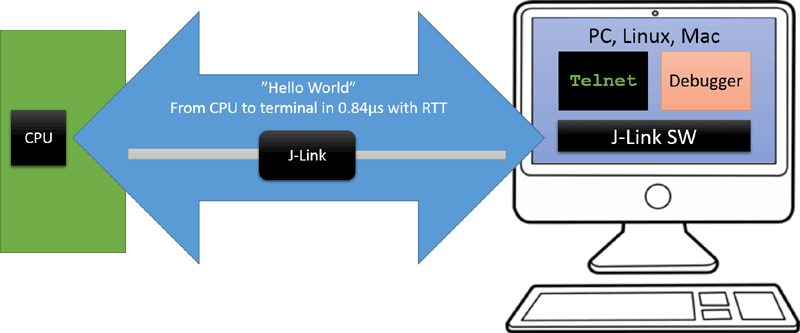
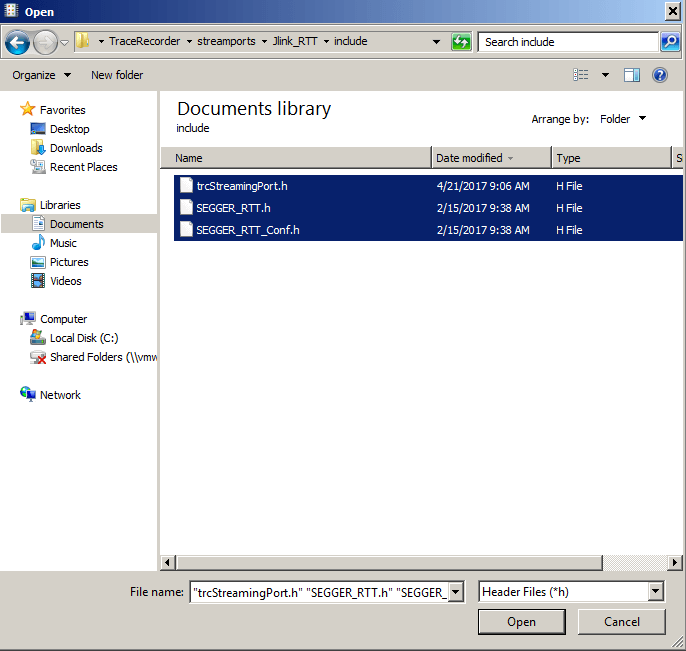
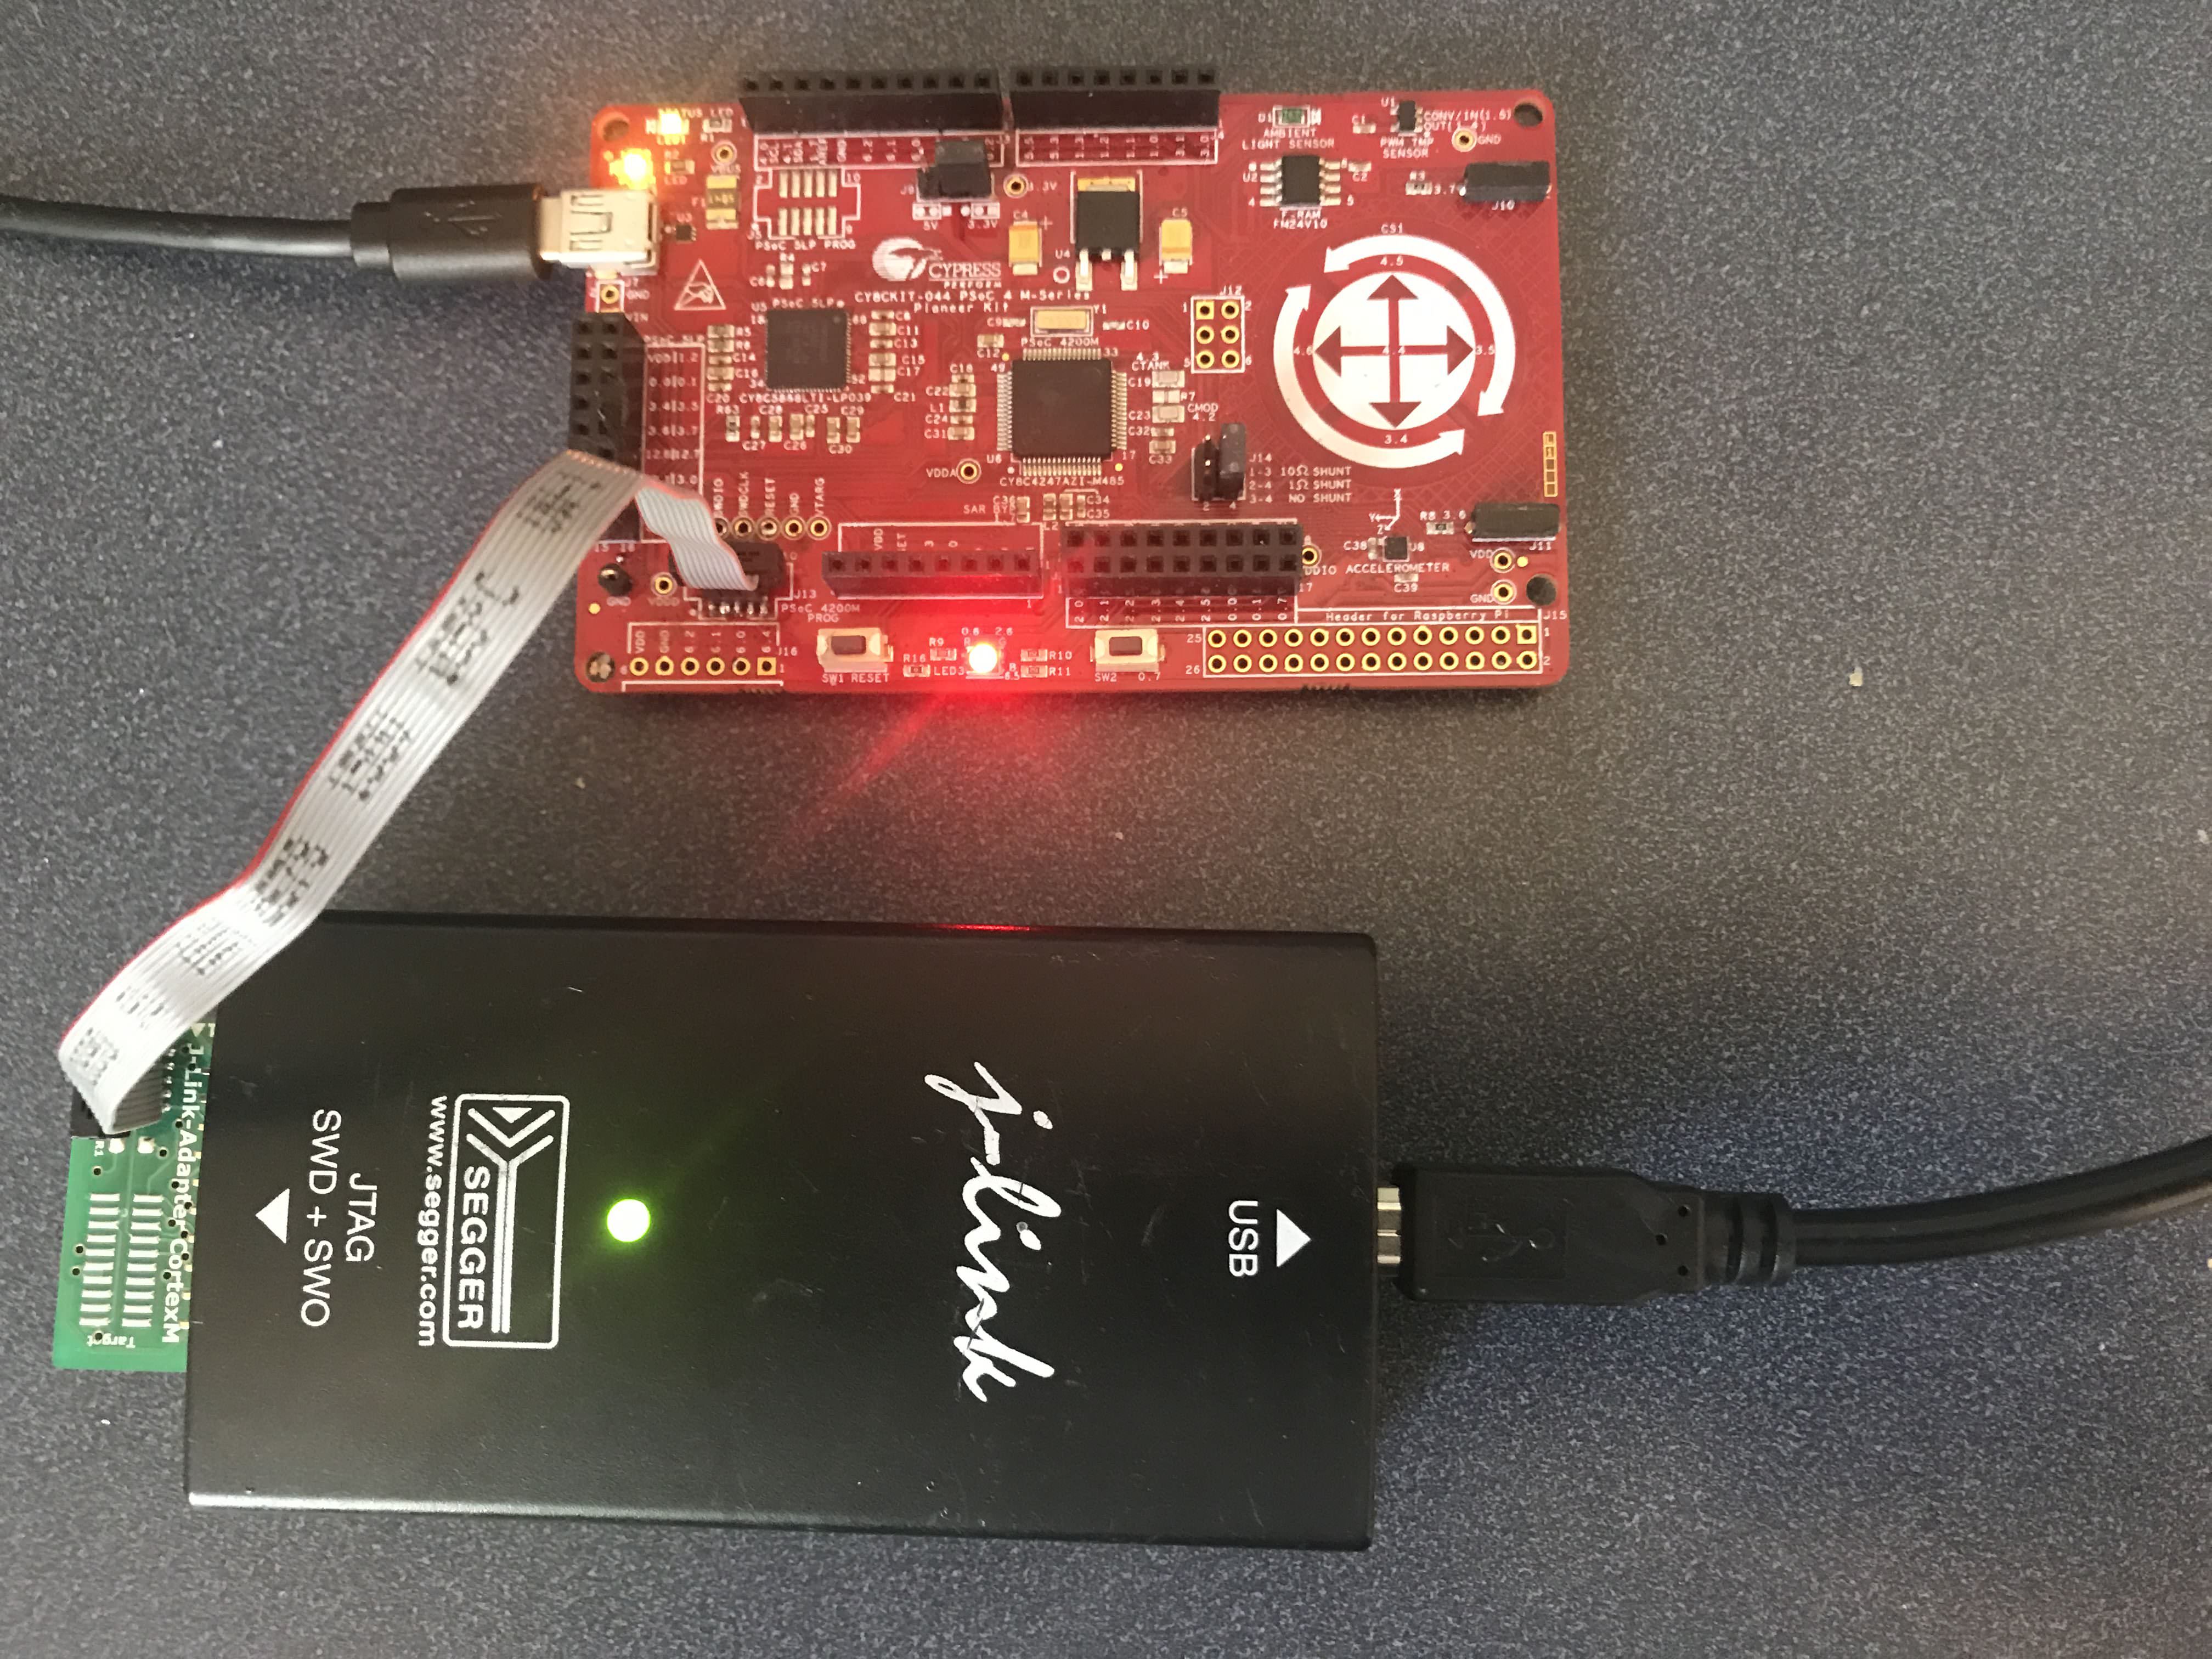
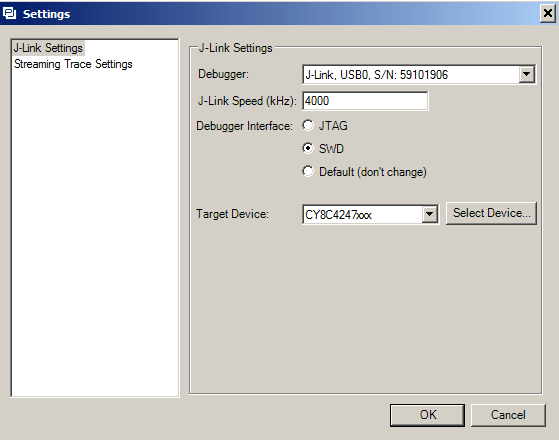
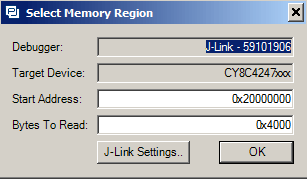
// To use method 3: JLINK RTT
// Remove the previous streamport files from the project
// Remove the Streamport include path
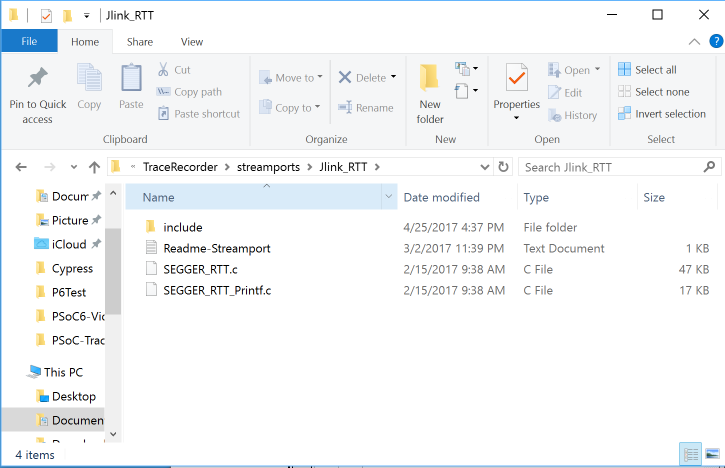
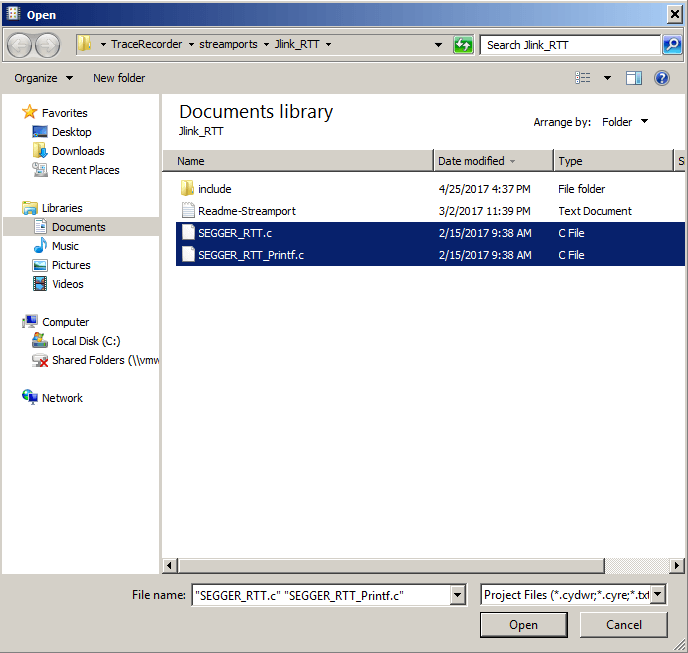
// add the TraceRecorder/streamports/JLink_RTT/Segger_RTT.c to the project
// add the TraceRecorder/streamports/JLink_RTT/Segger_RTT_Printf.c to the project
// add the TraceRecorder/streamports/JLink_RTT/include/trcStreamingPort.h
// add the TraceRecorder/streamports/JLink_RTT/include/Segger_RTT.h
// add the TraceRecorder/streamports/JLink_RTT/include/Segger_RTT_Conf.h
// add the TraceRecorder/streamports/JLink_RTT/include to the compiler include directories


#include "project.h"
#include "FreeRTOS.h"
#include "timers.h"

// An example Task
void ledTask(void *arg)
{
    (void)arg;
    while(1)
    {
        RED_Write(~RED_Read());
        vTaskDelay(500);  
    }
}

int main(void)
{
    CyGlobalIntEnable;
    FreeRTOS_Start();
    
    #if ( configUSE_TRACE_FACILITY == 1 )
    vTraceEnable(TRC_START);
    #endif
    
    xTaskCreate(ledTask,"LED Task",configMINIMAL_STACK_SIZE,0,1,0);
    vTaskStartScheduler();  // Will never return
    while(1);               // Eliminate compiler warning
}


Topic Description
FreeRTOS: A PSoC4 FreeRTOS Port An introduction to making FreeRTOS work on PSoC 4
FreeRTOS PSoC Examples Using multiple tasks in FreeRTOS
FreeRTOS Queue Example Using a queue to communicate between tasks
PSoC 6 FreeRTOS - The First Example Booting FreeRTOS on PSoC 6
FreeRTOS Binary Semaphore An first example of a binary semaphore
FreeRTOS Binary Semaphore (Part 2) Removing polling in the UART Task
FreeRTOS Counting Semaphore An example using a counting semaphore
PSoC FreeRTOS Reading I2C Sensors with a shared I2C Bus
PSoC FreeRTOS Task Notify A light weight scheme to replace Semaphores
PSoC FreeRTOS Task Notification Values A very light weight method to transfer one word of information into a task

FreeRTOS PSoC Component

Summary

This weekend I found myself down a rabbit hole, beating my head on the wall trying to make a USB driver work properly inside of Parallels & Windows 10 on my Mac (which I still don’t have quite right).  While going through that excruciating process I ended up creating 3-4-5 different FreeRTOS PSoC projects, which although not difficult, is still a bit of a pain as it requires 1/2 dozen step.  After reflecting on it a while I decided that I needed something easier.  The obvious thing to do was to build a FreeRTOS PSoC Component, which I did, but eventually abandoned (Ill talk about that process in the next section).  After the component idea was abandoned I decided to just make a template project that could be used to start a FreeRTOS PSoC Project (the next Article).

In this article I will show you:

  • An example project using a clever FreeRTOS PSoC Component that I found on GitHub built by E2ForLife
  • A discussion of the implementation details of that FreeRTOS PSoC Component
  • A discussion of problems with that implementation which lead me to build a template project.

FreeRTOS PSoC Component Example Project

When I first started looking at FreeRTOS I wasn’t totally sure where to start.  When I googled FreeRTOS PSoC, one of the first hits was this repo which contains a PSoC Component that was built by “E2ForLife”.  I really liked the idea of a component based FreeRTOS implementation, as all you would need to do is place the components… and then away you go.  The more that I looked at the component the more that I liked what E2ForLife had done.  When I cloned his repo, there was “nothing” in it, but it turns out there is another branch called “Implement-PSoC5” which makes me think that he was partially done (he hasn’t been changed since August 2015)

First, his example project.  When you look at the schematic you see a nice looking FreeRTOS PSoC Symbol (obviously E2ForLife draws way better than me).

FreeRTOS PSoC Component

When you double click the component you see all of the stuff that is normally in FreeRTOSConfig.h which you can set using the GUI instead of the FreeRTOSConfig.h

FreeRTOS PSoC Component Configuration

When you “Generate Application” you can see that he setup all of the FreeRTOS files to come into the Generated Source automatically (though with different names)

FreeRTOS PSoC Component API

And his FreeRTOS PSoC Component example project is straight forward

#include <project.h>

xTaskHandle redTask;
xTaskHandle blueTask;
xTaskHandle greenTask;

void vRedTask( void* pvParameters);
void vGreenTask( void* pvParameters);
void vBlueTask( void* pvParameters);

int main()
{
    CyGlobalIntEnable; /* Enable global interrupts. */

	xTaskCreate(vRedTask,"red",80,NULL,3,&redTask);
	xTaskCreate(vGreenTask,"green",80,NULL,3,&greenTask);

	FreeRTOS_Start();
	
    for(;;);
}

void vRedTask( void* pvParameters)
{
	for(;;) {
		vTaskDelay( 125/portTICK_RATE_MS );
		RED_Write( ~RED_Read() );
	}
}

void vGreenTask( void* pvParameters)
{
	for(;;) {
		vTaskDelay( 219/portTICK_RATE_MS );
		GREEN_Write( ~GREEN_Read() );
	}
}

He built a function called “FreeRTOS_Start()” which installs the interrupt vectors then starts up the scheduler.

uint8 FreeRTOS_initVar = 0;

/* ------------------------------------------------------------------------ */
void FreeRTOS_Init( void )
{
    /* Handler for Cortex Supervisor Call (SVC, formerly SWI) - address 11 */
    CyIntSetSysVector( CORTEX_INTERRUPT_BASE + SVCall_IRQn,
        (cyisraddress)vPortSVCHandler );
    
    /* Handler for Cortex PendSV Call - address 14 */
	CyIntSetSysVector( CORTEX_INTERRUPT_BASE + PendSV_IRQn,
        (cyisraddress)xPortPendSVHandler );    
    
    /* Handler for Cortex SYSTICK - address 15 */
	CyIntSetSysVector( CORTEX_INTERRUPT_BASE + SysTick_IRQn,
        (cyisraddress)xPortSysTickHandler );
	
	FreeRTOS_initVar = 1;
}
/* ------------------------------------------------------------------------ */
void FreeRTOS_Enable( void )
{
	/* start the scheduler so the tasks will start executing */
	vTaskStartScheduler();	
}
/* ------------------------------------------------------------------------ */
void FreeRTOS_Start( void )
{
	if (FreeRTOS_initVar == 0) {
		FreeRTOS_Init();
	}
	FreeRTOS_Enable();
	
	/*
	 * After the scheduler starts in Enable(), the code should never get to
	 * this location.
	 */
	for (;;);
}

And when you run the FreeRTOS PSoC Component project you get the nice blinking LED (Red and Green)

CY8CKIT-042

FreeRTOS PSoC Component

After downloading the project, then opening it I first wanted to look at the components.  You can do this by clicking the “Components” tab in the workspace explorer.  It looks like he created (or was planning to create) several other components in addition to the “FreeRTOS”.

FreeRTOS PSoC Component

When you double click on the “FreeRTOS_v8_2.cysym” you will get an editable view of the symbol.

FreeRTOS PSoC Component Symbol

When you right click on the blank part of the canvas, PSoC Creator will bring up this menu.

PSoC Creator Configuration

On the properties menu you can configure which tab the component belongs to in the Component Catalog.  In this case he created a tab called “Community” which looks like this in the actual Component Catalog.

PSoC Creator Component Catalog

To make that happen he setup the “Doc.CatalogPlacement” to be “Community/Operating System/FreeRTOS” (on the properties menu)

FreeRTOS PSoC Component Parameter Configuration

The next thing that he did was add a whole bunch of Symbol Parameters which will let the user change the setup of FreeRTOS. Each  of these parameters show up as an editable field on the component customers (in the schematic).

FreeRTOS PSoC Parameter

In the picture above you can see that he created two new “enumerated” datatypes called “FreeRTOS_CheckStackOverFlowType” “FreeRTOS_MemMangType”.  In the picture below you can see the legal values for that type.  This lets him restrict the things that the user of the component can select when he places it in his schematic.

FreeRTOS PSoC Component Configuration

Here is what the component looks like when the user actually uses it.  You can see the legal fields (from above) and the legal values for those fields (from above)

FreeRTOS PSoC Component Configuration

The next thing that he did was copy all of the FreeRTOS files into component API.

FreeRTOS PSoC Component API

If you remember each FreeRTOS project needs to have a file called “FreeRTOSConfig.h”.  But, that file doesn’t appear to exist in the list above.  How is that?  Remember that when PSoC Creator builds a project it copies the API into your generated source directory, but it renames each of the files to be INSTANCE_NAME_filename.  In this example, “Config.h” will become “FreeRTOS_Config.h” (FreeRTOS is the instance name in the schematic)

In FreeRTOS each of the features of the RTOS turn into a #define that is 0 or 1.  When the component was created he modified “Config.h” so that each of the parameters on the component set values for the #defines in the “Config.h” file.  And there is a bunch of them so that must have taken a good bit of work.  Here is an example of a section of his “Config.h”.  Each place you see the back-tick $parameter back-tick PSoC Creator will substitute the value of the parameter (I am typing back-tick because WordPress interprets the actual symbol to mean something special and I don’t know how to get it into the text)

#if CY_PSOC4
    
    /* Port-dependent settings - not user-editable */
    #define configCPU_CLOCK_HZ          ( ( unsigned long ) CYDEV_BCLK__SYSCLK__HZ )
        
    /* Application settings - user editable */
    #define configMAX_PRIORITIES		( `$MAX_PRIORITIES` )
    #define configTOTAL_HEAP_SIZE		( `$TOTAL_HEAP_SIZE` )
    
#elif CY_PSOC5
    
    /* Device settings - not user-editable */
    #define configCPU_CLOCK_HZ			( ( unsigned long ) BCLK__BUS_CLK__HZ )
        
    /* Application settings - user editable */
    #define configMAX_PRIORITIES        ( `$MAX_PRIORITIES` )
    #define configTOTAL_HEAP_SIZE		( `$TOTAL_HEAP_SIZE` ) 
    
#else
    
    #error "This FreeRTOSConfig.h file is for PSoC 4 and PSoC 5LP devices only"
    
#endif

#define configUSE_PREEMPTION			`$USE_PREEMPTION`
#define configUSE_IDLE_HOOK				`$USE_IDLE_HOOK`
#define configUSE_TICK_HOOK				`$USE_TICK_HOOK`
#define configTICK_RATE_HZ				( ( portTickType ) `$TICK_RATE_HZ` )

Because each filename changes name, he had to go fix all of the #includes to look like this example from croutine.c (this was a bunch of work)

/* PSoC Component Customizations */

#include "`$INSTANCE_NAME`.h"
#include "`$INSTANCE_NAME`_task.h"
#include "`$INSTANCE_NAME`_croutine.h"

He also wanted to be able to have all of the FreeRTOS memory management schemes included in the project at one time.  To solve this problem he put an #if around all of the code in heap_1, heap_2 … that adds and removes the appropriate memory manager.

#if (`$MemManager` == 2)

.
.
.
.
.

#endif

A FreeRTOS PSoC Template Project

When I started working on FreeRTOS I knew that I wanted to use V9.0.  But the component was setup for V8.2.  So I launched into the process of converting the component.  This turned out to be a colossal pain in the ass because of the massive number of “small” changes.  In addition I didn’t really like having to change the names of key files (even the stupidly named semphr.h).  Moreover, the source code as a component debate was raging wildly inside of Cypress and in general is on the way out.  So I decided to implement this as a template project instead of a component.

All that being said, what E2ForLife did I continue to think was really clever.

Topic Description
FreeRTOS: A PSoC4 FreeRTOS Port An introduction to making FreeRTOS work on PSoC 4
FreeRTOS PSoC Examples Using multiple tasks in FreeRTOS
FreeRTOS Queue Example Using a queue to communicate between tasks
PSoC 6 FreeRTOS - The First Example Booting FreeRTOS on PSoC 6
FreeRTOS Binary Semaphore An first example of a binary semaphore
FreeRTOS Binary Semaphore (Part 2) Removing polling in the UART Task
FreeRTOS Counting Semaphore An example using a counting semaphore
PSoC FreeRTOS Reading I2C Sensors with a shared I2C Bus
PSoC FreeRTOS Task Notify A light weight scheme to replace Semaphores
PSoC FreeRTOS Task Notification Values A very light weight method to transfer one word of information into a task

Percepio Tracealyzer – Running on PSoC6

Summary

I have been having an excellent experience with Percepio Tracealyzer on PSoC4, so now, the next question is, “Will it work on PSoC6?”  The answer is yes, but it takes a few gyrations.  In the next two Articles I will show you how to use Tracealyzer on PSoC6 with:

  1. JLINK and Snapshot mode
  2. JLINK and Segger RTT in Streaming Mode
  3. A PSoC6 DMA –> UART Streaming Mode

In order to make these work you need to

  1. Make a new project and integrate the Trace Recorder Library
  2. Modify trcConfig.h
  3. Install the JLINK
  4. Build the project & test

Create a new PSoC6 project & Integrate the Trace Recorder Library

The process of integrating the TraceRecorder library is very similar to PSoC 4.  You need to add the include directories into your project.  Right click the project and pick “Build Settings…”

Click on the “Additional Include Directories”

Then add the two TraceRecorder include directory and the StreamPort include directory.

Next you should copy the configuration header files into your project so that you can edit them.  You can copy-paste them in Windows Explorer from “TraceRecorder/config” into your project

Next add the TraceRecoder .c and .h files into your project by right clicking “Add –>Existing Item..”

You need the .c and .h files from

  • yourproject/{trcConfig.h, trcSnapshotConfig.h, trcStreamingConfig.h}
  • TraceRecorder/*.c
  • TraceRecorder/include/*.h
  • TraceRecorder/streamports/Jlink_RTT/include/*.h
  • TraceRecorder/streamports/Jlink_RTT/*.c


Modify FreeRTOSConfig.h & trcConfig.h

The next step is to modify FreeRTOSConfig.h to include the trace recorder header.   Copy this block of code into the bottom for FreeRTOSConfig.h

#if ( configUSE_TRACE_FACILITY == 1 )
#include "trcRecorder.h"
#endif

Update the FreeRTOSConfig.h to turn on tracing.

#define configUSE_TRACE_FACILITY                1

Then modify trcConfig.h to include the CMSIS Core headers.

/******************************************************************************
 * Include of processor header file
 * 
 * Here you may need to include the header file for your processor. This is 
 * required at least for the ARM Cortex-M port, that uses the ARM CMSIS API.
 * Try that in case of build problems. Otherwise, remove the #error line below.
 *****************************************************************************/
//#error "Trace Recorder: Please include your processor's header file here and remove this line."

#include "cy8c6347bzi_bld53.h"

The first time that I did this, I tried just #include <project.h> but if you do that you will end up with hundreds of errors and hours and hours of trying to figure out what is going on.  It turns out that the FreeRTOS is picky about the order in which files are included.  And when PSoC Creator makes the project.h it assumes that the order of includes doesn’t matter.  I fixed this by just including the “cy8c6347bzi_bld53.h” header which just? has the CMSIS files.

After fixing that mess, I modify the trcConfig to specify that I am using a Cortex-M processor (actually two of them)

/*******************************************************************************
 * Configuration Macro: TRC_CFG_HARDWARE_PORT
 *
 * Specify what hardware port to use (i.e., the "timestamping driver").
 *
 * All ARM Cortex-M MCUs are supported by "TRC_HARDWARE_PORT_ARM_Cortex_M".
 * This port uses the DWT cycle counter for Cortex-M3/M4/M7 devices, which is
 * available on most such devices. In case your device don't have DWT support,
 * you will get an error message opening the trace. In that case, you may 
 * force the recorder to use SysTick timestamping instead, using this define:
 *
 * #define TRC_CFG_ARM_CM_USE_SYSTICK
 *
 * For ARM Cortex-M0/M0+ devices, SysTick mode is used automatically.
 *
 * See trcHardwarePort.h for available ports and information on how to 
 * define your own port, if not already present.
 ******************************************************************************/
//#define TRC_CFG_HARDWARE_PORT TRC_HARDWARE_PORT_NOT_SET
#define TRC_CFG_HARDWARE_PORT TRC_HARDWARE_PORT_ARM_Cortex_M

Ill start the project just using Snapshot mode

/*******************************************************************************
 * Configuration Macro: TRC_CFG_RECORDER_MODE
 *
 * Specify what recording mode to use. Snapshot means that the data is saved in
 * an internal RAM buffer, for later upload. Streaming means that the data is
 * transferred continuously to the host PC. 
 *
 * For more information, see http://percepio.com/2016/10/05/rtos-tracing/
 * and the Tracealyzer User Manual.
 *
 * Values:
 * TRC_RECORDER_MODE_SNAPSHOT
 * TRC_RECORDER_MODE_STREAMING
 ******************************************************************************/
#define TRC_CFG_RECORDER_MODE TRC_RECORDER_MODE_SNAPSHOT
//#define TRC_CFG_RECORDER_MODE TRC_RECORDER_MODE_STREAMING

To start the testing I created a really simple, single task blinked led program in main_cm4.c. The only thing that you have to add is the “vTraceEnable(TRC_START)” to turn on the TraceRecorder.

#include "project.h"

void ledTask(void *arg)
{
    (void)arg;
    while(1)
    {
        Cy_GPIO_Inv(RED_PORT,RED_NUM);
        vTaskDelay(500);
    }
}

int main(void)
{
    __enable_irq(); /* Enable global interrupts. */

    vTraceEnable(TRC_START);
    xTaskCreate(ledTask,"LED Task",configMINIMAL_STACK_SIZE,0,1,0);
    vTaskStartScheduler();
}

Testing Percepio Tracealyzer

To start with I setup snapshot mode.  I wasn’t sure exactly what the memory map was for the new PSoC6.  But I did know that PSoC Creator copied in a linker file (actually 3 linker files) and that if I looked in the file I would find the memory map.

When I opened the GCC linker file “cy8c6xx7_cm4_dual.ld” I found the memory map for the chip.

MEMORY
{
    flash       (rx)    : ORIGIN = 0x10080000, LENGTH = 0x80000
    wflash            (rx)    : ORIGIN = 0x14000000, LENGTH = 0x8000          /*  32 KB */
    sflash_user_data  (rx)    : ORIGIN = 0x16000800, LENGTH = 0x800
    sflash_nar        (rx)    : ORIGIN = 0x16001A00, LENGTH = 0x200
    sflash_public_key (rx)    : ORIGIN = 0x16005A00, LENGTH = 0xC00
    sflash_toc_2      (rx)    : ORIGIN = 0x16007C00, LENGTH = 0x400
    xip               (rx)    : ORIGIN = 0x18000000, LENGTH = 0x8000000       /* 128 MB */
    efuse             (r)     : ORIGIN = 0x90700000, LENGTH = 0x100000        /*   1 MB */
    ram   (rwx) : ORIGIN = 0x08024000, LENGTH = 0x23800
}

To make read the Percepio Tracealyzer snapshot you need to select “JLink -> Read Trace (Snapshot)”.  When you do that, it asks you where the RAM is on that device.  I simply copy from the linker file the start and length of the RAM

After that I get the trace.

The next thing to do is modify the trcConfig.h to switch to streaming mode:

/*******************************************************************************
 * Configuration Macro: TRC_CFG_RECORDER_MODE
 *
 * Specify what recording mode to use. Snapshot means that the data is saved in
 * an internal RAM buffer, for later upload. Streaming means that the data is
 * transferred continuously to the host PC. 
 *
 * For more information, see http://percepio.com/2016/10/05/rtos-tracing/
 * and the Tracealyzer User Manual.
 *
 * Values:
 * TRC_RECORDER_MODE_SNAPSHOT
 * TRC_RECORDER_MODE_STREAMING
 ******************************************************************************/
//#define TRC_CFG_RECORDER_MODE TRC_RECORDER_MODE_SNAPSHOT
#define TRC_CFG_RECORDER_MODE TRC_RECORDER_MODE_STREAMING

After I reprogram my CY8CKIT-062 BLE, then “File->Connect to Target System” I end up with a nice stream of data.

And when I look at the stream it says that things are working just as expected.

Im not sure what its next.  Maybe I will make a DMA/UART version so as not to require the JLKINK.

As always you can find all of these projects on the IotExpert GitHub site or git@github.com:iotexpert/PSoC-Tracelyzer.git

Article Description
Percepio Tracealyzer & PSoC An Introduction to Percepio Tracealyzer on the Cypress PSoC
Percepio Tracealyzer RTT Streamport - PSoC4200M Make the JLINK RTT Library work with Tracealyzer
Percepio Tracealyzer PSoC UART Streamport Creating a UART Streamport
Percepio Tracealyzer - Analyzing the PSoC Tracealyzer Streamport Figure out what is broken in the UART Streamport
Percepio Tracealyzer - Using PSoC DMA to Fix the UART Streamport Implementing PSoC DMA to improve the CPU Utilization
Percepio Tracealyzer - Running on PSoC6 Porting the Percepio Tracealyzer to PSoC6

Percepio Tracealyzer: A PSoC DMA Streamport

Summary

In the last Article I analyzed the performance problems of my firmware based PSoC Tracealyzer Streamport … which was terrible.  Although it has been a long time since I used the PSoC4M DMA engine, I knew that it would solve my problem.  In this article Ill show how to use the PSoC DMA, then Ill build and analyze a PSoC DMA Streamport for Tracealyzer.

PSoC4 UART DMA

The DMA block that shows up in the PSoC4200M, PSoC 4200L and PSoC4BLE is pretty amazing.  It can do a bunch of stuff.  Here is a snapshot that I took out of the TRM.  This block sits on the main AHB bus inside of the PSoC.  It can act as a master (see the block that says Master I/F) and read and write any of things in the ARM address space including the Flash, SRAM, and all of the peripherals.  It has an incoming trigger which can get the transfers going and when it is done it can trigger an interrupt or another DMA channel.  The Slave I/F allows the CPU to program the block.  The device has 8-channels with each channel having 2 descriptors (so it can ping pong).

PSoC4 DMA

Before I tried to make the PSoC DMA Streamport I started by looking at the example projects by pressing “File->Code Example”

PSoC Creator Example

Then filtering for DMA

PSoC Creator Example Project - DMA

Finally creating project.  This project uses two DMA channels, one for the UART receive and one for the UART Transfer.  It lets you type characters into the UART, it saves them in one of the RAM buffers, then when you have typed 8, it DMAs them back into the Transmit channel of the UART.  This example ping-pings back and forth between two RAM buffers.

PSoC Creator DMA Example

I decided that it would be best to build a bare metal DMA project called “test-uart” to prove that I understood.  This project will DMA transfer an array of characters to the UART when the user presses the switch on the board or a “s” on the keyboard.  The first thing to do is build the schematic with a UART, a DMA block,  two output pins, and input pin and an interrupt.

PSoC DMA Streamport

Place an SCB UART. then configure it (change the name, but accept all of the defaults)

PSoC Creator UART

Then click on the advanced tab.  Turn on the DMA for Transfer (TX Output) and set the “FIFO Level” to 7.  This will cause the UART to assert DMA signal anytime the transmit FIFO has less than 7 bytes.  In  other words … FEED ME!!!

After configuring the UART, Set the PINs

PSoC DMA Streamport Pin Assignment

Next configure the DMA.  The memory array that I have will be “uint8_t” aka “char”.  So the input needs to be “bytes”.  The UART FIFO hold Words… aka 4 bytes.  So I need to configure the transfers to do “Byte to Word”.  After the DMA transfer is done, I setup the DMA to create an interrupt (so that I can reset everything in the CPU) and to invalidate the descriptor.

PSoC DMA Streamport

In the firmware works by

  • Turning on the UART
  • Enabling the DMA
  • Setting up the channel with the address of the buffer that I am going to write to (aka the TX FIFO) and asking for an interrupt

Then looping:

  • When the User presses “s” or the switch, I set myFlag to be 1.
  • If it is 1 and the channel is inactive, then initialize the “source” address, setup the number of transfer elements to be the number in my array, validate the descriptor, and turn on the channel.

When the channel turns on, the Tx fifo will be empty so it will assert the Tx Out, which will make the DMA keep triggering and copying 1 byte at a time into the FIFO.  While this is happening, the UART will try to empty the fifo by sending the bytes.  Finally when the DMA reaches the end of the RAM buffer, it will stop, and at some point the TX FIFO will finish emptying.  The DMA will trigger the interrupt to toggle the BLUE LED.  And the whole process can start again.

#include "project.h"
#include <stdio.h>

// A flag to trigger the DMA
volatile int myFlag=0;
  
static const char myArray[]="asdf1234asdfadsfasdfadsfqwerasdfqwerqwer9\n";

CY_ISR(sw_handler)
{
    myFlag = 1;
    SW_ClearInterrupt();
}

// This is called TWICE at the end of the DMA transaction
CY_ISR(myDMA)
{
    BLUE_Write(~BLUE_Read());
}
int main(void)
{
    CyIntEnable(CYDMA_INTR_NUMBER);
    CyGlobalIntEnable; /* Enable global interrupts. */

    char c;
    
    UART_Start();
    UART_UartPutString("Started\n");
  
    isr_1_StartEx(sw_handler);
  
    CyDmaEnable();
    
    DMA_Init();
    DMA_SetDstAddress(0, (void *)UART_TX_FIFO_WR_PTR);
    DMA_SetInterruptCallback(myDMA);

    while(1)
    {
        c = UART_UartGetChar();
        switch(c)
        {       
            case 's':
                myFlag = 1;
            break;
        }
        
        // This turns on the DMA so that the string will go to the UART.
        if(myFlag && CyDmaGetActiveChannels() == 0)
        {
            DMA_SetSrcAddress(0, (void *)myArray);
            DMA_SetNumDataElements(0,strlen(myArray)-1);
            DMA_ValidateDescriptor(0);
            DMA_ChEnable();
            myFlag=0;
        }
    }
}

PSoC DMA Streamport

Now that I understand how to use the DMA, I can create the PSoC DMA Streamport by copying the project “1-BlionkingLED_UART_TRACE” project and calling it “1-BlinkingLED_UART_TRCE_DMA”.  Next, add the DMA and modify the UART.

PSoC DMA Streamport

Configure the UART

PSoC DMA Streamport - UART Configuration

Turn on the UART DMA and set the level to 7

Configure the DMA Block

PSoC DMA Streamport Configuration

Make byte transfers and byte –> word.

PSoC DMA Streamport - DMA Configuration

Finally modify the trcStreamingPort.c – AKA the PSoC DMA Streamport file.  Specifically you need to fix up the PSoC_Transmit to send out the data when the TraceRecorder buffer is full.

  • If the DMA is busy… then wait until the previous transaction is done.
  • Then setup the DMA and let it rip.
int32_t PSoC_Transmit(void* data, uint32_t size, int32_t *numOfBytesSent )
{
    
    while( CyDmaGetActiveChannels()& DMA_CHANNEL_MASK);
    DMA_SetSrcAddress(0, (void *)data);
    DMA_SetNumDataElements(0,size);
    DMA_ValidateDescriptor(0);
    DMA_ChEnable();

    *numOfBytesSent=size;
    
    return 0; // Doesnt matter what you return... i dont think that it is checked
}

The only other thing that needs to happen is configure the DMA in main.c

    CyDmaEnable();
    DMA_Init();
    DMA_SetDstAddress(0, (void *)UART_TX_FIFO_WR_PTR);

Testing the PSoC DMA Streamport

Now when I startup the Tracealyzer, here is what I get:

PSoC DMA Streamport - New CPU Load

It looks like I solved my problem because that is way way better than:

PSoC DMA Streamport - Terrible Performance

As always you can find all of these projects on the IotExpert GitHub site or git@github.com:iotexpert/PSoC-Tracelyzer.git

Article Description
Percepio Tracealyzer & PSoC An Introduction to Percepio Tracealyzer on the Cypress PSoC
Percepio Tracealyzer RTT Streamport - PSoC4200M Make the JLINK RTT Library work with Tracealyzer
Percepio Tracealyzer PSoC UART Streamport Creating a UART Streamport
Percepio Tracealyzer - Analyzing the PSoC Tracealyzer Streamport Figure out what is broken in the UART Streamport
Percepio Tracealyzer - Using PSoC DMA to Fix the UART Streamport Implementing PSoC DMA to improve the CPU Utilization
Percepio Tracealyzer - Running on PSoC6 Porting the Percepio Tracealyzer to PSoC6

Percepio Tracealyzer – Analyzing the PSoC Tracealyzer Streamport

Summary

In the previous article I showed you how to make a PSoC Tracealyzer Streamport using the SCB based UART on a PSoC 4200M.  It didn’t take long for me to realize that 115200 baud was not going to cut it.   That realization lead me to figure out that the KitProg on the CY8CKIT-044 was limited to 115200, which I worked around by using the Cypress USB Serial Bridge that I got from the CY8CKIT-049.  But when I look at the CPU graph I found out that it took 50% of the CPU to support streaming the data.  So now what?  In this Article lets analyze the data, both old school with a logic analyzer, and new school with PSoC Tracealyzer.

Analyzing the PSoC Tracealyzer Data

While I was capturing the streaming data from PSoC Tracealyzer I could see that the CPU was burning about 50% of the time just running the TzCntrl and blinking LED thread.  That isn’t good.

PSoC Tracelyzer

When you look at the PSoC Tracealyzer trace viewing you can see the problem is the TzCtrl task.  This task is running for 83 milliseconds and using 57.6% of the CPU.

PSoC Tracelyzer - analyzing the CPU Usage

If you look at the data transmit function called “PSoC_Transmit”, there isn’t much going on.  Just a call to UART_SpiUartPutArray.  But if you look at the UART documentation you will find that SpiUartPutArray is a blocking function, meaning it doesn’t return until it is done.  If you calculate the time to transfer a block of 1024 bytes at 8bits/byte and 230400 baud you will find that just sending the data takes 35ms.

int32_t PSoC_Transmit(void* data, uint32_t size, int32_t *numOfBytesSent )
{
    timing_Write(1);
    UART_SpiUartPutArray((uint8_t *)data,size);
    *numOfBytesSent=size;
    timing_Write(0);
    return 0; // Doesnt matter what you return... i dont think that it is checked
}

I was not very sure why the task was taking 83 milliseconds to run when the data transfer was only taking 40ms.  To figure this out I added a toggle pin to the data write routine, just to make sure.  What I found is the data write routine is getting called about every 70ms takes ~30ms to run.

Old school with Salae Logic

How is that possible, the calculation says that it should take 35ms.  It turns out that I configured the UART to have a 64 byte buffer.

PSoC Creator SCB Configuration

When you remove the 64 bytes from the calculation you end up with 32ish milliseconds.  The other thing that this chart shows is that the TzCntrl task is calling the PSoC_Transmit function more frequently that I thought, at least twice per cycle.  You can also see from the plot that function is taking 30/70=42.8% of the CPU by itself.  Not good, but we are starting to understand what is going on.

As I typed this part of the Article I realized that toggling a GPIO probably wasn’t the best way to figure out what was happening.  In fact, that is the whole point of Tracealyzer, that is analyzing the performance of your program.  When I looked at the Tracealyzer documentation (I always hate doing that), I found a nice function called vTracePrintf.  I added a “toggle” aka printing a 0 and printing a 1 into trace channel 0.

int32_t PSoC_Transmit(void* data, uint32_t size, int32_t *numOfBytesSent )
{
    timing_Write(1);
    vTracePrintF(0,"1");
    UART_SpiUartPutArray((uint8_t *)data,size);
    vTracePrintF(0,"0");
    timing_Write(0);
    *numOfBytesSent=size;
    
    return 0; // Doesnt matter what you return... i dont think that it is checked
}

After running another trace, look what I get.  You can see the “1” printing at the start and the 0 printing at the end.

PSoC Tracelyzer - Analyzing the CPU Usage with vTaskPrintF

Even better, when I double clicked on the “[Default Channel] 0” it took me to this nice screen which shows when the events occurred.  The one that I clicked on started at 8.136.039 and ended at 8.176.176, in other words it took about 40ms

PSoC Tracelyzer - User Events from Tracelyzer

After hand calculating the time, I realized that once again I should have done something even more obvious, let the ARM calculate the time.  the vTracePrintf will let you specify the output format, in this case a %d

int32_t PSoC_Transmit(void* data, uint32_t size, int32_t *numOfBytesSent )
{
    TickType_t time;
    
    timing_Write(1);
    
    time = xTaskGetTickCount();
    UART_SpiUartPutArray((uint8_t *)data,size);
    time = xTaskGetTickCount() - time;
    vTracePrintF(0,"%d",time);
    timing_Write(0);
    *numOfBytesSent=size;
    
    return 0; // Doesnt matter what you return... i dont think that it is checked
}

When you look at the trace, you need to click on the “User Events” to see the print outs from the trace.

PSoC Tracelyzer - CPU Usage

Now that we have a pretty good feel for what is going on, how do we fix it?  Simple, use the PSoC DMA take the CPU mostly out of the UART transmission path, which is the topic of the next Article.

As always you can find all of these projects on the IotExpert GitHub site or git@github.com:iotexpert/PSoC-Tracelyzer.git

Article Description
Percepio Tracealyzer & PSoC An Introduction to Percepio Tracealyzer on the Cypress PSoC
Percepio Tracealyzer RTT Streamport - PSoC4200M Make the JLINK RTT Library work with Tracealyzer
Percepio Tracealyzer PSoC UART Streamport Creating a UART Streamport
Percepio Tracealyzer - Analyzing the PSoC Tracealyzer Streamport Figure out what is broken in the UART Streamport
Percepio Tracealyzer - Using PSoC DMA to Fix the UART Streamport Implementing PSoC DMA to improve the CPU Utilization
Percepio Tracealyzer - Running on PSoC6 Porting the Percepio Tracealyzer to PSoC6

Percepio Tracealyzer PSoC UART Streamport

Summary

In the last Article I showed you how to use the JLINK RTT Streamport to make Tracealyzer work.  When I did that port I didn’t really like having to use a JLink, it seemed like a pain to have another box.  I knew that it was possible to make a UART based Streamport.  So, that is what I am going to do, create a Tracealyzer PSoC Streamport.  This Article is going to be broken up into two parts.  In Part 1 I will show you a software based port and the problems that it creates.  In Part 2 I will show you how to use DMA to hopefully (as I haven’t done the work yet) make it work much better.  I was hoping this morning when I started working on this Article that it would only take me a couple of hours, but that did not turn out to be the case as I ran into a PSoC Creator bug which made it hard to figure out what was going on.

Cypress USB Serial Bridge & CY8CKIT-049

If you remember from the last article, the Tracealyzer needs to stream about 20KBs.  That is a big B as in Bytes.  Which means that a 115200 Kbs (aka 14.4 KBs) UART probably won’t do the trick.  That is OK as the PSoC SCB UART can run at up to 921600 aka 115.2 KBs.  The problem is the Kitprog bridge on my development kit is limited to 115200 (I’m not sure why)  I didn’t realize that limitation this morning when I started working on this problem.  But it turns out that the CY8CKIT-049 has a Cypress USB Serial Bridge.which is used to boatload the PSoC4200.  And… it is designed to break off the kit.

CY8CKIT-049

So I broke it off and gave it to my lab assistant to solder (he isn’t normally that grumpy, but he stayed up all night at a birthday party)

Nicholas the Lab Tech

Now I have two wires which I can use to talk to the CY8CKIT-044 UART.

Cypress USB Serial Bridge

After I got the wires on the bridge, I installed the USB Serial Configuration Utility and set the chip up to be 921600 baud.  To do this, run the utility.

USB Serial Configuration Utility

Connect to your bridge, in this case the CY7C65211-24LTXI

USB Serial Configuration Utility

Then pick the SCB (which stands for Serial Communication Block)

USB Serial Configuration Utility

Click the configure, then set the baud to 921600.

USB Serial Configuration Utility

Now, I wire the two kits together (the Jlink is just sitting there)

Percepio Tracelyzer PSoC Setup

Creating a Tracealyzer PSoC UART Streamport

The first thing to do is modify the previous project to also have a UART.

PSoC Creator

Then connect the UART to Pins P3[0] & P3[1]

PSoC Creator

To make the Tracealyzer PSoC Streamport work I make a copy of the TraceRecorder/streamports/USB_CDC and called it PSoC_UART.  After I cut all all of the ST USB crap, I realized that all I need to provide is a

  • A function to receive bytes … called PSoC_Receive
  • A function to transmit bytes… called PSoC_Transmit

Next you need to modify these 10 CPP Macros to support the Tracealyzer PSoC Streamport.   (I only had to modify INIT, READ and SEND)

  • TRC_STREAM_PORT_ALLOCATE_FIELDS
  • TRC_STREAM_PORT_MALLOC
  • TRC_STREAM_PORT_INIT
  • TRC_STREAM_PORT_ALLOCATE_EVENT
  • TRC_STREAM_PORT_ALLOCATE_DYNAMIC_EVENT
  • TRC_STREAM_PORT_COMMIT_EVENT
  • TRC_STREAM_PORT_READ_DATA
  • TRC_STREAM_PORT_PERIODIC_SEND_DATA
  • TRC_STREAM_PORT_ON_TRACE_BEGIN
  • TRC_STREAM_PORT_ON_TRACE_END

In addition I provide function prototypes for PSoC_Receive and PSoC_Transmit which are called by TRC_STREAM_PORT_READ_DATA and TRC_STREAM_PORT_PERIODIC_SEND_DATA

// An Adaption of the Percepio CDC Library to PSoC SCB UART
#include <project.h>
#ifndef TRC_STREAMING_PORT_H
#define TRC_STREAMING_PORT_H
#ifdef __cplusplus
extern "C" {
#endif
/*******************************************************************************
* Implement the below macros to define your own stream port. If your transfer 
* method uses RTOS functions, you should not send the data directly but use 
* the recorder's internal buffer to store the trace data, for later transfer by
* the TzCtrl task. Check the predefined stream ports for examples on how to use 
* the internal buffer (e.g., TCP/IP, UART or USB CDC).
*
* Read more at http://percepio.com/2016/10/05/rtos-tracing/  
******************************************************************************/
int32_t PSoC_Receive(void *data, uint32_t size, int32_t *numOfBytesReceived);
int32_t PSoC_Transmit(void *data, uint32_t size, int32_t *numOfBytesSent );
#if TRC_RECORDER_BUFFER_ALLOCATION == TRC_RECORDER_BUFFER_ALLOCATION_STATIC
#define TRC_STREAM_PORT_ALLOCATE_FIELDS() static char _TzTraceData[TRC_CFG_PAGED_EVENT_BUFFER_PAGE_COUNT * TRC_CFG_PAGED_EVENT_BUFFER_PAGE_SIZE];       /* Static allocation. */
#define TRC_STREAM_PORT_MALLOC() /* Static allocation. Not used. */
#else
#define TRC_STREAM_PORT_ALLOCATE_FIELDS() static char* _TzTraceData = NULL;     /* Dynamic allocation. */
#define TRC_STREAM_PORT_MALLOC() _TzTraceData = TRC_PORT_MALLOC(TRC_PAGED_EVENT_BUFFER_PAGE_COUNT * TRC_PAGED_EVENT_BUFFER_PAGE_SIZE);
#endif
#define TRC_STREAM_PORT_INIT() \
UART_Start(); \
TRC_STREAM_PORT_MALLOC(); /*Dynamic allocation or empty if static */
#define TRC_STREAM_PORT_ALLOCATE_EVENT(_type, _ptrData, _size) _type* _ptrData; _ptrData = (_type*)prvPagedEventBufferGetWritePointer(_size);
#define TRC_STREAM_PORT_ALLOCATE_DYNAMIC_EVENT(_type, _ptrData, _size) TRC_STREAM_PORT_ALLOCATE_EVENT(_type, _ptrData, _size) /* We do the same thing as for non-dynamic event sizes */
#define TRC_STREAM_PORT_COMMIT_EVENT(_ptrData, _size) /* Not needed since we write immediately into the buffer received above by TRC_STREAM_PORT_ALLOCATE_EVENT, and the TRC_STREAM_PORT_PERIODIC_SEND_DATA defined below will take care of the actual trace transfer. */
#define TRC_STREAM_PORT_READ_DATA(_ptrData, _size, _ptrBytesRead) PSoC_Receive(_ptrData, _size, _ptrBytesRead);
#define TRC_STREAM_PORT_PERIODIC_SEND_DATA(_ptrBytesSent) prvPagedEventBufferTransfer(PSoC_Transmit, _ptrBytesSent);
#define TRC_STREAM_PORT_ON_TRACE_BEGIN() { prvPagedEventBufferInit(_TzTraceData); }
#define TRC_STREAM_PORT_ON_TRACE_END() /* Do nothing */
#ifdef __cplusplus
}
#endif
#endif /* TRC_STREAMING_PORT_H */

The last thing to make this work is provide the C function to read and write the UART by modifying trcStreamingPort.c

// An adataption of the Percepio USB_CDC Port to PSoC Serial
#include "trcRecorder.h"
#if (TRC_USE_TRACEALYZER_RECORDER == 1)
#if(TRC_CFG_RECORDER_MODE == TRC_RECORDER_MODE_STREAMING)
#include "stdint.h"
int32_t PSoC_Receive(void *data, uint32_t size, int32_t *numOfBytesReceived)
{
uint8_t *myData= (uint8_t *)data;
*numOfBytesReceived = 0;
while( (*numOfBytesReceived < (int32_t)size) && UART_SpiUartGetRxBufferSize())
{
myData[*numOfBytesReceived] = UART_SpiUartReadRxData();
*numOfBytesReceived += 1;
}
return 0; // Doesnt matter what you return... i dont think that it is checked
}
int32_t PSoC_Transmit(void* data, uint32_t size, int32_t *numOfBytesSent )
{
UART_SpiUartPutArray((uint8_t *)data,size);
*numOfBytesSent=size;
return 0; // Doesnt matter what you return... i dont think that it is checked
}
#endif	/*(TRC_CFG_RECORDER_MODE == TRC_RECORDER_MODE_STREAMING)*/
#endif  /*(TRC_USE_TRACEALYZER_RECORDER == 1)*/

There at two things that are a bit goofy.

  • The return values for both of these function is not used by the calling functions… and is not defined what it means.
  • The 3rd parameter of both functions is defined as int32_t, but in the TraceRecorder library it is defined as int.  This makes a warning, which I got rid of by fixing the bug in the Percepio code.

Testing

To test this you need to change the Tracealyzer settings from JLink to Serial and fix the COM port and baud rate.

Percepio Tracelyzer PSoC Setup

When I built this code originally, I tried 115200 baud.  But it didn’t work at all (it locked up FreeRTOS).  Then I tried 921600 which locked up the Tracealyzer.  I am running Tracealyzer and PSoC Creator on a Mac in a VMWare Fusion Windows 7 box and I am pretty sure that there is a USB bridging problem (I am going to try it on a Windows box).  After grinding for a while I found out that both 230400 and 460800 both worked but both showed something very funny, look at the data:

230400 Baud

Percepio Tracelyzer PSoC - Streaming Data Percepio Tracelyzer PSoC - Streaming Data

460800 Baud

Percepio Tracelyzer PSoC - Streaming Data

Percepio Tracelyzer PSoC - Streaming Data

I knew that my implementation of the Percepio Tracealyzer PSoC Streamport would be demanding on the CPU, but I did not predict that it would take 30-50% of the CPU.  This is definitely a problem as the JLink RTT Streamport only takes 0.4% of the CPU.  To fix this I am going to try using the PSoC4200M DMA to automatically transfer the buffers to the UART.  Hopefully that will make my Tracealyzer PSoC streamport better.  But that is for the next Article.

As always you can find all of these projects on the IotExpert GitHub site or git@github.com:iotexpert/PSoC-Tracelyzer.git

Article Description
Percepio Tracealyzer & PSoC An Introduction to Percepio Tracealyzer on the Cypress PSoC
Percepio Tracealyzer RTT Streamport - PSoC4200M Make the JLINK RTT Library work with Tracealyzer
Percepio Tracealyzer PSoC UART Streamport Creating a UART Streamport
Percepio Tracealyzer - Analyzing the PSoC Tracealyzer Streamport Figure out what is broken in the UART Streamport
Percepio Tracealyzer - Using PSoC DMA to Fix the UART Streamport Implementing PSoC DMA to improve the CPU Utilization
Percepio Tracealyzer - Running on PSoC6 Porting the Percepio Tracealyzer to PSoC6

Percepio Tracealyzer RTT Streamport – PSoC4200M

Summary

In the last article I showed you how to install the Percepio Tracealyzer into your PSoC FreeRTOS project using snapshot mode.   This mode is very convenient as it has little CPU impact and does not require a communication interface.  But your trace it is limited in record time by how much RAM you are willing to dedicate to the trace.   For me, this was not very much because I am using a small PSoC with limited RAM.  In this article I am going to show you how to use the Segger JLink RTT library to support the Tracealyzer RTT Streamport.  With this library built in, the RTOS events will be sent in real-time to the Pecepio Tracealyzer for analysis.

JLink Real Time Transfer (RTT) Library

The engineers at Segger had a great idea.  Really great.  Given that they had direct access to the memory of the ARM M0 (for programming) that could be read and written without CPU intervention via the Coresite Debug Access Port, wouldn’t it be nice if there was a simple way to “send” and “receive” data without using another communication peripheral on the device.

So they built the Segger Real Time Transfer (RTT) Library which works with their JLink.  Here is a picture which I got from their website.

Segger JLink RTT

I will talk more about this library in a future article.

Installing the Percepio Tracealyzer RTT Streamport

I decided to use a copy of the blinking led project (called 1-BlinkingLED) to start the new project.  To copy the project just use CTRL-C and CTRL-V then rename the project to 1-BlinkingLED_RTT.

To make all of this work you need to add the streaming include files for the Tracealyzer RTT Streamport by right clicking “Add–>Exiting Item…”

PSoC Creator Add Existing

Then selecting “TraceRecorder–>streamports–>Jlink_RTT_include”

PSoC Creator Add Existing

Next you need to update the include path for the project by right clicking on the project and selecting “Build Settings”

PSoC Creator Change Build Settings

Then add the path to the TraceRecorder\streamports\JLink_RTT\include

PSoC Creator Update Include Path for Tracelyzer RTT Streamport

Next, add the .c files for the RTT library.

PSoC Creator - Add Tracelyzer RTT Streamport Library

Now that all of the required files are part of your project, you need to modify the “trcConfig.h” to switch to the stream recording mode (line 102).

/*******************************************************************************
* Configuration Macro: TRC_CFG_RECORDER_MODE
*
* Specify what recording mode to use. Snapshot means that the data is saved in
* an internal RAM buffer, for later upload. Streaming means that the data is
* transferred continuously to the host PC. 
*
* For more information, see http://percepio.com/2016/10/05/rtos-tracing/
* and the Tracealyzer User Manual.
*
* Values:
* TRC_RECORDER_MODE_SNAPSHOT
* TRC_RECORDER_MODE_STREAMING
******************************************************************************/
//#define TRC_CFG_RECORDER_MODE TRC_RECORDER_MODE_SNAPSHOT
#define TRC_CFG_RECORDER_MODE TRC_RECORDER_MODE_STREAMING

My PSoC 4M only has 16K of SRAM.  So, I reduce the memory footprint of the streaming buffer by changing it to 1000 byte from 5000 bytes in trcStreamingPort.h.

/*******************************************************************************
* Configuration Macro: TRC_CFG_RTT_BUFFER_SIZE_UP
*
* Defines the size of the "up" RTT buffer (target -> host) to use for writing
* the trace data, for RTT buffer 1 or higher.
*
* This setting is ignored for RTT buffer 0, which can't be reconfigured
* in runtime and therefore hard-coded to use the defines in SEGGER_RTT_Conf.h.
*
* Default buffer size for Tracealyzer is 5000 bytes. 
*
* If you have a stand-alone J-Link probe, the can be decreased to around 1 KB.
* But integrated J-Link OB interfaces are slower and needs about 5-10 KB, 
* depending on the amount of data produced.
******************************************************************************/
//#define TRC_CFG_RTT_BUFFER_SIZE_UP 5000
#define TRC_CFG_RTT_BUFFER_SIZE_UP 1000

Run Tracealyzer

After the project is updated for the Tracealyzer RTT Streamport, I can program it into my CY8CKIT-044 development kit.  The next step is to start the Tracealyzer.  If you have previously run the program it will use your previous J-Link settings.  If you have not run it before then you need to setup the J-Link Settings

Percepio Tracelyzer

I am using a CY8CKIT-044 which has a CY8C4247xxx PSoC 4200M MCU onboard.

Configure JLink for Tracelyzer RTT Streamport

I use the default settings for the Segger RTT.

Tracelyzer RTT Streamport Stream Trace Settings

Once things are setup you can “Connect to Target System…”

Percepio Tracelyzer

Then click “Start Recording”

Percepio Tracelyzer

As you are recording the Tracealyzer shows the CPU usage.  In this case it is very close to 0% as all the program does is blink the LED and then sleep for 500ms.

Percepio Tracelyzer Recording

After I stop recording I can look at the trace.   The first thing to notice in this trace is that I can look at quite a bit more data.  In this case I recorded for about 22 seconds.

Percepio Tracelyzer

In the next article I am planning on doing a Streamport based on the PSoC UART which means I will not need to use a JLink.

As always you can find all of these projects on the IotExpert GitHub site or git@github.com:iotexpert/PSoC-Tracelyzer.git

Article Description
Percepio Tracealyzer & PSoC An Introduction to Percepio Tracealyzer on the Cypress PSoC
Percepio Tracealyzer RTT Streamport - PSoC4200M Make the JLINK RTT Library work with Tracealyzer
Percepio Tracealyzer PSoC UART Streamport Creating a UART Streamport
Percepio Tracealyzer - Analyzing the PSoC Tracealyzer Streamport Figure out what is broken in the UART Streamport
Percepio Tracealyzer - Using PSoC DMA to Fix the UART Streamport Implementing PSoC DMA to improve the CPU Utilization
Percepio Tracealyzer - Running on PSoC6 Porting the Percepio Tracealyzer to PSoC6

Percepio Tracealyzer & PSoC 4200M

Summary

As you have probably noticed, I have spent a significant amount of time in the last few months doing FreeRTOS projects.  One thing that I have been continuously frustrated about is a lack of analysis tools.  How much memory am I using?  How much stack and heap are free?  How long are tasks taking?  How do you get the priorities set right?  And on and on.  A couple of weeks ago I got an email from the guys at Percepio asking me if I wanted to try out the Percepio Tracealyzer.  I said yes… but that I was really busy and it was going to take a while for me to get to it.  So now I have… and this is the first article about the Percepio Tracealyzer.  Unfortunately the story involves me burning myself with a soldering iron but I suppose that isn’t their fault.

In this series of article’s I will instrument the FreeRTOS projects that I have been showing you with the Percepio Tracealyzer Recorder Library, then run the tool to see what is going on.  In this specific Article I will show you how to get the most basic Tracealyzer functionality going on a PSoC4200M.

Percepio Tracealyzer

The way that Percepio Tracelzer works is that you install a bit of code into your project called the Tracealyzer Recorder Library.   In streaming mode, the code creates a new task in FreeRTOS called “TzCtrl” which interacts with the FreeRTOS kernel to record all of the running task information into a communication link (e.g UART, SPI, JLINK RTT, etc.)  In snapshot mode, the kernel information is just written to an SRAM buffer inside of the PSoC.

This is the architecture picture from the Percepio website:

Percepio Tracelyzer Architecture

Updating CY8CKIT-044 PSoC4200M Development Kit

To make the Percepio Tracealyzer work you need to turn the “Snapshot or streaming” line from the picture above into a real connection.  In snapshot mode there are two ways (I think) that you can do it.

  1. You can stop the processor with the debugger, then write the region of memory with the trace buffer into an “.hex” or a “.bin” file.  Then read that file into Percepio Tracealyzer.  Unfortunately the debugger in PSoC Creator cannot create binary output files of regions of memory like that… so plan 1 is out the window
  2. You can attach a Segger JLINK to the PSoC via SWD.  Then, Tracealyzer knows how to talk to the JLink to read the memory.  This is what I am going to do for this Article.

One feature that is very cool about the Snapshot methodology is that Tracealyzer can search the output file and find the trace buffer.  The trace buffer data structure is marked by something that Tracealyzer can find.

When our very good devkit team team in India built the CY8CKIT-044 (which I have used and written about quite a bit), they installed a built in debugger/programmer called “KitProg“.  But they also understood that someone might want to connect some third part debugger like the JLINK.  So… they put the footprint for a 10-pin ARM debugging port onto the board. (see it in the lower left).  Actually if you look at the board, you can see two 10-pin footprints, the one at the top is connected to the PSoC5 (which serves as the KitProg).

CY8CKIT-044 PSoC 4200M Development Kit

Before I can use a JLINK I needed to do this … which unfortunately ended with me burning myself with the soldering iron… bad Alan.

CY8CKIT-044 PSoC 4200M Development Kit

Tracealyzer Snapshot Mode on Blinking LED Project

In a previous article I talked about the organization of PSoC Creator projects, specifically how to handle the situation where you want to include .h/.c files into your project but you don’t want to modify them.  This is exactly what I will do with the Percepio Tracealyzer Recorder Library.  The library has some files which I will want to leave intact and I will just make references to them in my project including trcKernelPort.h, trcPortDefines.h etc.  And there are some files which I will want to modify, which I will copy out of the Trace Recorder Library into my project for editing trcConfig.h, trcSnapShotConfig.h and trcStreamingConfig.h

To start the first Percepio Tracealyzer example I will use the basic “Snapshot Mode”.  There is good documentation on the Percepio Tracealyzer documentation website.  I will start by copying the PSoC Creator Workspace from the FreeRTOS articles from GitHub.  It has 9 projects in it, starting with the blinking led, going to a more complicated multi-thread project.  The next step is to download the FreeRTOS Tracealyzer library from the Perceio website into a parallel directory called “TraceRecorder”.

Make a new folder for the non-changing include files called “TraceRecorder” (for the files that I don’t want to change)

PSoC Creator Project Configuration

Next I will add the files that I don’t want to change to the project so that I can see them (meaning they are just referenced by PSoC Creator)

PSoC Creator Project Configuration - Add External Files

They reside in the directory TraceRecorder/include

PSoC Creator Project Configuration - Add External Files

Once I have the unchanging .h’s into my project, I need to add their directory to the include path.  To do this right-click on the project and select “Build Settings …”

PSoC Creator Project Configuration - Add External Files

Then click “Compiler” and then the “…” on the “Additional Include Directories” line

PSoC Creator Project Configuration - Compiler Options

Navigate until you get to TraceRecoder/include then press “Select Folder”

PSoC Creator Project Configuration - Update include path

Now your include path should look like this:

PSoC Creator Project Configuration - Include Path

Next, I want to copy the configuration files in the Windows Explorer to my project directory so that they become a changeable part of they project.  They reside in TraceRecorder/config (I just did a Ctrl-C to copy)

PSoC Creator Project Configuration - Add Trace Recorder Library

You want to paste them into your project directory

PSoC Creator Project Configuration - Add External Files

Then you need to add them to the project so that you can easily edit them by right clicking on the “Header Files” folder and selecting “Add–>Existing Item”

PSoC Creator Project Configuration - Add External Files

Then selecting them out of your project directory.

PSoC Creator Project Configuration - Add External Files

Now we need to add references to all of the .c files.  Start by making a new folder for the c-files called “TraceRecorder”

PSoC Creator Project Configuration - Add TraceRecorder

Then “Add–>Existing Item…”

PSoC Creator Project Configuration - Add External Files

Select the files from the TraceRecorder directory

PSoC Creator Project Configuration - Add TraceRecorder Files

Now your project should look like this

PSoC Creator Project Configuration - Project Configuration

Your project now has all of the necessary body parts so you next will modify the source files.  Start with modifying FreeRTOSConfig.h to include the TraceRecorder Library stuff.

/* Integrates the Tracealyzer recorder with FreeRTOS */
#if ( configUSE_TRACE_FACILITY == 1 )
#include "trcRecorder.h"
#endif

Then modify the trcConfig.h so that it has access to all of the CMSIS header files.

/******************************************************************************
* Include of processor header file
* 
* Here you may need to include the header file for your processor. This is 
* required at least for the ARM Cortex-M port, that uses the ARM CMSIS API.
* Try that in case of build problems. Otherwise, remove the #error line below.
*****************************************************************************/
//#error "Trace Recorder: Please include your processor's header file here and remove this line."
#include <project.h>

Then tell the TraceRecorder that we are using an ARM Cortex-M

/*******************************************************************************
* Configuration Macro: TRC_CFG_HARDWARE_PORT
*
* Specify what hardware port to use (i.e., the "timestamping driver").
*
* All ARM Cortex-M MCUs are supported by "TRC_HARDWARE_PORT_ARM_Cortex_M".
* This port uses the DWT cycle counter for Cortex-M3/M4/M7 devices, which is
* available on most such devices. In case your device don't have DWT support,
* you will get an error message opening the trace. In that case, you may 
* force the recorder to use SysTick timestamping instead, using this define:
*
* #define TRC_CFG_ARM_CM_USE_SYSTICK
*
* For ARM Cortex-M0/M0+ devices, SysTick mode is used automatically.
*
* See trcHardwarePort.h for available ports and information on how to 
* define your own port, if not already present.
******************************************************************************/
//#define TRC_CFG_HARDWARE_PORT TRC_HARDWARE_PORT_NOT_SET
#define TRC_CFG_HARDWARE_PORT TRC_HARDWARE_PORT_ARM_Cortex_M

Now, you need to modify the project’s stack and heap size setup

PSoC Creator Project Configuration - Design Wide Resources

The default snapshot buffer is to big to fit into PSoC SRAM, so I change the size to 400 records

/*******************************************************************************
* TRC_CFG_EVENT_BUFFER_SIZE
*
* Macro which should be defined as an integer value.
*
* This defines the capacity of the event buffer, i.e., the number of records
* it may store. Most events use one record (4 byte), although some events 
* require multiple 4-byte records. You should adjust this to the amount of RAM
* available in the target system.
* 
* Default value is 1000, which means that 4000 bytes is allocated for the
* event buffer.
******************************************************************************/
#define TRC_CFG_EVENT_BUFFER_SIZE 400

Finally modify main to start the Trace Recorder (vTraceEnable on line 40)

int main(void)
{
CyGlobalIntEnable; /* Enable global interrupts. */
setupFreeRTOS();
vTraceEnable(TRC_START);
/* Create LED task, which will blink the RED LED */
xTaskCreate(
LED_Task,       /* Task function */
"LED Blink",    /* Task name (string) */
200,            /* Task stack, allocated from heap */
0,              /* No param passed to task function */
1,              /* Low priority */
0 );            /* Not using the task handle */
vTaskStartScheduler();
while(1); // get rid of the stupid warning
}

Testing the Output

After all of the setup is done you can build and program the development kit.

PSoC Creator Program Project

Plug in the Segger J-Link

CY8CKIT-044 + JLINK

Start Tracealyzer then setup the J-Link (click on J-Link Settings…)

Percepio Tracelyzer

Select “Select Device…”

Percepio Tracelyzer - JLINK Settings

Filter the list to “cypress” then choose the “CY8C4247xxx” (which is the chip that is on the C8CKIT-044)

Percepio Tracelyzer - JLINK Settings Select Device

Then Select “Jink->Read Trace”

Percepio Tracelyzer - Read Trace

Accept the defaults (this window only is only brought up the first time)

Percepio Tracelyzer - JLINK Memory Region

Then you will end up with a screen like this.  Each stripe of white/gray is 1 second in time.  The yellow line is where the startup occurred.  The red lines are where the “LED Blink” task was running.  This seems to make sense as you get a tiny red line 2x/second (remember in the source code we have a 500ms delay so that makes sense).

Percepio Tracelyzer - Console

Next I press the reset button on the devkit and re-run the trace.  Then I click on the second red line and the window on the right gives me information about that task.  You can see that the task ran for 53uS and took 23uS to start (time taken up in the FreeRTOS scheduler and Percepio Tracealyzer Recorder Library)

Percepio Tracelyzer - Console

Conclusion

Obviously the snapshot mode is limited by the size of the RAM buffer that you allocate but it saves you the hardware resources and timing constraints that are required to stream FreeRTOS data.  In the next several articles I will show you how to:

  • Use Segger JLINK RTT streaming
  • Make a streaming port
  • Use some of the other screens in the Percepio Tracealyzer

As always you can find all of these projects on the IotExpert GitHub site or git@github.com:iotexpert/PSoC-Tracelyzer.git

Article Description
Percepio Tracealyzer & PSoC An Introduction to Percepio Tracealyzer on the Cypress PSoC
Percepio Tracealyzer RTT Streamport - PSoC4200M Make the JLINK RTT Library work with Tracealyzer
Percepio Tracealyzer PSoC UART Streamport Creating a UART Streamport
Percepio Tracealyzer - Analyzing the PSoC Tracealyzer Streamport Figure out what is broken in the UART Streamport
Percepio Tracealyzer - Using PSoC DMA to Fix the UART Streamport Implementing PSoC DMA to improve the CPU Utilization
Percepio Tracealyzer - Running on PSoC6 Porting the Percepio Tracealyzer to PSoC6