In the previous Elkhorn Creek posts I discussed the overall system architecture, the design of the Creek Board, and the design of CYPI. In this post I will focus on the software that is running on the Raspberry PI. The software is divided into two main pieces.
- The Backend Server
- The Java Server Pages GUI
For this application, most of the software on the Raspberry Pi is written in Java. In someways this was a strange choice, but I work with a group of guys who are Java programmers and build lots of web based Java applications, so Java it is.
Backend Server
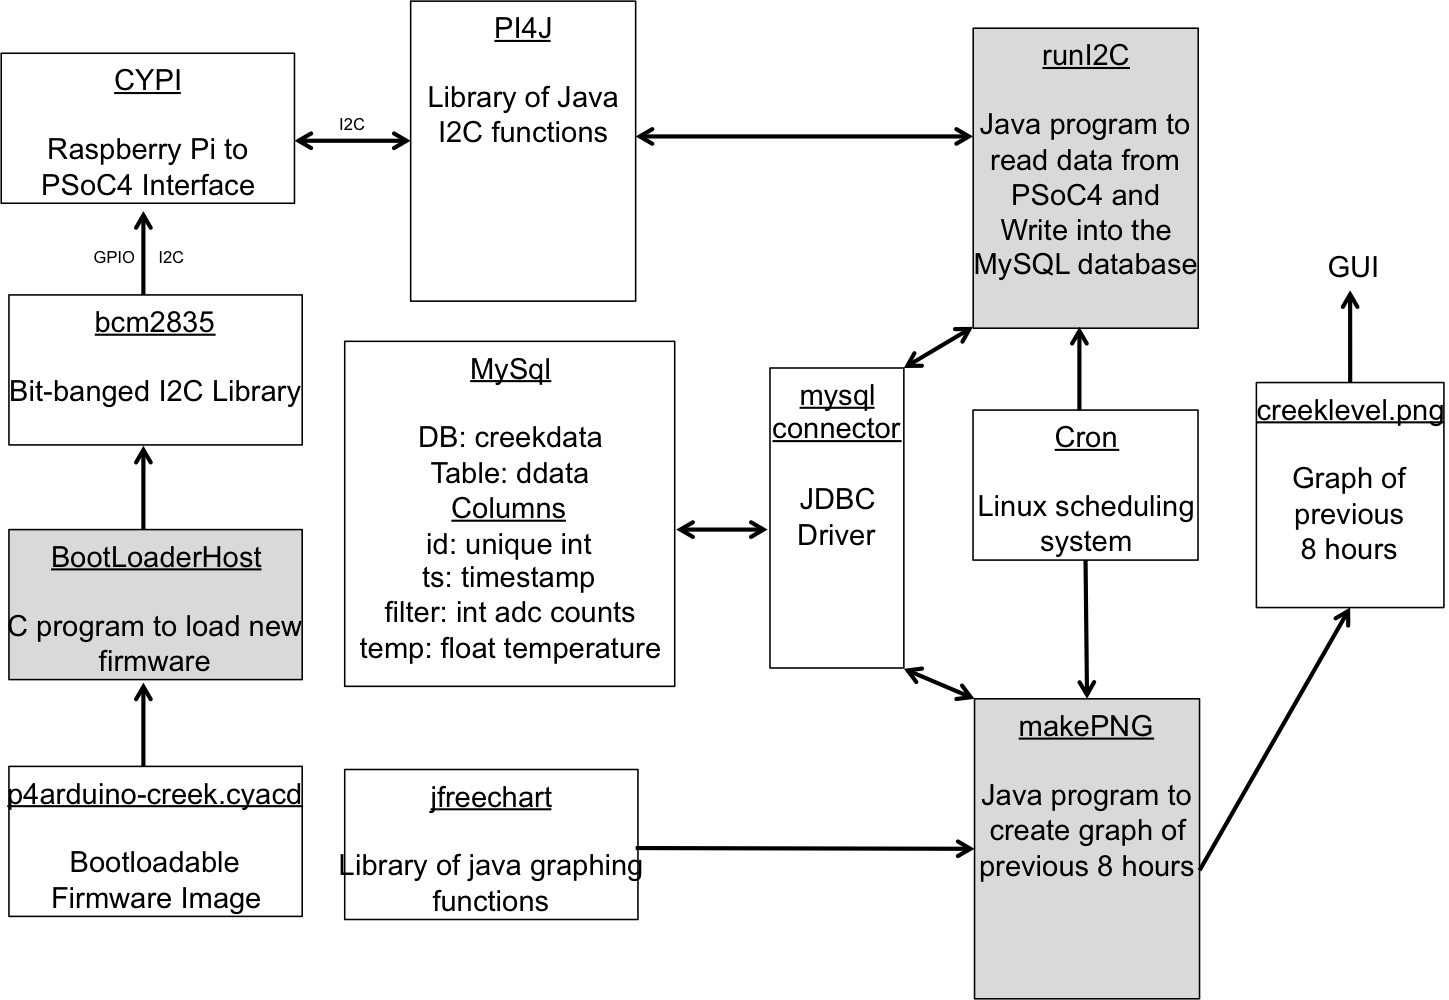
The Backend Server performs the following jobs
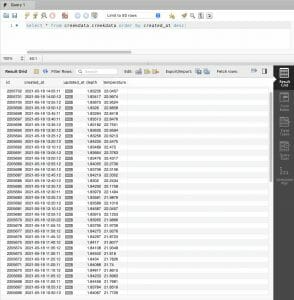
- Collects data from the PSoC4 via an I2C Master that resides in the Raspberry Pi and stores it into a MySQL Database
- Once every 5 minutes creates a chart of the last 8 hours and stores it into a PNG which can be served by the Tomcat GUI
- Bootload new firmware into the PSoC4
The first two jobs are run by “Cron” which is a unix utility to trigger jobs automatically. The cron table on the RPi looks like this:
# m h dom mon dow command
* * * * * /home/pi/getCreek/runi2c
0,5,10,15,20,25,30,35,40,45,50,55 * * * * /home/pi/getCreek/makePNG
The BootloaderHost is triggered via the command line only after new firmware is sent to the RPi.
In future posts I will discuss
- The BootloaderHost and the BCM2835 library
- runI2C, the JDBC driver and the PI4J library
- makePNG including JFreeChart
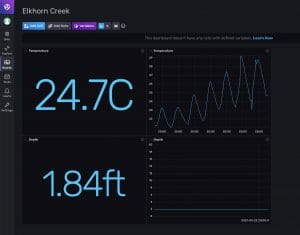
Java Server Pages (JSP) GUI
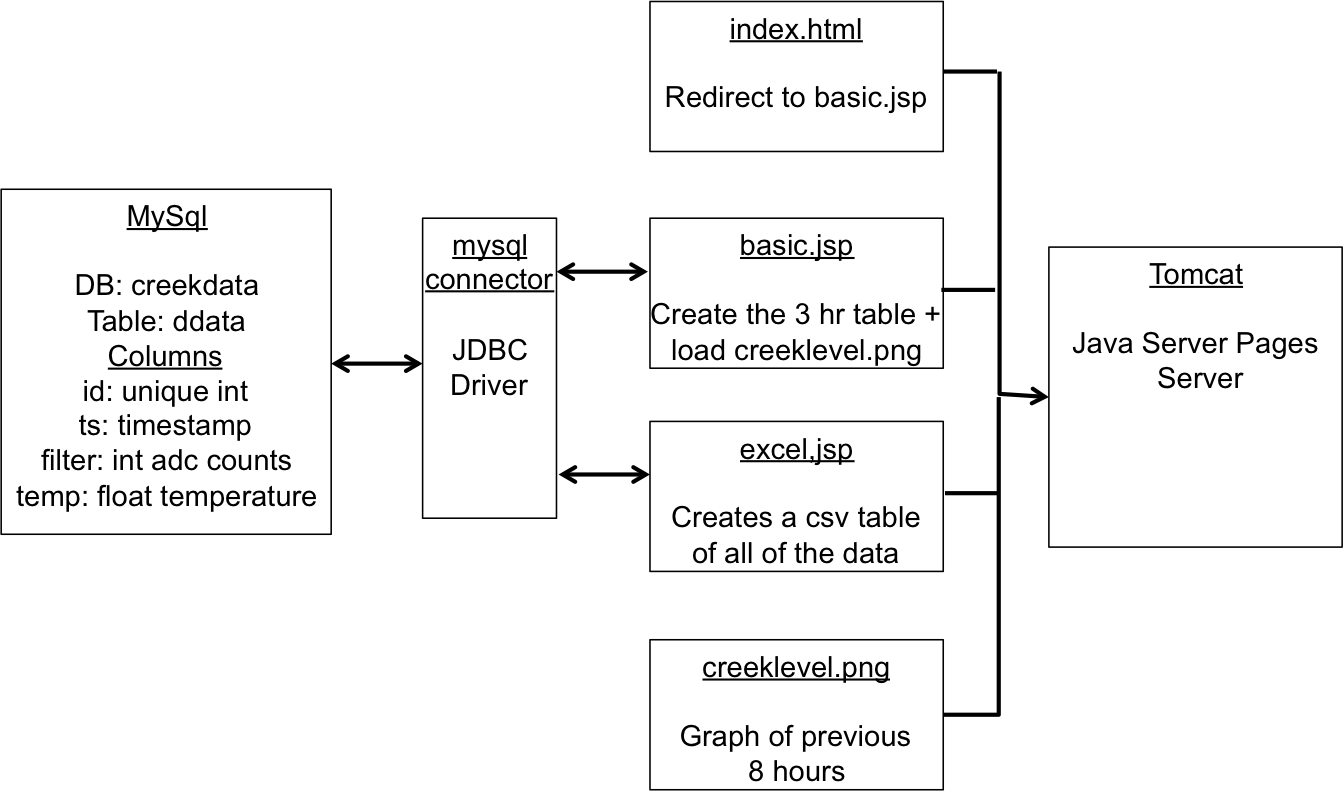
The user GUI for this system is a webpage that is served by the RPi. I use the Tomcat Java Server Pages Server. The JSP page “basic.jsp” creates the table of numbers and loads the graph. The JSP page “excel.jsp” create a CSV dump of all of the data in the database. The JSP programs are connected to MySQL a JDBC driver provided by Oracle. In future posts I will discuss:
- The Tomcat installation and configuration
- The MySQL installation and configuration
- basic.jsp and excel.jsp
Index
Description
The Creek: IOT for the Elkhorn Creek
Introduction
The Creek: Solution Architecture 1.0
Overall architecture
The Creek: Creek Board 1.1
Eagle layout of the board
The Creek: Creek Board 1.0 – RCCA
A discussion of the errors in the 1.0 board
The Creek: CYPI, a Raspberry Pi to Arduino Bridge
PSoC4 <--> Raspberry Pi Bridge Board
The Creek: PSoC4 Creator Schematic and Firmware
Firmware to interface with the temperature and pressure sensors
The Creek: Testing the Firmware
Using tools to verify that the PSoC 4 Firmware is working correctly
The Creek: Testing the Bootloader
Make sure that you can load new firmware into the PSoC
The Creek: Software Architecture
All of the Raspberry Pi software connections
The Creek: Install MySql
Instruction to configure MySql
The Creek: Install Tomcat
Instruction to configure Tomcat JSP Server
The Creek: Data Collection Java (Part 1)
The Java program that reads the I2C and saves it in the database
The Creek: Data Collection Java (Part 2)
The Java program that reads the I2C and saves it in the database
The Creek: Create the Chart with JFreeChart
Using open source Java charting software to create plots of the Creek Depth
The Creek: Flood Event Data Processor
A batch program to create analyze the database and create a table of flood events
The Creek: Flood Event Web Page
A batch program to create the flood event web page
The Creek: Creek Server 1.1
Updates to all of the back off server programs to integrate charts
The Creek: JSP Web Page for www.elkhorn-creek.org
The JSP program to make the table and display the website
The Creek: Raspberry Pi Clock Stretching
Sorting out a bug in the system having to do with the Broadcomm Raspberry Pi Master not functioning well with clock stretching
The Creek: Creek Server 1.2
Caching the web pages to make them faster

No comment yet, add your voice below!