AnyCloud Bluetooth Advertising Scanner (Part 1)

Summary

The first of several articles discussing the use of the AnyCloud BLE Stack to build advertising scanner/observers.

Story

A few summers ago while I was writing the WICED Bluetooth Academy book, I created a WICED based BLE advertising scanner.  Actually, I created a framework for the scanner and the remarkable summer intern I had finished the work.  That project has been sitting in the source code repository for the Bluetooth class, mostly only shown to face-to-face students.  This scanner is built using some of the original code combined with the new AnyCloud Bluetooth SDK.  It will act sort-of-like LightBlue or one of the other Bluetooth advertising scanners you might run on your phone, but with a serial console.

Sometime in the last few months we released the Bluetooth SDK for AnyCloud (things have been crazy and I have lost track of time)  This SDK has all of the stuff needed to add Bluetooth to your AnyCloud project using one of the Cypress Bluetooth/WiFi combo chips.  I had not had a chance to try it out, so I decided to build a Bluetooth project and then port the scanning code.

There are

Article Topic
AnyCloud Bluetooth Advertising Scanner (Part 1) Introduction to AnyCloud Bluetooth Advertising
AnyCloud Bluetooth Advertising Scanner (Part 2) Creating an AnyCloud Bluetooth project
AnyCloud Bluetooth Advertising Scanner (Part 3) Adding Observing functionality to the project
AnyCloud Bluetooth Utilities Library A set of APIs for enhancement of the AnyCloud Library
AnyCloud Bluetooth Advertising Scanner (Part 4) Adding a command line to the scanner
AnyCloud Bluetooth Advertising Scanner (Part 5) Adding a history database to the scanner
AnyCloud Bluetooth Advertising Scanner (Part 6) Decoding advertising packets
AnyCloud Bluetooth Advertising Scanner (Part 7) Adding recording commands to the command line
AnyCloud Bluetooth Advertising Scanner (Part 8) Adding filtering to the scanner
AnyCloud Bluetooth Advertising Scanner (Part 9) Improve the print and add packet age
AnyCloud Bluetooth Advertising Scanner (Part 10) Sort the database

All of the code can be found at git@github.com:iotexpert/AnyCloudBLEScanner.git and https://github.com/iotexpert/AnyCloudBLEScanner.git

There are git tags in place starting at part 5 so that you can look at just that version of the code.  "git tag" to list the tags.  And "git checkout part6" to look at the part 6 version of the code.

You can also create a new project with this is a template if you have the IoT Expert Manifest Files installed

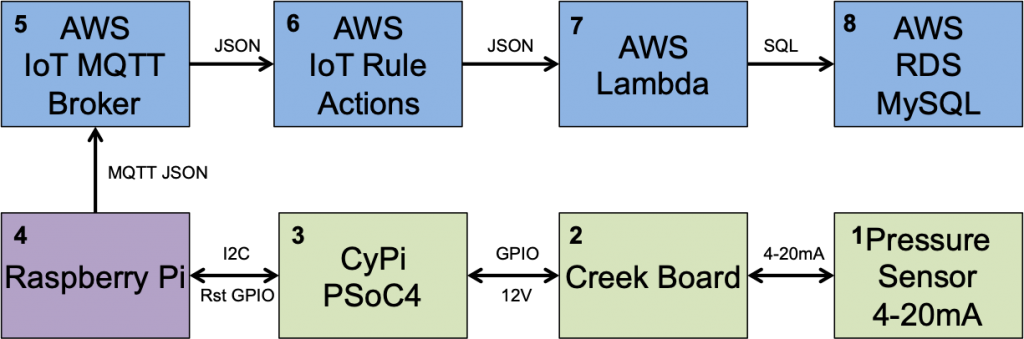
Bluetooth Application Architecture

Bluetooth applications are divided into these four pieces

  1. You user application which responds to events and sends messages from/to the Bluetooth host stack
  2. A Bluetooth Host Stack
  3. A Bluetooth Controller Stack
  4. The Bluetooth Radio

These four pieces can be divided into multiple chips, as few as one or as many as four.  However, for this article, the project will be built to run on a PSoC 6 + CYW43012 WiFi/Bluetooth Combo chip.  Specifically:

  1. My scanner application running on the PSoC 6
  2. The Bluetooth Host Stack running on the PSoC 6
  3. The BlueTooth Controller Firmware running on the CYW43012
  4. A Bluetooth Radio on the CYW43012

But how do they talk?  Simple, there is:

  1. A UART Host Controller Interface (HCI) between the two chips
  2. A GPIO to serve as a deep sleep wakeup from the 43012 –> PSoC 6
  3. A GPIO to serve as the bluetooth controller wakeup from the PSoC 6 –> 43012
  4. A GPIO to turn on the Bluetooth regulator from the PSoC 6 –> 43012

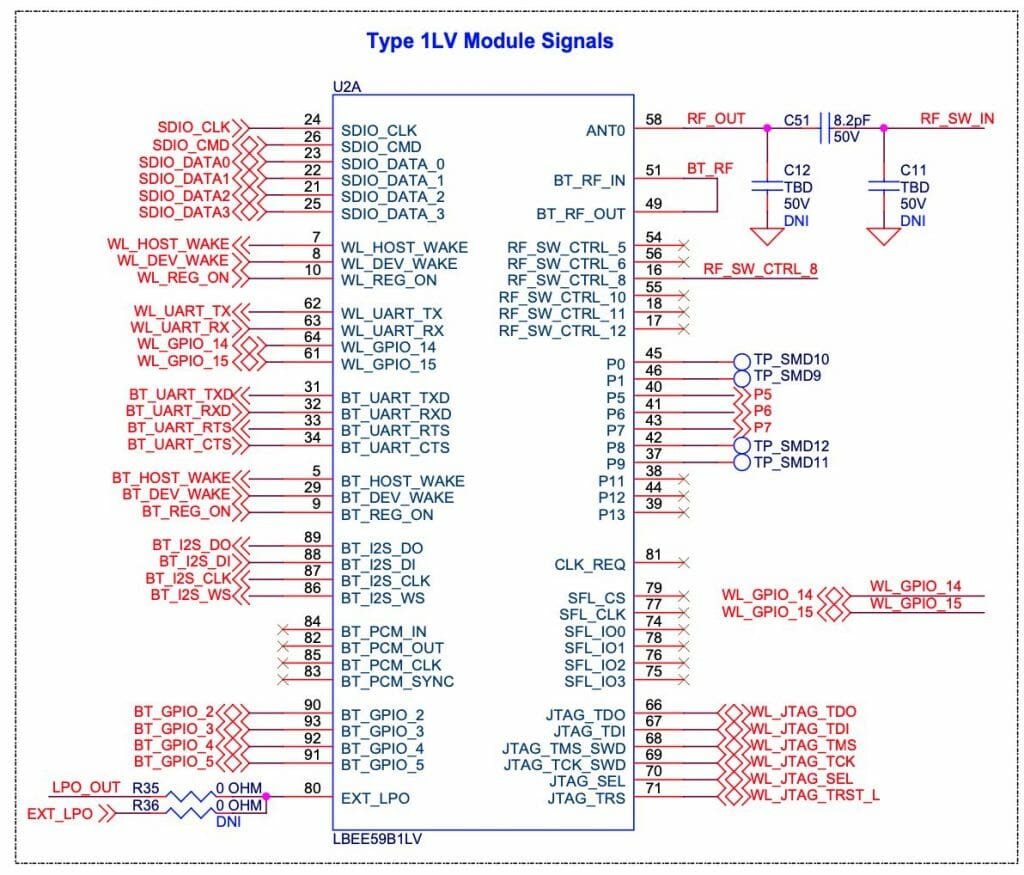
Here is the block diagram from the CY8CKIT-062S2-43012 Kit Guide.  Notice that signals labeled UART and Control going between the PSoC 6 and the CYW43012.

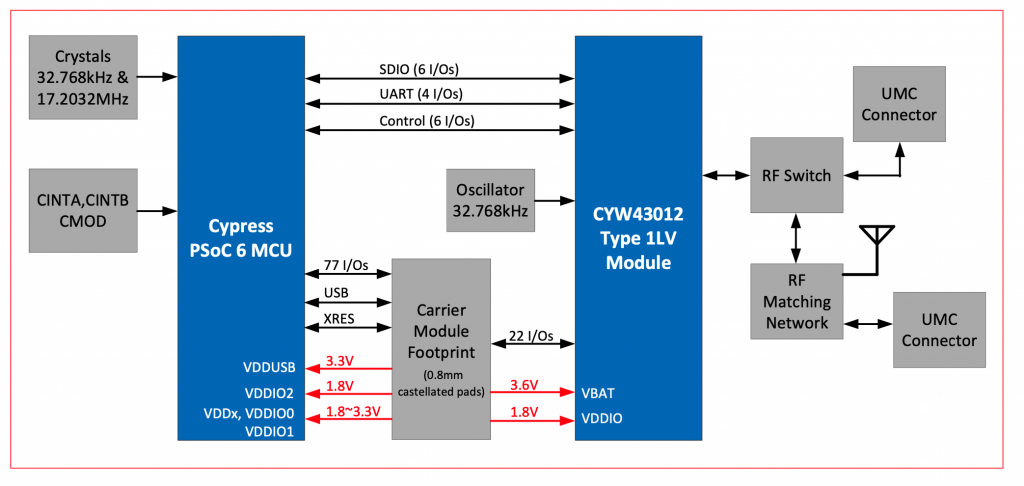
And when you read more deeply into the schematic you can see the signals labeled

  • BT_UART_TXD/RXD/CTS/RTS
  • BT_HOST_WAKE
  • BT_DEV_WAKE
  • BT_REG_ON

How to Start the AnyCloud Bluetooth Stack

To actually start the AnyCloud Bluetooth stack you will call two functions

  1. cybt_platform_config_init – that will setup the hardware interface to the CYW43012
  2. wiced_bt_stack_init that will:
    1. Start a task to manage the Host Controller Interface
    2. Download the controller firmware to the CYW43012
    3. Start a task to manage the host stack
    4. Initialize both the host and the controller
    5. Call you back when that is all done

Here is an example from main.

    cybt_platform_config_init(&bt_platform_cfg_settings);
    wiced_bt_stack_init (app_bt_management_callback, &wiced_bt_cfg_settings);

When you look at these two function calls, you will find that you need to provide three things:

  1. A platform hardware configuration structure called bt_platform_cfg_settings
  2. The Bluetooth stack configuration settings structure called wiced_bt_cfg_settings
  3. A management callback called app_bt_management_callback

bt_platform_cfg_settings

The purpose of the hardware configuration structure is to define the UART + parameters and the wakeup GPIOs.  Specifically, the hardware configuration structure defines the configuration of the host controller interface (hci)

  1. The HCI transport scheme (in this case UART)
  2. The pins of the UART
  3. Baud Rate
  4. Data Bits
  5. Stop Bits
  6. Parity
  7. Flow Control

And the controller low power behavior (in the .controller_config member)

This is a fairly standard configuration and I think that we should help you by providing this structure somewhere in the BSP.  But for now, you need to provide it (in an upcoming article I’ll update the IoT Expert Bluetooth Library to provide it).  Here is the specific structure that I will be using.

const cybt_platform_config_t bt_platform_cfg_settings =
{
    .hci_config =
    {
        .hci_transport = CYBT_HCI_UART,

        .hci =
        {
            .hci_uart =
            {
                .uart_tx_pin = CYBSP_BT_UART_TX,
                .uart_rx_pin = CYBSP_BT_UART_RX,
                .uart_rts_pin = CYBSP_BT_UART_RTS,
                .uart_cts_pin = CYBSP_BT_UART_CTS,

                .baud_rate_for_fw_download = 115200,
                .baud_rate_for_feature     = 115200,

                .data_bits = 8,
                .stop_bits = 1,
                .parity = CYHAL_UART_PARITY_NONE,
                .flow_control = WICED_TRUE
            }
        }
    },

    .controller_config =
    {
        .bt_power_pin      = CYBSP_BT_POWER,
        .sleep_mode =
        {
            #if (bt_0_power_0_ENABLED == 1) /* BT Power control is enabled in the LPA */
            #if (CYCFG_BT_LP_ENABLED == 1) /* Low power is enabled in the LPA, use the LPA configuration */
            .sleep_mode_enabled = true,
            .device_wakeup_pin = CYCFG_BT_DEV_WAKE_GPIO,
            .host_wakeup_pin = CYCFG_BT_HOST_WAKE_GPIO,
            .device_wake_polarity = CYCFG_BT_DEV_WAKE_POLARITY,
            .host_wake_polarity = CYCFG_BT_HOST_WAKE_IRQ_EVENT
            #else /* Low power is disabled in the LPA, disable low power */
            .sleep_mode_enabled = false
            #endif
            #else /* BT Power control is disabled in the LPA – default to BSP low power configuration */
            .sleep_mode_enabled = true,
            .device_wakeup_pin = CYBSP_BT_DEVICE_WAKE,
            .host_wakeup_pin = CYBSP_BT_HOST_WAKE,
            .device_wake_polarity = CYBT_WAKE_ACTIVE_LOW,
            .host_wake_polarity = CYBT_WAKE_ACTIVE_LOW
            #endif
        }
    },

    .task_mem_pool_size    = 2048
};

wiced_bt_cfg_settings

The Cypress WICED Bluetooth Stack has a boatload of configuration settings.  When you call the stack start function you need to provide all of those settings in a structure of type “wiced_bt_cfg_settings_t” which is actually a structure of structures.  There are several basic ways to set these settings

  • Start from scratch and build you own settings
  • Copy from an example project
  • Use the Bluetooth Configurator to generate the structure

For the purposes of THIS project I started by copying the structure from on of the example projects and then modifying the three numbers that were relevant to me.  Specifically

  • max_simultanous_link – which I changed to 0 because this is simply a Bluetooth Observer
  • low_duty_scan_interval – how long in the window to listen for advertising packets
  • low_duty_scan_window – how wide the window of listening should be
const wiced_bt_cfg_settings_t wiced_bt_cfg_settings =
{
.device_name                         = (uint8_t *)BT_LOCAL_NAME,                                   /**< Local device name (NULL terminated) */
.device_class                        = {0x00, 0x00, 0x00},                                         /**< Local device class */
.security_requirement_mask           = BTM_SEC_NONE,                                               /**< Security requirements mask (BTM_SEC_NONE, or combinination of BTM_SEC_IN_AUTHENTICATE, BTM_SEC_OUT_AUTHENTICATE, BTM_SEC_ENCRYPT (see #wiced_bt_sec_level_e)) */
.max_simultaneous_links              = 0,                                                          /**< Maximum number simultaneous links to different devices */
.ble_scan_cfg =                                                 /* BLE scan settings  */
{
.scan_mode                       = BTM_BLE_SCAN_MODE_PASSIVE,                                  /**< BLE scan mode (BTM_BLE_SCAN_MODE_PASSIVE, BTM_BLE_SCAN_MODE_ACTIVE, or BTM_BLE_SCAN_MODE_NONE) */
/* Advertisement scan configuration */
.high_duty_scan_interval         = WICED_BT_CFG_DEFAULT_HIGH_DUTY_SCAN_INTERVAL,               /**< High duty scan interval */
.high_duty_scan_window           = WICED_BT_CFG_DEFAULT_HIGH_DUTY_SCAN_WINDOW,                 /**< High duty scan window */
.high_duty_scan_duration         = 0,                                                          /**< High duty scan duration in seconds (0 for infinite) */
.low_duty_scan_interval          = 96,                                                         /**< Low duty scan interval  */
.low_duty_scan_window            = 96,                                                         /**< Low duty scan window */
.low_duty_scan_duration          = 0,                                                          /**< Low duty scan duration in seconds (0 for infinite) */
/* Connection scan configuration */
.high_duty_conn_scan_interval    = WICED_BT_CFG_DEFAULT_HIGH_DUTY_CONN_SCAN_INTERVAL,          /**< High duty cycle connection scan interval */
.high_duty_conn_scan_window      = WICED_BT_CFG_DEFAULT_HIGH_DUTY_CONN_SCAN_WINDOW,            /**< High duty cycle connection scan window */
.high_duty_conn_duration         = 0,                                                         /**< High duty cycle connection duration in seconds (0 for infinite) */
.low_duty_conn_scan_interval     = WICED_BT_CFG_DEFAULT_LOW_DUTY_CONN_SCAN_INTERVAL,           /**< Low duty cycle connection scan interval */
.low_duty_conn_scan_window       = WICED_BT_CFG_DEFAULT_LOW_DUTY_CONN_SCAN_WINDOW,             /**< Low duty cycle connection scan window */
.low_duty_conn_duration          = 0,                                                         /**< Low duty cycle connection duration in seconds (0 for infinite) */
/* Connection configuration */
.conn_min_interval               = WICED_BT_CFG_DEFAULT_CONN_MIN_INTERVAL,                     /**< Minimum connection interval */
.conn_max_interval               = WICED_BT_CFG_DEFAULT_CONN_MAX_INTERVAL,                     /**< Maximum connection interval */
.conn_latency                    = WICED_BT_CFG_DEFAULT_CONN_LATENCY,                          /**< Connection latency */
.conn_supervision_timeout        = WICED_BT_CFG_DEFAULT_CONN_SUPERVISION_TIMEOUT,              /**< Connection link supervision timeout */
},
.default_ble_power_level            = 12                                                           /**< Default LE power level, Refer lm_TxPwrTable table for the power range */
};

app_bt_management_callback

The last thing that you need to provide is a management callback.  This function is called by the Bluetooth Stack when a “management event” occurs.  There is a big-long-list of enumerated events of type wiced_bt_management_event_t.  The events include things like the the stack started “BTM_ENABLED_EVENT”.  Each event may have data associated with the event which is passed to you in a pointer to wiced_bt_management_event_data_t.

You typically deal with these events with a giant switch statement like this:

wiced_result_t app_bt_management_callback(wiced_bt_management_evt_t event, wiced_bt_management_evt_data_t *p_event_data)
{
wiced_result_t result = WICED_BT_SUCCESS;
switch (event)
{
case BTM_ENABLED_EVT:
if (WICED_BT_SUCCESS == p_event_data->enabled.status)
{
printf("Stack Started Successfully\n");
}
break;
default:
printf("Unhandled Bluetooth Management Event: 0x%x %s\n", event, btutil_getBTEventName(event));
break;
}
return result;
}

Tasks

The Bluetooth stack on the PSoC6 is operated with two tasks.  Specifically, when you call the wiced_bt_stack_init it will startup:

  1. CYBT_HCI_Task – a task that sends and receives HCI packets going to the Radio chip
  2. CY_BT_Task – a task that manages the Bluetooth Host Stack

Here is print of the task list from my project:

AnyCloud> tasks
Name          State Priority   Stack  Num
------------------------------------------
nt shell        X       0       236     5
IDLE            R       0       115     6
blink           B       0       98      4
CYBT_BT_Task    B       4       1371    2
sleep_task      B       6       217     1
CYBT_HCI_Task   B       5       950     3
Tmr Svc         B       6       76      7
‘B’ – Blocked
‘R’ – Ready
‘D’ – Deleted (waiting clean up)
‘S’ – Suspended, or Blocked without a timeout
Stack = bytes free at highwater


Now with the background in place, in the next article I will discuss Bluetooth advertising and how to build the observer project.

Calibration in a Storm

Summary

A description of an analytic model to adjust pressure sensor depth data to reflect measured data.

Story

About a year ago I repaired my Creek Water Level sensing system.  At that time I installed a new pressure sensor into the system (which had been blown up).  When I did the surgery I did not have data to recalibrate the system.  All along I knew that the system was reading low by about 1 foot or so.  I am  in America, I do Imperial measurement 🙂  But I didn’t really know exactly how much.  I also knew that my original calculate used 0.53ft/psi as the conversion to depth.  This is only true with pure water at about 80 degrees F which meant that it was something else for muddy creek water.

Well on Wednesday last week I had a flood.  So I got the opportunity to collect some real data on the conversion

Old School Measurement

A couple of years ago a friend an I went out with a site level and measure a bunch of marker points, including the base of this treehouse which I know is 12.6 feet over the normal creek level.  When I woke up and saw that the flood was going strong I went out with a long ruler and screwed it into the post holding up the birdhouse.

Here is how it looks close up.

Collect the Data

Unfortunately as the water went higher and higher the only way to collect the data was with a pair of (bad-ass) binoculars.

Over the course of the flood, my children and I would occasionally go out and collect the data.

The next morning I did two things.

  1. Entered the data into a table.
  2. Used mysql to look up the sensor readings at the same time we took the measurement.

Here is the data:

Time Ruler Ruler + BH Sensor Measure
8:15 5 23 13.0 14.6
8:52 7 25 13.4 14.8
9:34 10 28 13.3 15.0
10:17 12 30 13.5 15.2
10:46 13 31 13.6 15.3
12:54 18 36 14.0 15.7
13:43 21 39 14.2 16.0
15:00 26 44 14.7 16.4
16:18 30 48 15.0 16.7
17:50 33 51 15.2 17.0
7:55 15 33 13.8 15.5

Analyze the Data

The next step was to analyze the data.  So, I created an x-y plot.  Notice the red datapoint almost certainly was read in error.  The dotted line is an excel created least squares fit of the data.

When I remove the red dot I get a correlation coefficient of 0.9951 … that is money in my business.

Now when I create column the new model you can see that all of the datapoints are within 1%.

Time Ruler Ruler + BH Sensor Measure Model Error RMS
8:15 5 23 13.0 14.6 14.7 0.8%             0.0
8:52 7 25 13.4 15.1
9:34 10 28 13.3 15.0 15.0 -0.3%             0.0
10:17 12 30 13.5 15.2 15.2 -0.2%             0.0
10:46 13 31 13.6 15.3 15.3 -0.1%             0.0
12:54 18 36 14.0 15.7 15.7 -0.2%             0.0
13:43 21 39 14.2 16.0 15.9 -0.5%             0.0
15:00 26 44 14.7 16.4 16.4 0.36%             0.0
16:18 30 48 15.0 16.7 16.7 0.10%             0.0
17:50 33 51 15.2 17.0 17.0 0.02%             0.0
7:55 15 33 13.8 15.5 15.5 0.1%             0.0
0.011

Here is a plot of the error:

Fix the Firmware

The next step is to update the firmware on sensor system.  The comment on line 56 of the code “USC correction model” means that I talked with the guy in charge of transistor device modeling at Infineon/Cypress.  He suggested some improvements from my original analysis.

dp.pressureCounts = adc_GetResult16(PRESSURE_CHAN);
// 408 is the baseline 0 with no pressure = 51.1ohm * 4ma * 2mv/count
// 3.906311 is the conversion to ft
// Whole range in counts = (20mA - 4mA)* 51.1 ohm * 2 mv/count = 1635.2 counts
// Range in Feet = 15PSI / 0.42PSI/Ft = 34.88 Ft
// Count/Ft = 1635.2 / 34.88 = 46.8807 Counts/Ft 
float depth =( ((float)dp.pressureCounts)-408)/46.8807;
// Apply the USC correction model
depth = 1.0106 * depth + 1.5589;
dp.depth = ( depth + 7*previousDepth ) / 8.0;  // IIR Filter

The last thing to do is fix all of the old data in my database.  So I use mysql to update all of the datapoint with the adjusted values since I installed the new sensor.

update creekdata set depth=depth*1.016 + 1.5589 where id>=1749037 AND id<= 1981538;

This morning while I was doing the updates the creek started flooding again.  Here is the plot where you can see the offset being applied.

And with the offset applied, things are “more better” as my mom would say.


The Creek 2.0: AWS IoT Actions & Rules

Summary

In this article, I will show you how to use the AWS IoT rules engine to make the last connection required in the chain of data from the Creek Sensor all the way to the AWS RDS Server.  I will also show you the AWS CloudWatch console.  At this point I have implemented

Let’s implement the final missing box (6) – The AWS IoT Rules

The AWS Rules

Start by going to the AWS IoT Console.  On the bottom left you can see a button named “Act”.  If you click Act…

You will land on a screen that looks like this.  Notice, that I have no rules (something that my wife complains about all of the time).  Click on “Create” to start the process of making a rule.

On the create rule screen I will give it a name and a description.  Then, I need to create a “Rule query statement“.  A rule query statement is an SQL like command that is used to match topics and conditions of the data on the topic.  Below, you can see that I tell it to select “*” which is all of the attributes.  And then I give it the name of the topic.  Notice that you are allowed to use the normal MQTT topic wildcards # and + to expand the list to match multiple topics.

Scroll down to the “Set one or more actions” and click on “add action”

This screen is amazing as there are many many many things that you can do.  (I should try some of the others possibilities).  But, for this article just pick “Send a message to a Lambda function”

Then press “Select” to pick out the function.

Then you will see all of your Lambda functions.  Ill pick the “creekWaterLevelInsert” which is the function I created which takes the json data and inserts it into my AWS RDS MySQL database.

Once you press “Update”, you will see that you have the newly created rule…

The Test Console

Now that the rule is setup.  Let’s go to the AWS MQTT Test Client and wait for an update to the “applecreek”  thing Shadow.  You might recall that when a shadow update message is published to $aws/things/applecreek/shadow/update if that message is accepted then a response will be published by AWS to $aws/things/applecreek/shawdow/update/accepted.

On the test console, I subscribe to that topic.  After a bit of time I see this message get published that at 7:06AM the Apple Creek is 0.08.. feet and the temperature in my barn is 14.889 degrees.

But, did it work?

 AWS Cloud Watch

There are a couple of ways to figure this out.  But, I start by going to AWS CloudWatch which is the AWS consolidator for all of the error logs etc.  To get there search for “CloudWatch” on the AWS Management Console.

Then click on “logs”.  Notice that the log at the top is called “…/creekWaterLevelInsert”.   As best I can tell, many things in AWS generate debugging or security messages which go to these log files.

If you click on the /aws/lambda/creekWaterLevelInsert you can see that there are a bunch of different log streams for this Lambda Function.  These streams are just ranges of time where events have happened (I have actually been running this rule for  a while)

If I click on the top one, and scroll to the bottom you can see that at “11:06:23” the function was run.  And you can see the JSON message which was sent to the function.  You might ask yourself 11:06 … up above it was 7:06… why the 4 hours difference.  The answer to that question is that the AWS logs are all recorded in UTC… but I save my messages in Eastern time which is  current UTC-4.  (In hindsight I think that you should record all time in UTC)

The real way to check to make sure that the lambda function worked correctly is to verify that the data was inserted into my RDS MySQL database.  To find this out I open up a connection using MySQL WorkBench (which I wrote about here).  I ask it to give me the most recent data inserted into the database and sure enough I can see that at 7:06 the temperature was 14.9 and the depth was 0.08… sweet.

For now this series is over.  However, what I really need to do next is write a web server that runs on AWS to display the data… but that will be for another day.

The Creek 2.0: AWS Lambda Function

Summary

At this point in the Creek 2.0 series I have data that is moving from my sensor into the AWS IoT core via MQTT.  I also have a VPC with an AWS RDS MySQL database running.  In order to get the data from the AWS IoT Device Shadow into the database, I am left with a two remaining steps:

  1. Create a Lambda Function which can run when asked and store data into the Database (this article)
  2. Connect the IoT MQTT Message Broker to the Lambda Function (the next article)

This article addresses the Lambda Function, which unfortunately is best written in Python.  I say ‘unfortunately’ because I’ve always had enough self-respect to avoid programing in Python – that evil witch’s brew of a hacker language.  🙂  But more seriously, I have never written a line of code in Python so it has been a bit of a journey.  As a side note, I am also interested in Machine Learning and the Google TensorFlow is Python driven, so all is not lost.

For this article, I will address:

  1. What is an AWS Lambda Function?
  2. Create a Lambda Function
  3. Run a Simple Test
  4. Install the Python Libraries (Deployment Package)
  5. Create a MySQL Connection and Test
  6. Configure the Lambda Function to Run in your VPC
  7. Create an IAM Role and Assign to the Lambda Function
  8. Update the Lambda Function to Insert Data
  9. The Whole Program

What is an AWS Lambda Function?

AWS Lambda is a place in the AWS Cloud where you can store a program, called a Lambda Function.  The name came from the “anonymous” function paradigm which is also called a lambda function in some languages (lisp was the first place I used it).  The program can then be triggered to run by a bunch of different things including the AWS IoT MQTT Broker.  The cool part is that you don’t have to manage a server because it is magically created for you on demand.   You tell AWS what kind of environment you want (Python, Go, Javascript etc), then AWS automatically creates that environment and runs your Lambda function on demand.

In this case, we will trigger the lambda function when the AWS IoT Message Broker accepts a change to the Device Shadow.  I suppose that the easiest way to understand is to actually build a Lambda Function.

Create a Lambda Function

To create a Lambda function you will need to go to the Lambda management console.  To get there, start on the AWS Management console and search for “lambda”

On the Lambda console, click “Functions” then “Create function”

We will build this function from scratch… oh the adventure.  Give the function a name, in this case “exampleInsertData”.  Finally, select the Runtime.  You have several choices including “Python 3.7” which I suppose was the lesser of evils.

Once you click “Create function” you will magically arrive at this screen where you can get to work.  Notice that the AWS folks give you a nice starter function.

Run a Simple Test

Now the we have a simple function let us run a simple test – simple, eh?  To do this, click on the drop down arrow where it says “Select a test event” and then pick out “Configure test events”

On the configure test event screen,  just give your event the name “testEvent1” and click “Create”

Now you can select “testEvent1” and then click “Test”

This will take the JSON message that you defined above (actually you let it be default) and send it into the Lambda program.  The console will show you the output of the whole mess in the “Execution result: …”  Press the little “Details arrow” to see everything.  Notice that the default function sends a JSON keymap with two keys.

  • statusCode
  • body

When you function runs, an object is created inside of your Python program called “event” that is the JSON object that was sent to the Lambda function.  When we created the testEvent1 it gave us the option to specify the JSON object which is used as the argument to the function.  The default was a keymap with three keys key1,key2 and key3.

{
"key1": "value1",
"key2": "value2",
"key3": "value3"
}

Instead of having the function return “Hello from Lambda” lets have it return the value that goes with “key1”.  To do that, make a little modification to the function to “json.dumps(event[‘key1’])”.  Now when you run the test you can see that it returns the “body” as “value1”.

Install Python Libraries

The default installation of Python 3.7 in Lambda does not have two libraries that I want to use.  Specifically:

  • pymysql – a MySQL database interface
  • pytz – a library for manipulating time (unfortunately it can’t create more time)

I actually don’t know what libraries are in the default Python3.7 runtime (or actually even how to figure it out?).  In order to use libraries which are not part of the Python installation by default, you need to create a “Python Deployment Package“.  If you google this problem, you will find an amazing amount of confusion on this topic.  The humorist XKCD drew a very appropriate cartoon about this topic.  (I think that I’m allowed to link it?  but if not I’m sorry and I’ll remove it)

Making a deployment package is actually pretty straightforward.  The steps are:

  1. Create a directory on your computer
  2. Use PIP3 to install the libraries you need in your LOCAL directory
  3. Zip it all up
  4. Upload the zip file to AWS Lambda

Here are the first three steps (notice that I use pip3)

To update your AWS Lambda function, select “Upload a .zip file” on the Function code drop down.

Then pick your zip file.

Now you need to press the “Save” button which will do the actual update.

After the upload happens you will get an error message like this.  The problem is that you don’t have a file called “lambda_function.py” and/or that file doesn’t have a function called “lamda.handler”.  AWS is right, we don’t have either of them.

But you can see that we now have the “package” directory with the stuff we need to attach to the MySQL database and to manipulate time.

The little box that says “handler” tells you that you need to have a file called “lamda_function.py” and that Python file needs to have a function called “lambda_handler”.  So let’s create that file and function.  Start with “File->New File”

The a “File->Save As…”

Give it the name “lambda_function.py”

Now write the same function as before.  Then press “save”.  You could have created the function and file on your computer and then uploaded it as part of the zip file, but I didn’t.

import json
def lambda_handler(event,context):
return {
'statusCode' : 200,
'body' : json.dumps(event['key1'])
}

OK.  Let’s test and make sure that everything is still working.  So run the “testEvent1″… and you should see that it returns the same thing.

The next step is to create and test a MySQL connection.

Create a MySQL Connection and Test

This simple bit of Python uses the “pymysql” library to open up a connection to the “rds_host” with the “name” and “password”.  Assuming this works, the program goes on and runs the lambda_hander.  Otherwise it spits out an error to the log and exits.

import json
import logging
from package import pymysql
#rds settings
rds_host  = "your database endpoint goes here.us-east-2.rds.amazonaws.com"
name = "your mysql user name"
password = "your mysql password "
db_name = "your database name"
logger = logging.getLogger()
logger.setLevel(logging.INFO)
try:
conn = pymysql.connect(rds_host, user=name, passwd=password, db=db_name, connect_timeout=5)
except:
logger.error("ERROR: Unexpected error: Could not connect to MySQL instance.")
sys.exit()
def lambda_handler(event,context):
return {
'statusCode' : 200,
'body' : json.dumps(event['key1'])
}

When I run the test, I get this message which took me a long time to figure out.  Like a stupidly long time.  In order to fix it, you need to configure the Lambda function to run in your VPC.

Configure the Lambda Function to Run in your VPC

The problem is that the AWS Lambda Functions runs on the public Internet which does not have access to your AWS RDS database which you might recalls is on a private subnet in my VPC.  To fix this, you need to tell AWS to run your function INSIDE of your VPC.  Scroll down to the network section.  See where it says “No VPC”

Pick out your VPC and then pick out two subnets in your VPC.  You probably should pick two subnets from different availability zones.  But it doesn’t matter if they are public or not as they only talk to the database.

After clicking save I get this message “Your role does not have VPC permissions”.  This took forever to figure out as well.  To fix this problem, you need to create the correct IAM role….

Create an IAM Role and Assign to the Lambda Function

To create the role, you need to get to the IAM console and the “roles” sub console.  There are several way to get to the screen to create the role.  But I do this by going to the AWS console, searching for IAM, and clicking.

This takes me to the IAM Console.  I don’t know that much about these options.  Actually looking at this screen shot it looks like I have some “Security status” issues (which I will need to figure out).  However in order to get the Lambda function to attach to your VPC, you need to create a role.  Do this by clicking “Roles”

When you click on roles you can see that there are several roles, essentially rules that give your identity the ability to do things in the AWS cloud.  There are some that are created by default.  But in order for your Lambda function to attach to your VPC, you need to give it permission.  To do this click “Create role”

Pick “AWS service” and “Lambda” then click Next: Permissions

Search for the “AWSLambdaVPCAccessExecutionRole”.  Pick it and then click Next: Tags

I don’t have any tags so click Next: Review

Give the role a name “exampleVpcExecution” then click Create role.

You should get a success message.

Now go back to the Lambda function configuration screen.  Move down to “Execution role” and pick out the role that you just created.

Now when I test things work…. now let’s fix up the function to actually do the work of inserting data.

Update the Lambda Function to Insert Data

You should recall from the article on AWS MQTT that when you update the IoT Device Shadow via MQTT you publish a JSON message like this to the topic “$aws/things/applecreek/shadow/update”

{
"state": {
"reported": {
"temperature": 37.39998245239258,
"depth": 0.036337487399578094,
"thing": "applecreek"
}
}
}

Which will cause the AWS IoT to update you device shadow and then publish a message to “$aws/things/applecreek/shadow/update/accepted” like this:

{
"state": {
"reported": {
"temperature": 37.39998245239258,
"depth": 0.036337487399578094,
"thing": "applecreek"
}
},
"metadata": {
"reported": {
"temperature": {
"timestamp": 1566144733
},
"depth": {
"timestamp": 1566144733
},
"thing": {
"timestamp": 1566144733
}
}
},
"version": 27323,
"timestamp": 1566144733
}

In the next article Im going to show you how to hook up those messages to run Lambda function.  But, for now assume that the JSON that comes out of the “…/accepted” topic will be passed to your function as the “event”.

The program has the following sections:

  1. Setup the imports
  2. Define some Configuration Variables
  3. Make a logger
  4. Make a connection to the RDS database
  5. Find the name of the thing in the JSON message
  6. Search for the thingId in the table creekdata.things
  7. Find the state key/value
  8. Find the reported key/value
  9. Find the depth key/value
  10. Find the temperature key/value
  11. Find the timestamp key/value
  12. Convert the UTC timestamp to Eastern Time (I should have long ago designed this differently)
  13. Insert the new data point into the Database

Setup the Imports

The logging import is used to write data to the AWS logging console.

The pymysql is a library that knows how to attach to MySQL databases.

I made the decision years ago to store time in eastern standard time in my database.  That turns out to have been a bad decision and I should have used UTC.  Oh well.  To remedy this problem I use the “pytz” to convert between UTC (what AWS uses) and EST (what my system uses)

import sys
sys.path.append("./package")
import logging
import pymysql
from pytz import timezone, common_timezones
import pytz
from datetime import datetime

Define Some Configuration Variables

Rather than hardcode the Keys in the JSON message, I setup a number of global variables to hold their definition.

stateKey ="state"
reportedKey = "reported"
depthKey = "depth"
temperatureKey = "temperature"
timeKey = "time"
deviceKey = "thing"
timeStampKey = "timestamp"

Make a connection to the RDS Database

In order to write data to my RDS MySQL database I create a connection using “pymysql.connect”.  Notice that if this fails it will write into the cloud watch log.  If it succeeds then there will be a global variable called “conn” with the connection object.

rds_host  = "creekdata.cycvrc9tai6g.us-east-2.rds.amazonaws.com"
name = "database user"
password = "databasepassword"
db_name = "creekdata"
try:
conn = pymysql.connect(rds_host, user=name, passwd=password, db=db_name, connect_timeout=5)
except:
logger.error("ERROR: Unexpected error: Could not connect to MySQL instance.")
sys.exit()

Make a logger

AWS gives you the ability to write to the AWS CloudWatch logging system.  In order to write there, you need to create a “logger”

logger = logging.getLogger()
logger.setLevel(logging.INFO)

Look for the stateKey and reportKey

The JSON message “should” have key called “state”.  The value of that key is another keymap with a value called “reported”

if stateKey in event:
if reportedKey in event[stateKey]:

Find the Depth

Assuming that you have state/reported then you need to find the value of the depth

if depthKey in event[stateKey][reportedKey]:
depthValue = event[stateKey][reportedKey][depthKey]

Find the Temperature

It was my intent to send the temperature every time I update the shadow state.  But I put in a provision for the temperature not being there and taking the value -99

if temperatureKey in event[stateKey][reportedKey]:
temperatureValue = event[stateKey][reportedKey][temperatureKey]
else:
temperatureValue = -99

Look for a Timestamp

My current sensor system does not keep time, however, I may add that functionality at some point.  So, I put in the ability to have a timeStamp set by the sensor.  If there is no timestamp there, AWS happily makes one for you when you update the device shadow.  I look in

  • The reported state
  • The overall message
  • Or I barf
if timeStampKey in event[stateKey][reportedKey]:
timeValue = datetime.fromtimestamp(event[stateKey][reportedKey][timeStampKey],tz=pytz.utc)
#                logger.info("Using state time")
elif timeStampKey in event:
#                logger.info("using timestamp" + str(event[timeStampKey]))
timeValue = datetime.fromtimestamp(event[timeStampKey],tz=pytz.utc)
else:
raise Exception("JSON Missing time date")

Find the name of the thing in the JSON message

My database has two tables.  The table called “creekdata” has columns of id, thingid, depth, temperature, created_at.  The thing id is key into another table called “things” which has the columns of thingid and name.  In other words, it has a map of a text name for things to a int value.  This lets me store multiple thing values in the same creekdata table… which turns out to be an overkill as I only have one sensor.

When I started working on this program I wanted the name of thing to be added automatically as part of the JSON message, but I couldn’t figure it out.  So, I added the thing name as a field which is put in by the sensor.

if deviceKey in event[stateKey][reportedKey]:
deviceValue = event[stateKey][reportedKey][deviceKey]
else:
logger.error("JSON Event missing " + deviceKey)
raise Exception("JSON Event missing " + deviceKey)

Search for the thingId in the table creekdata.things

I wrote a function which takes the name of a thing and returns the thingId.

def getThingId(deviceName):
with conn.cursor() as cur:
cur.execute("select thingid from creekdata.things where name=%s", deviceName)
results = cur.fetchall()
#    logger.info("Row = " + str(len(results)))
if len(results) > 0:
#        logger.info("thingid = "+ str(results[0][0]))
return results[0][0]
else:
raise Exception("Device Name Not Found " + deviceName)

Convert the UTC timestamp to Eastern Time

As I pointed out earlier, I should have switched the whole system to store UTC.  But no.  So I use the pytz function to switch my UTC value to EST.

  tz1 = pytz.timezone('US/Eastern')
xc = timeValue.astimezone(tz1)

Insert the New Data Point into the Database

Now we know everything, so insert it into the database.

with conn.cursor() as cur:
cur.execute("INSERT into creekdata.creekdata (created_at,depth, thingid,temperature) values (%s,%s,%s,%s)",(xc.strftime("%Y-%m-%d %H:%M:%S"),depthValue,thingIdValue,temperatureValue));
conn.commit()

The Final Program

Here is the whole program in one place.

import json
import sys
import logging
import os
sys.path.append("./package")
import pymysql
from pytz import timezone, common_timezones
import pytz
from datetime import datetime
stateKey ="state"
reportedKey = "reported"
depthKey = "depth"
temperatureKey = "temperature"
timeKey = "time"
deviceKey = "thing"
timeStampKey = "timestamp"
#rds settings
rds_host  = "put your endpoint here.us-east-2.rds.amazonaws.com"
name = "mysecretuser"
password = "mysecretpassword"
db_name = "creekdata"
logger = logging.getLogger()
logger.setLevel(logging.INFO)
try:
conn = pymysql.connect(rds_host, user=name, passwd=password, db=db_name, connect_timeout=5)
except:
logger.error("ERROR: Unexpected error: Could not connect to MySQL instance.")
sys.exit()
def lambda_handler(event,context):
logger.info('## EVENT')
logger.info(event)
insertVal = ""
if stateKey in event:
if reportedKey in event[stateKey]:
if depthKey in event[stateKey][reportedKey]:
depthValue = event[stateKey][reportedKey][depthKey]
if temperatureKey in event[stateKey][reportedKey]:
temperatureValue = event[stateKey][reportedKey][temperatureKey]
else:
temperatureValue = -99
if timeStampKey in event[stateKey][reportedKey]:
timeValue = datetime.fromtimestamp(event[stateKey][reportedKey][timeStampKey],tz=pytz.utc)
#                logger.info("Using state time")
elif timeStampKey in event:
#                logger.info("using timestamp" + str(event[timeStampKey]))
timeValue = datetime.fromtimestamp(event[timeStampKey],tz=pytz.utc)
else:
raise Exception("JSON Missing time date")
if deviceKey in event[stateKey][reportedKey]:
deviceValue = event[stateKey][reportedKey][deviceKey]
else:
logger.error("JSON Event missing " + deviceKey)
raise Exception("JSON Event missing " + deviceKey)
else:
raise Exception("JSON Event missing " + reportedKey)
else:
raise Exception("JSON Event missing " + stateKey)
thingIdValue = getThingId(deviceValue)
tz1 = pytz.timezone('US/Eastern')
xc = timeValue.astimezone(tz1)
with conn.cursor() as cur:
cur.execute("INSERT into creekdata.creekdata (created_at,depth, thingid,temperature) values (%s,%s,%s,%s)",(xc.strftime("%Y-%m-%d %H:%M:%S"),depthValue,thingIdValue,temperatureValue));
conn.commit()
return "return value"  # Echo back the first key value
def getThingId(deviceName):
with conn.cursor() as cur:
cur.execute("select thingid from creekdata.things where name=%s", deviceName)
results = cur.fetchall()
#    logger.info("Row = " + str(len(results)))
if len(results) > 0:
#        logger.info("thingid = "+ str(results[0][0]))
return results[0][0]
else:
raise Exception("Device Name Not Found " + deviceName)

The Creek 2.0: AWS Relational Database Server (RDS) – MySQL

Summary

In the previous articles I showed you the overall Creek 2.0 Architecture (1-8).  Then I explained how AWS MQTT (5) works, and I showed you how to write a Python program to update the device shadow (4).  In this article, I will create an AWS Relational Database Server (RDS) that runs MySQL which will be used to store the data.

You might ask yourself why would I explain (8) before I explained (6) & (7)?  The answer is that I need a place to send the data before the send the data functions will make any sense.

First, a definition, RDS – Relational Database Server – is Amazons name for a service that give you a database server, in your VPC, running an instance of MySQL, Aurora, DynamoDb, or Postgres.  In their words, RDS “…provides cost-efficient and resizable capacity while automating time-consuming administration tasks such as hardware provisioning, database setup, patching and backups.”   The AWS definition is largely true.  It does not however abdicate your DataBase Administrator (DBA) responsibilities.

For my application I need MySQL, so for this article I will walk you through setting up a MySQL database using AWS RDS.  The specific topics are:

  1. Create a Database Using the Amazon Defaults
  2. Create MySQL WorkBench Connection
  3. Examining the Security
  4. Rethinking the Security & Subnet Groups
  5. Configure Security Groups
  6. Create the Database I Really Want
  7. MySQL WorkBench EC2 Tunneling over SSL

Create a Database Using the Amazon Defaults

It is really easy to create a MySQL database using the default Amazon settings.  The setting will be absolutely fine, except that the Database will be attached to a Public Subnet rather than a private one.   This is probably mostly OK as the subnet settings that AWS creates by default are probably safe enough?  It is certainly easy, so let’s start there.  Go to your AWS management console.  Then search for RDS.

You will arrive a screen that should look something like this one.  I say should because 1) they like to change things around and 2) I already have some stuff going in my RDS setup. To create a database click  on “Create database”


When you get to the create database screen it will give you some options.  Notice at the top of my screen shot they are already offering me a new user interface.  For the first database select:

  • Easy Create
  • MySQL
  • Free Tier
  • DB instance identifier (I leave the default database-1)
  • Master username = admin
  • Autogenerate password

Then press “Create database”

Creating a database takes about 5 minutes.  In the screen shot below you can see that it is “Creating” and that I am already running two other databases.  Also you can see at the top of the screen it says “View credential details”.  This is where you find out the password that was automatically created for you.  If you leave this screen without the password your database becomes inaccessible and you will need to delete it.

When you click the details screen you will get something like this:

Once the database is created your screen will look something like this:

When you click on database-1 (the one we just created) it will show you details about the database.  This screen has a bunch of useful information including the endpoint a.k.a the DNS name of your database.

Create MySQL WorkBench Connection

I am not a real database administrator so I like to use the MySQL Workbench GUI to access my database.  To make a new connection, press the little plus next to MySQL Connections.

On this screen you need to provide the hostname, which in Amazon terms is the endpoint.  You also need to give the Username (which in my case was default admin) and the crazy generated password.

When I press the “Test Connection” I get this lovely message.

The problem is that my database is not “Publicly available”  To fix this click on “Modify”

Then scroll down to “Network and Security” and select “Public accessibility” and pick yes.

Then scroll down some more and pick “Continue”

It will then ask you when?  Tell it NOW!!! right NOW!!! I can’t WAIT!!!  But seriously, it doesn’t matter because we don’t have anything in the database and no connections.

On my database this takes about a  minute… so be patient. I wasn’t and the connection didn’t work and I went looking to figure out why.  I finally realized that it was because it took a while to make the change.  Now when I test the connection it says:

And when I open the connection it works.

Now I can make database and a table.

Examining the Security

A couple of things to notice about this database.  First, this database is setup to run on us-east-2a.  And that the database is in the “Default” subnet group which is either subnet-d41619bc, subnet-040ba648 or subnet-2b9edb51 (three subnets in the three availability zones in us-east-2).  For some reason which I can’t figure, they don’t display which subnet instead they make you figure it out by combining region and you knowledge of the subnets.

But wait is that subnet public or private?  And which one is it?  If you go to the AWS console for the VPCs and then click on the subnet tab you will find this configuration (at least in my VPC).  I did this work for the article I did on VPCs where I setup one private and one public subnet for each of the availability zone in the us-east-2.  From the screen above you can see that my RDS is setup in us-east-2a which means that it is on subnet-d41619bc.

Notice that I gave that network the name us-east-2a-pub because it is a PUBLIC network.  Which you can see when you click on it.  Notice that the Route Table is Public.

When you click on “Route Table” you see that it has 0.0.0.0/0 sent to the Internet gateway named igw-9748c9ff

And that the Network ACL allows all traffic to and from the subnet.

Rethinking the Security & Subnet Groups

Having a MySQL database server directly connected to the public internet may not actually be such a good idea.  Whatever application you develop for sure wants to be able to connect to it, but do you really want the rest of the world hacking at it?  Probably not.  If the database server is attached to a private subnet that only servers that are inside of your VPC are allowed to attach to it.

How do you move a RDS from a public to a private subnet?  Well, unfortunately, there is no good way to do that (there is a way but just not very good) and you actually needed to get it into the correct subnet when you created the database.  But you might ask yourself, there was no place on any of those screens to setup the subnet.  And that is true.  BUT you can tell it which “subnet group” to attach to.  A subnet group is literally just a list of subnets with a name.  On the RDS console on the far right there is a link to subnet groups.  In my class the link says “Subnet Groups (2/50)”.  It sure seems like this tab should be on the VPC screen and I can’t think of any reason they wouldn’t have put it there.  But there it is.  When you click on the “Subnet Groups…”

You see that there are two subnet groups.  One called “default” and one called “test1” (which I created while I was making all of these screen shots).  If you click on default …

You will see that this group contains 3 subnets.  In fact this group was created automatically for you and contains ALL of the subnets in your VPC that were automatically created for you when the VPC was created.  Since that time I made some of them private which is the source of confusion.

In order to create a new subnet group you click on the button “Create DB Subnet Group”

Then set things up:

  • Named the group “private”
  • Made a short description
  • Clicked “Add all of the subnets in the group”
  • Then I removed the public ones.
  • Then press create

Alternatively, you could just add the private ones by selecting the availability zone, then the private subnets.

Configure Security Groups

The next thing that is goofy in security is that when I click on the VPC security groups I can see the security configuration for that subnet.

When I click on that security group you can see that the Amazon helped me by adding an Inbound rule to the security group to allow connections from 198.37.196.195 (which is the current IP address at my house) on port 3306.  In other words it poked a hole in the firewall that was limited to MySQL connections from my house… which I suppose is cool until my DHCP address changes.  Oh well.

Create the Database I Really Want

OK lets create the database that we really want.  First, I will delete the database that I don’t want because there is not really any way to move it to another subnet.  Well, that actually isn’t true.  Apparently you can create a new VPC, transfer the RDS to the new VPC, then transfer it back to the original VPC, then delete the temporary VPC.  But that isn’t what I’m doing.

If you select the database, then select actions->delete.

It will ask you if you are SURE!!! Because there is no data in the database I turn off the final snapshot.  I acknowledge that Im really sure… and then press “delete me”

Then it takes a bit of time to delete.

Now I press Create database. Turn off easy create (so that I get access to the option to place the the new database in the correct subnet group.

Free tier is plenty good for this setup.  And I don’t really care what the name of the database is.  As before I’ll let it generate the password.

No choices on the instance size.

Finally in the connectivity section there is something interesting.  You need to expand the “additional connectivity configuration” to see these options.  Specifically, I can pick out the subnet group for this RDS instance.  Recall from above I created the private subnet group.  Pick it.

When I press create, I get this screen … sweet success.

And once again it creates credentials for me.

Now I have “database-2” which is running in “us-east-2a”

Click on database-2 and you can see that it is in the “private” subnet group.  If you look higher in this article you will find out that it MUST be running on subnet-0081c6f5eeaccdeaf.

When I click on that subnet I find that it is a private subnet in us-east-2a.  Notice that the route table is marked as “Private”

MySQL WorkBench EC2 Tunneling over SSL

All that security is cool and everything.  But, How do I talk to the database?  Well, the answer to that question is that the RDS server is running in my VPC and any computer that is attached to that VPC can talk to the database server.   To make all of this work, I run an EC2 server in my VPC.  You can only attach to this server if you have the RSA keys.  But that still doesn’t answer the question how do I connect from my computer.   The answer is you need to do MySQL Tunneling over SSL.  To set this up in MySQL Workbench, first create a new connection.

  • Pick the connection method as “Standard TCP/IP over SSH”
  • Set the SSH Hostname to be your EC2 Instance
  • Set the User (I have the default ubuntu)
  • Make a link to your keyfile
  • Give the DNS name of your RDS Server
  • The user name (remember from above it is admin)

Now when I test the connection… sweet success.

And now I can talk to the MySQL server (and do whatever SQL stuff I want)

In the next article I will create a lambda function to send data onto the RDS database.

The Creek 2.0: Read Sensor Data Send to AWS IoT via MQTT

Summary

In this article I will show you how to use Python to read from the I2C bus and then send the data to the AWS IoT Cloud via MQTT.  This will include the steps to install the two required libraries.  I will follow these steps:

  • Install the SMBUS Python Library
  • Create pyGetData.py to test the I2C
  • Install the AWS IoT Python Library
  • Create  pyGetData.py to send data to AWS IoT
  • Add the pyGetData.py to runI2C (which is run every 2 minutes)
  • Verify that everything is functioning

Install the SMBUS Python Library & Test

In order to have a Python program talk to the Raspberry Pi I2C you need to have the “python3-smbus” library installed.  To do this run “sudo apt-get install python3-smbus”

pi@iotexpertpi:~ $ sudo apt-get install python3-smbus
Reading package lists... Done
Building dependency tree       
Reading state information... Done
The following NEW packages will be installed:
python3-smbus
0 upgraded, 1 newly installed, 0 to remove and 426 not upgraded.
Need to get 0 B/9,508 B of archives.
After this operation, 58.4 kB of additional disk space will be used.
Selecting previously unselected package python3-smbus.
(Reading database ... 136023 files and directories currently installed.)
Preparing to unpack .../python3-smbus_3.1.1+svn-2_armhf.deb ...
Unpacking python3-smbus (3.1.1+svn-2) ...
Setting up python3-smbus (3.1.1+svn-2) ...
pi@iotexpertpi:~ $ 

I like to make sure that everything is working with the I2C bus.  There is a program called “i2cdetect” which can probe all of the I2C addresses on the bus.  It was already installed on my Raspberry Pi, but you can install it with “sudo apt-get install i2c-tools”.  There are two I2C busses in the system and the PSoC 4 is attached to bus “1”.  When I run “i2cdetect -y 1” I can see that address ox08 ACKs.

pi@iotexpertpi:~/pyGetData $ i2cdetect -y 1
0  1  2  3  4  5  6  7  8  9  a  b  c  d  e  f
00:          -- -- -- -- -- 08 -- -- -- -- -- -- -- 
10: -- -- -- -- -- -- -- -- -- -- -- -- -- -- -- -- 
20: -- -- -- -- -- -- -- -- -- -- -- -- -- -- -- -- 
30: -- -- -- -- -- -- -- -- -- -- -- -- -- -- -- -- 
40: -- -- -- -- -- -- -- -- -- -- -- -- -- -- -- -- 
50: -- -- -- -- -- -- -- -- -- -- -- -- -- -- -- -- 
60: -- -- -- -- -- -- -- -- -- -- -- -- -- -- -- -- 
70: -- -- -- -- -- -- -- --                         
pi@iotexpertpi:~/pyGetData $ 

You might recall from an earlier article that I setup the register map of the PSoC4 as follows:

typedef  struct DataPacket {
uint16 pressureCounts;
int16 centiTemp; // temp in degree C / 100
float depth;
float temperature;
} __attribute__((packed)) DataPacket;

If I use the i2ctools to read some data from the PSoC4 like this:

pi@iotexpertpi:~/pyGetData $ i2cget -y 1 8 0 w
0x0196
pi@iotexpertpi:~/pyGetData $

I get 0x196 which is 406 in decimal.  In my ADC I have it setup as 12-bits into 0-2.048v which means that it is 0.5mv per count in other words the ADC is reading .204v which is about .204V/51.1 ohm = 4mA also knowns as 0 PSI.  OK that makes sense.

Now I create a program called testI2C.py.

import smbus
######################################################
#Read the data from the PSoC 4
######################################################
bus = smbus.SMBus(1)
address = 0x08
# The data structure in the PSOC 4 is:
# uint16_t pressureCount ; the adc-counts being read on the pressure sensor
# int16_t centiTemp ; the temperaure in 10ths of a degree C
# float depth ; four bytes float representing the depth in Feet
# float temperature ; four byte float representing the temperature in degrees C
numBytesInStruct = 12
block = bus.read_i2c_block_data(address, 0, numBytesInStruct)
print(block)

What I will do next is run the program to see what data it gets back from the Raspberry Pi.  Then I will use the i2ctools to get the same data and compare to make sure that things are working.

pi@iotexpertpi:~/pyGetData $ python3 testI2C.py 
[150, 1, 236, 14, 0, 0, 0, 0, 204, 204, 24, 66]
pi@iotexpertpi:~/pyGetData $ i2cget -y 1 8 0 w
0x0196
pi@iotexpertpi:~/pyGetData $ 

Hang on 150,1 isn’t 0x0196.  Well yes it is because the data is in decimal and is little endian.  When you switch it to hex and display it the same way you get 0x0196 same answer.  Good.

The next problem is that a list of bytes isn’t really that useful and you need to convert it to an array of bytes using the function “bytearray”.  A bytearray also isn’t that helpful, but, Python has a library called “struct” which can convert arrays of bytes into their equivalent values.  Think converting a packed  C-struct of bytes into the different fields.  You have to describe the struct using this ridiculous text format.

The first part of the code is as before.  The only really new things are:

  • On line 20 I convert and array of bytes into a bytearray
  • On line 26 I unpack the byte array using the format string.  You can see in the table above “h” is a signed 16-bit int.  “H” is a unsigned 16-bit int. “f” is a four byte float.

The unpack method turns the bytes into a tuple.  Here is the whole code.

import struct
import smbus
######################################################
#Read the data from the PSoC 4
######################################################
bus = smbus.SMBus(1)
address = 0x08
# The data structure in the PSOC 4 is:
# uint16_t pressureCount ; the adc-counts being read on the pressure sensor
# int16_t centiTemp ; the temperaure in 10ths of a degree C
# float depth ; four bytes float representing the depth in Feet
# float temperature ; four byte float representing the temperature in degrees C
numBytesInStruct = 12
block = bus.read_i2c_block_data(address, 0, numBytesInStruct)
print(block)
# convert list of bytes returned from sensor into array of bytes
mybytes = bytearray(block)
# convert the byte array into
# H=Unsigned 16-bit int
# h=Signed 16-bit int
# f=Float 
# this function will return a tuple with pressureCount,centiTemp,depth,temperature
vals = struct.unpack_from('Hhff',mybytes,0)
# prints the tuple
print(vals)

When I run the program I get the raw data.  Then the unpacked data.  Notice the 406 which is the same value from the ADC as earlier.

pi@iotexpertpi:~/pyGetData $ python3 testI2C.py
[150, 1, 76, 14, 0, 0, 0, 0, 214, 71, 18, 66]
(406, 3660, 0.0, 36.570152282714844)
pi@iotexpertpi:~/pyGetData $ 

Install the AWS IoT Python Library

Now I want to send the data to AWS IoT using MQTT.  All the time I have been using Python I have been questioning my sanity as Python is an ugly ugly language.  However, one beautiful thing about Python is the huge library of code to do interesting things.  Amazon is no exception, they have built a Python library based on the Eclipse Paho library.  You can read about the library in the documentation.

To get this going I install using “sudo pip3…”

pi@iotexpertpi:~ $ sudo pip3 install AWSIoTPythonSDK
Downloading/unpacking AWSIoTPythonSDK
Downloading AWSIoTPythonSDK-1.4.7.tar.gz (79kB): 79kB downloaded
Running setup.py (path:/tmp/pip-build-ajpr2imp/AWSIoTPythonSDK/setup.py) egg_info for package AWSIoTPythonSDK
Installing collected packages: AWSIoTPythonSDK
Running setup.py install for AWSIoTPythonSDK
Successfully installed AWSIoTPythonSDK
Cleaning up...
pi@iotexpertpi:~ $ 

To use the library to connect to AWS you need to know your “endpoint”.  The endpoint is just the DNS name of the virtual server that Amazon setup for you.  This can be found on the AWS IoT management console.  You should click on the “Settings” on the left.  Then you will see the name at the top of the screen in the “Custom endpoint”

The next thing that you need is

  • Your Thing Certificate (I hope you downloaded them when you had the chance)
  • Your Thing Private Key
  • The Amazon Root CA which you can get on this page You should choose “Amazon Root CA 1”

The program is really simple.  On lines 7-13 I just setup variables with all of the configuration information.  Then I create a JSON message by concatenating all of the stuff together that I read from the PSoC 4.  Lines 18-20 setup an MQTT endpoint with your credentials.  Line 22 opens the MQTT connection.  And finally line 21 Publishes the message.

from AWSIoTPythonSDK.MQTTLib import AWSIoTMQTTClient
######################################################
# Send Data to AWS
######################################################
host = "a1c0l0bpd6pon3-ats.iot.us-east-2.amazonaws.com"
rootCAPath = "../aws-keys/AmazonRootCA1.pem"
certificatePath = "../aws-keys/a083ad1cff-certificate.pem.crt"
privateKeyPath = "../aws-keys/a083ad1cff-private.pem.key"
port = 8883
clientId = "applecreek"
topic = "$aws/things/Test1/shadow/update"
# Shadow JSON Message formware
messageJson = '{"state":{"reported":{"temperature":' + str(vals[3]) +',"depth": ' + str(vals[2]) + ',"thing":"applecreek"}}}'
myAWSIoTMQTTClient = AWSIoTMQTTClient(clientId)
myAWSIoTMQTTClient.configureEndpoint(host, port)
myAWSIoTMQTTClient.configureCredentials(rootCAPath, privateKeyPath, certificatePath)
myAWSIoTMQTTClient.connect()
myAWSIoTMQTTClient.publish(topic, messageJson, 1)

Now that I have the Python program, I want to plumb it into the rest of my stuff.  On my RPI I run “crontab -l” to figure out what my collect data program is.  That turns out to be “runI2C” which appears to run every two minutes.

0,2,4,6,8,10,12,14,16,18,20,22,24,26,28,30,32,34,36,38,40,42,44,46,48,50,52,54,56,58 * * * * /home/pi/getCreek/runi2c

I edit the runI2C shell script and add on my python program.

#!/bin/sh
cd ~pi/getCreek
sudo java -cp build/jar/getCreek.jar:classes:./lib/* CreekServer GetData
cd ~pi/pyGetData
python3 pyGetData.py

Finally we are ready for the moment of truth.  Log into the console and start the test client.  Subscribe to “#” and after a bit of time I see that my publish happened and it was accepted into the Device Shadow of my Thing.

Here is the device shadow

Here is the whole program

import struct
import sys
import smbus
from AWSIoTPythonSDK.MQTTLib import AWSIoTMQTTClient
######################################################
#Read the data from the PSoC 4
######################################################
bus = smbus.SMBus(1)
address = 0x08
# The data structure in the PSOC 4 is:
# uint16_t pressureCount ; the adc-counts being read on the pressure sensor
# int16_t centiTemp ; the temperaure in 10ths of a degree C
# float depth ; four bytes float representing the depth in Feet
# float temperature ; four byte float representing the temperature in degrees C
numBytesInStruct = 12
block = bus.read_i2c_block_data(address, 0, numBytesInStruct)
# convert list of bytes returned from sensor into array of bytes
mybytes = bytearray(block)
# convert the byte array into
# H=Unsigned 16-bit int
# h=Signed 16-bit int
# f=Float 
# this function will return a tuple with pressureCount,centiTemp,depth,temperature
vals = struct.unpack_from('Hhff',mybytes,0)
# prints the tuple
print(vals)
######################################################
# Send Data to AWS
######################################################
host = "a1c0l0bpd6pon3-ats.iot.us-east-2.amazonaws.com"
rootCAPath = "../aws-keys/AmazonRootCA1.pem"
certificatePath = "../aws-keys/a083ad1cff-certificate.pem.crt"
privateKeyPath = "../aws-keys/a083ad1cff-private.pem.key"
port = 8883
clientId = "applecreek"
topic = "$aws/things/applecreek/shadow/update"
# Shadow JSON Message formware
messageJson = '{"state":{"reported":{"temperature":' + str(vals[3]) +',"depth": ' + str(vals[2]) + ',"thing":"applecreek"}}}'
myAWSIoTMQTTClient = AWSIoTMQTTClient(clientId)
myAWSIoTMQTTClient.configureEndpoint(host, port)
myAWSIoTMQTTClient.configureCredentials(rootCAPath, privateKeyPath, certificatePath)
myAWSIoTMQTTClient.connect()
myAWSIoTMQTTClient.publish(topic, messageJson, 1)


The Creek 2.0: AWS IoT MQTT Message Broker

Summary

In this article I will explain the fundamentals of the Amazon Web Service IoT Device Cloud.  I will show you how to:

  • Create a “Thing” in the AWS IoT Core
  • Create and attach secret keys in the form of a X.509 Certificate
  • Create and attach an access Policy to the Certificate
  • Publish and Subscribe use a Message Queuing Telemetry Transport (MQTT) Message Broker (that Amazon creates for you)
  • Use MQTT to update the cached “state” of your device, also called the Device Shadow

There are 5 fundamental concepts that you need in order to understand the AWS IoT system, specifically, Thing, Certificate, Policy, MQTT and Device Shadow.

A Thing is Amazon’s word for some device out in the world that attaches to the AWS IoT cloud.  In my case, Thing means the Elkhorn Creek in Georgetown, Kentucky.  But, it could be a garage door, dishwasher or whatever other ridiculous thing you want to connect to the internet.  The AWS IoT Cloud allows you to create a Thing, setup and manage security, receive data from it, send data to it, and keep track of its state.  In my case the state is the water level of the Creek and the temperature in my barn.

A Certificate is an X.509 document that has a signed public key of the Thing.  When you use the Amazon IoT Console to create a Thing,  you can also create a Certificate for the Thing, the private key that goes with the public key in the Certificate, as well as a copy of the public key that is embedded in the Certificate.  In order to create a TLS connection to AWS IoT you will need to use the Certificate as Amazon AWS does “double sided” TLS connections.  In other words you must verify Amazon and Amazon must verify you.  You will also need your private key in order to decrypt data that Amazon sends to you encrypted with your public key.  Amazon uses the Certificate to uniquely identify a specific Thing.

A Policy is a JSON document that is attached to a Certificate that specifies what “IoT Actions” your Thing is allowed to take and to which resources that it is allowed to take the action upon.  Actions include Connect, Subscribe, Publish etc.  All resources in the world of Amazon have an ARN (Amazon Resource Name), so in the Policy you specify what actions can happen to what ARNs.

MQTT stands for Message Queuing Telemetry Transport and is an IoT protocol for a Thing to Publish messages to a Message Broker Topic.  A Message Broker is TCP/IP server that is running in the AWS IoT Cloud that Amazon creates for you and automatically turns on.  A Topic is just a name which you create that serves as a way to identify message channels.  In addition to Publishing messages to a Topic, a client can also Subscribe to a Topic.  In other words a Thing can Publish to any topic and any Thing can Subscribe to any Topic.  This you can create a many too many relationship for Publishing/Subscribing to message.  There are some topics which have special meaning in the world of AWS IoT and are used for updating and monitoring Thing state stored which is stored in the Device Shadow.

A Device Shadow is just a JSON document that is cached in the AWS IoT Cloud and is used to represent the Desired and Reported state of a Thing.  This allows other devices in the AWS IoT Cloud to communicate with a Thing even if it is not currently connected.  The JSON Device Shadow is just a JSON key value map which is defined by YOUR application.  Amazon doesn’t care what keys or values you use.  In my case the keys are “temperature” and “depth”.  When my Thing finds new values for the state of those two variables it will send updates to the Device Shadow via MQTT.

Amazon has pretty good documentation of how all of this fits together here.  One thing to note is that Amazon changes the screens on this system all of the damn time.  In my experience the changes are not major, but my screen shots may or may not reflect the current state of AWS.  Actually, there will almost certainly be some differences, but I can’t help that.  Please email bezos@amazon.com if don’t like it.

Here are the steps I will follow in this Article to show you this whole thing:

  • Create an AWS IoT Account
  • AWS IoT Core Console Tour
  • Create a Thing & Certificate
  • Create a Policy and Attach it to the Certificate
  • Explain MQTT & Show the Test Client
  • Explain the Device Shadow
  • Update the Shadow Using the Test Client

Create an AWS IoT Account

In order to use all of this, you will need to create an AWS IoT Account.  You can do that at https://console.aws.amazon.com.  Obviously Amazon makes all of their profit from AWS, however, for small amounts of usage, it is essentially free to use.  You will need to provide a credit card when you set this up, but for every thing that I have done, I have used <$10.  So no big deal.

When you click on Create a new account it will bring you to this screen.  This will be a different account (even if it has the same password as your Amazon commercial account).

Once you have an account you will end up on a Screen that looks like this.  You can see that I have recently been using all of the services that I am talking about.  Imagine that.  For this lesson we will focus on IoT Core, but in the future lessons Ill talk about other services.  You can get to IoT Core by typing IoT Core into the search box and the clicking it.

There is actually a bunch of good documentation (which you can see near the bottom of the screen) including tutorials (obviously none of them are as good as this one)

AWS IoT Core Console Tour

Once you click on IoT Core, you will end up on a screen like this one.  It shows how much activity is going on in my account (basically not very much).  On the left side of the screen are all of the functions that we will use in this tutorial.

Monitor shows the screen shown above and gives you top level statistics about what is going on in your Cloud.

Onboard is a set of new tools to help you attach devices to your AWS IoT Cloud (I have not used any of them)

Manage allows you to create, delete, modify all of your Things (we will do quite a bit of this)

Greegrass is a tool that allows you to have a local “server” that all of your things attach to.  I have not used it as of yet, but will in the future.

The Secure menu give you access to all of your Certificates and Policies.

Defend gives you access to tools to monitor and defend your IoT network as the Russians, Chinese and CIA are all trying to get into your network.

The Act screen allows you to create Rules to do stuff based on things happening in the world of your MQTT Message Broker.  In a future article I will show you how to Act on an MQTT message to run an Amazon Lambda Function.

Test starts up a REALLY cool web based MQTT test tool that will allow you to Publish and Subscribe to messages that are flying around on your MQTT broker.

Create a Thing & Certificates

Amazon has some pretty decent documentation which shows you how to create and manage things which you can find here.

Finally, we are ready to actually do something.  Specifically we will create a “Thing” to represent the water level in the Elkhorn Creek.  Click on Manage -> Things.  You can see in the picture below that I already have two devices in my Thing cloud, applecreek and Test1.  Press “Create” to start the process of creating  new Thing.

Obviously, Amazon designed this whole system to be able to handle boatloads of Things, so they provide the ability to create many things, both in the GUI as well as with the command line.  But to learn the process we will create a single thing using the web gui.  Press “Create a single thing”

Give you Thing a name (yes there are tons of bad jokes which could be done here).  I will call my example Thing “Test2”.  Then press “Next”

In order for you Thing to connect to the network it needs to have a Certificate attached to it.  The certificate documentation is here.  It is possible to use your own certificates or have Amazon sign your certificates.  However, we will do the simple thing and let Amazon create the Certificate for us.  Press “Create certificate”

Once the Certificate is created you will come to this screen.  In order to use the Certificate on your Thing you will need to download it as well as the private/public key pair.  You should take the opportunity to down these NOW.  Once that is done press “Activate” to turn on the Certificate.

Once you have activated the certificate you get your LAST!!! chance to download the certificates.  If you do not download them, then you will need to delete them and create a new set.  You should be careful where you store the keys on  your local device as they will give bad actors the ability to access your Things.   If you look around on GitHub it will be common to find them, so be careful.  Press “Done” to move to the next screen.

After you have created a device your screen will look something like this.  You can see that I already created several Things which I called “applecreek” (the Thing that is in production on my real system.  Now that you have “Test2” we can look at it to see some of the properties.  Click “Test2”

You will see a list of properties classes of the device.  Starting with the official Amazon Resource Name (ARN) of your device.  If you click on “Security”

You will see that indeed you have a Certificate that is “attached” to your device.  Hopefully you downloaded the keys that go with the device.  If you didn’t you are screwed and will need to create a new Certificate (which you can do on this screen)

Create a Policy and Attach it to your Certificate

Amazon has documentation for Policies here.  As I discussed earlier a Policy is a JSON document that is attached to a Certificate that enables a Thing who is identified by that Certificate to take Action(s) on a specific Resource as identified by an ARN.  Policies can have wildcards for Actions and Resources, so they may be  attached to multiple Certificates.  Imagine Action:* and Resource:* (which is probably a bad policy)

Let’s create one and that should illuminate things better.  Go back to the main screen and click on “Secure->Policies”.  Then click “Create”

Give the Policy a name.  In this case “Test2Policy”.  My Policy has two Actions.

  1. IoT:Connect which is allowed by the Thing “…./Test2”
  2. IoT:Publish which is allowed you to MQTT Publish to the topic listed (notice I made an error and I really meant Test2)

When you click on the Actions box Amazon give you a list of suggestions.  One of the suggestions is “IoT:*” which means ANY of the IoT actions (like Connect, Publish, Subscribe,…)  You can also specify a wildcard for the resources with a “*”

After you have the policy done, click “Create”

And your screen will look something like this.  Notice that I setup a policy called “policyall” which is a wildcard policy that lets me do anything.  You can click on the policies and see what is going on with them.

In order to have the Policy take effect you need to attach it to the Certificate.  Click on Secure->Certificates.  Then click your specific Certificate.  In my case it was “ca8…”

When you get to the Certificate page you can then click on “policies”

Where you will see that you don’t have a Policy associated with your Certificate.

Fix that by click on “Actions” which is on the right hand side of the screen.  Pick “Attach Policy”

On this screen pick the policy you want to attach.  In this case I picked “Test2Policy”.  Then click attach.

MQTT & the Test Client

One of the coolest things that Amazon provides is a web browser based MQTT client.  To get to it press “Test” (the last item on the left)

Which will bring you to this screen.  Here you can Subscribe to Topics by typing the name of the topic you are interested in and clicking “Subscribe to Topic”.  You can also Publish messages to a Topic by typing the Topic name in the Publish box, and typing the message in the black box.  The message is typically in JSON format, but this is not actually a requirement.

There are very few rules about topic names and as such are left up to you as application semantics.  There are, however, a few reserved names which cause specific things to happen in the AWS IoT Cloud.  These topics all start with $aws and are documented here.

Let’s do a little demonstration of the system by subscribing to “myrandomtopic”, obviously just a name I made up.  Type in the box and press “subscribe to topic”

Once that is done you will see on the left side of the screen the topic name in bold with an “x”.   To actually publish something you can type a message to be sent into the black box… and when you press “Publish to topic”  Go ahead and type something.

When you press publish, your screen will show each the message that is Published to the Topic because you are Subscribed.  This will include messages you Publish in the Test console, as well as Messages that are Published by other devices, like your Thing.  This is a really convenient way to debug what is going on in your system.

If you go back to the publish to a topic screen and type a different message… then press “publish to topic”… you will notice a green dot next to the topic indicating a new message.

And when you click the topic you will see the history of message Published since you Subscribed.

You are allowed to subscribe to multiple topics at a time and it will show all of them.

There is also the ability to subscribe to “wildcard” topics.

Which means you can subscribe to “#” which will give you all messages sent to the MQTT message broker

Notice that if I Publish to “myrandomtopic” that it will match by “myrandomtopic” as well as “#” (look at the green dots on the left of the screen)

The Device Shadow

The purpose of the Device Shadow is to serve as a Cache of the Reported and Desired State of a Thing.  This allows a Thing to not be connected all of the time.  Imagine that a light build sends its “reported” state every time that it changes.  And a light switch will send the light bulbs “desired” state when it wants to change the light bulb.  This allows a device to figure out what state it is supposed to be in when a power outage occurs.  And it allows devices to find out what is going on with a Thing without having to talk directly to them.

The official format of the Device Shadow is as follows.  Notice just another JSON document.

Here is an example document

You can look at the Device Shadow by Clicking on a Thing in the Management Console.  Then clicking Shadow.  This device has a boring document which nothing in it.

Update the Shadow Using the Test Client

The last piece of this puzzle is how a Thing interacts with its Device Shadow.  That is simple.  A Thing needs to send JSON message in the right format to the right MQTT Topic.  If you click on “Interact” it will show you the list of Topics.

In the documentation there are examples of JSON messages that you need to Publish.

Given all of that, let’s update the shadow for Test2 by publishing a message with the temperature and depth in this JSON document

{
"state": {
"reported" : {
"temperature":30.12,
"depth":10.2
}
}
}

First subscribe to the “#” topic so you can see all of the messages.  Then publish the JSON document.

In the MQTT test client you will see

  • $aws/things/Test2/shadow/update/accepted
  • $aws/things/Test2/shadow/update
  • $aws/things/Test1/shadow/update/documents

Then you will be able to go to the management console –> Manage -> Things.  This will show you all of your “things” including the “Test2” that we just updated.  Click on “Test2”

Then click Shadow.  Now you will be able to see that the document has been updated and it is caching the state of the device.

Now that we know how to interact with the device shadow via MQTT.  How do I get the Raspberry Pi to send MQTT messages?  That is the topic of the next article.

The Creek 2.0: Amazon AWS IoT Solution Architecture 2.0

Summary

Last week I talked about fixing my Creek Water Level sensor.  This got me to reflecting on a change that I have been wanting to make for a long long time: moving all of the backend server stuff to the Amazon AWS IoT Cloud.  In this article, I will explain the architecture of the intermediate end result.  What in the world does “intermediate end result” mean? Alan, is that a really goofy way to say that you aren’t going to finish the job?  Well, I suppose yes, not at first.  But I am going to hook up all of the middle stuff, from the current Raspberry Pi to an Amazon Relational Database Server (RDS) running MySQL.

There is a bunch of technology going on to make my new solution work, including:

  • PSoC 4 & Embedded C
  • Copious use of Python
  • MySQL
  • JSON
  • Raspberry Pi
  • MQTT
  • AWS IoT Core, Shadow
  • AWS Python SDK

Architecture

This is a picture of the updates to the system architecture.  The boxes in green are unchanged from the original system architecture.  The purple Raspberry Pi box will get some new stuff that bridges data to the Amazon IoT cloud and the blue boxes (which are Amazon AWS) are totally new.

(1) Pressure Sensor

The Measurement Specialties US381 Pressure sensor remains unchanged.  It senses the water pressure from the Creek and returns 4-20mA based on a pressure of 0 to 15PSI.  0PSI=4mA, 7.5PSI=12mA and 15PSI=20mA.

(2) Creek Board

The Creek Board remains unchanged.  It supplies power to the pressure sensor and has a 51.1Ohm sensing resistor which serves to turn the current of 4-20mA into voltage of 0.202V to 1.022V, which is perfect for the PSoC Analog to Digital Convertor.

(3) CyPi Board

The CyPi Board remains unchanged.  It has an Arduino pin out on the top to connect to the Creek Board and on the bottom it has the Raspberry PI I2C and GPIO interface.  On the board is a PSoC 4 which reads the voltage of the pressure sensor.  This board also provides power to the sensor and the Raspberry Pi (remember from the previous post that I blew up the power regulator)

(4) Raspberry Pi

In the original design the Raspberry Pi runs a bunch of different Java programs as well as MySQL.

I am going to leave all of the original stuff unchanged.  In the picture above, you can see the runI2C shell script, which is run by the Raspberry Pi crontab.  I will modify this script to run a Python program that will read the sensor state using the SMBus library, then format a JSON message, then connect to the AWS MQTT server using the AWS IoT Python library and send an update of the Shadow state.

(5) AWS IoT MQTT Message Broker

The AWS IoT Cloud provides a bunch of tools to help people deploy IoT functionality.  There are two principal methods for interacting with the AWS IoT Cloud: Message Queuing Telemetry Transport (MQTT) and Hyper Text Transfer Protocol (HTTP).  I will be using MQTT to interface with the AWS Cloud.  Specifically, I will create JSON messages that represent the state of my IoT Device (the Creek Depth and Temperature) and then I will send it to the Amazon AWS MQTT Message Broker.  The message will be stored in a facility provided by Amazon called the Device Shadow, which is a cache of your “thing” state.

(6) AWS IoT Rule Actions and (7) AWS Lambda

In the AWS IoT Core management console you can configure “Act”ions based on the MQTT messages that are flying around on the MQTT broker.  My action will be to look for updates to the Device Shadow topics and then to trigger an AWS Lamba function.  That Python function will take the JSON message (sent via AWS) and will insert the data into the MySQL database.

(8) AWS RDS MySQL

I will create almost the exact database that is running on the Raspberry Pi and install that into an Amazon Relational Database Server (RDS) running MySQL.  I decided to make the database extensible to add data from other “things”.  To do this I add a table of device names and id which map to the data table.

Future

When I get a few minutes there are a bunch of things that I would like to add to this system

  • Remove the Raspberry PI and create a PSoC 6 / 43012 Amazon Free RTOS board to read the data and send it to the AWS Cloud
  • AWS Greengrass
  • Use Grafana to view the data
  • Create and AWS Django Python based web server to display the data

Repair the Elkhorn Creek Water Level Sensor

Summary

As many of you have noticed, www.elkhorn-creek.org has been offline for quite a while (actually since December 22,2018).  I know that many of you have really missed knowing how much water is in the creek.  Given that it blew up in December, and I knew that I was going to have to crawl into the muddy creek to fix it, I had not gotten around to it.  But, now it is July and the water is nice, so I don’t have much of an excuse.  I have written extensively about my system, in fact, it was my first real IoT project.  I assumed that it would not be that hard to fix.  Boy was I wrong.

In this article I will:

  • Get the Sensor out of the Elkhorn Creek & Debug
  • Update the PSoC Project to use a Different GPIO
  • Blow up the CyPi Power Supply
  • Debug the Wrong Pressure Sensor
  • Turn the Raspberry Pi Back on and Retest

Get the Sensor out of the Creek and Debug

I felt like Stanley in the Congo heading down the path to the Elkhorn Creek.

But, when you get there, look how beautiful it is.

Here is a picture looking down at the sensor setup from the top of the bank (that is a 6 foot ladder, so that bank is something like 10 feet high)

When you slide down the bank onto the ladder, this is where you end up.  After I jumped off the ladder into the creek, I was in mud up to my knees.  I had assumed that the problem was that water had leaked around sensor NPT connection.  You can see the drain valve that I installed to drain water out of the pipe for just that case.  When I opened the valve, there was no water… like none. This made me start to wonder what was going on.  The sensor is installed in the end of that square clear out.

When I undid the sensor and brought it up into my lab, there was no leaking around the sensor.  My original theory that the sensor had gotten water onto the dry side was incorrect.

So, I plugged the sensor in on my bench to try to figure out what was going on.

The first measurement I took was across the 51.1 ohm sensor resistor.  Last time I checked, V=IR, so this means that it is drawing 133mA.  That is bad given that it is a 4-20mA current loop.

It is also bad to put 6.81V onto a PSoC pin.  When I measure the voltage at the pin it is 0.003 V.  Dead.  At this point, I suspect that whatever killed the sensor also killed the PSoC, but I don’t know.  I suppose that the sensor could have blown up (maybe an ESD event) and then when the voltage went to 6.81, it blew up the PSoC?  I suppose that I will never know.

In fact, when I connect the power supply directly to the A0/P2[0] analog input, I get 0.023A … which means that I also blew up the GPIO and it is now shorted to ground.  Well, actually it isn’t a short, it is more like 43 Ohm resistor.  Bad.

Here is the spec from the PSoC 4 data sheet.  2mA is a long long way from 2nA.

Unfortunately, this is the only CyPi board that I have.  Moreover, I don’t have another PSoC4 chip to fix it with (or at least at my house right now).  So, I decided that I will assume that the other pins are OK and I will use PSoC Creator to move to another pin (A2) that hopefully isn’t blown up.  To do this, I snip off the Arduino pin, then solder a jumper on the top from A0 to A2.

Update the PSoC Project to use a Different GPIO

Next, I have to fix the firmware to use A2 instead of A0.  This is AKA P2[2] instead of P2[0].  When I open up the workspace in PSoC Creator, it immediately starts complaining about components that are old.  Notice that all of the “dwr’s” which are opened have an asterisk indicating they have changed.  In order to fix this I need to update all of the components.

Starting with the boot loader project called “p4bootloader”, right click and select “Update Components…”

Notice that eight of the components in the project are old.  Select Next.

Then turn off the “create a workspace archive before updating option”.  My project is in Git so I don’t need to save it in case something bad happens.  Then click Finish.

And after a minute I can Build the project.

Next I update the main project which is called “p4arduino-creek”

Follow the same process as before:

In this case I forget to click the archive button, but I can cancel the archive.

Once the update is done, look at the schematic.  The first thing that I notice is that I called the pressure input “high side”.  I hate the name high side… so I am going to fix it to be called pressure

Double click the pin and change it to “pressure”

Because the boot loader hex changed, I need to update the reference in the bootloadable component.  Double click it and correct the path.

Notice that it has a new version of the compiler.

Then reassign the pressure pin to be P2[2] which is also known as A2

Then rebuild and notice that everything is OK.

Once I reprogram the board, I take it outside to reinstall the whole mess.  After I hook it up I start probing with the multimeter and immediately short out the power supply with one of the multi-meter probes.

Blow up the CyPi Power Supply

Which blows up the REG1117.  Here is an animated GIF where you can see that it turns on.. then immediately goes off.  This is more than a little bit annoying.

Fortunately, I have my original CyPi prototype.  So, I go back to the prototype CyPi – which means that I have to use two power supply connections.  One of the things that I fixed in the final CyPI was to have the ability to drive the Raspberry Pi with the 12V input (I have ordered a new REG 1117).

Debug the Wrong Pressure Sensor

When I install everything, an unbelievably frustrating thing happens. I put the probe on the sensor and I immediately measure 1.007V  which is 19.7 mA which is also known as 14.7346 PSI.  This is seriously bad.  I have been standing in mud up to my knees fixing the damn system and it is already broken again.  I should be measure 4mA*51.ohm = .202V.  But no.  This was a deeply frustrating moment because I assumed that something else is wrong with my system.

When I got back inside and tried to figure out what in the world was happening, I thought, maybe the pressure sensor is clogged or something?  This made me wonder what the air pressure in Kentucky at that moment was.  After a little bit of google I find that the air pressure is 30 inches of Hg… which turns out to be … guess… 14.7 PSI.  I knew immediately that I purchased the WRONG DAMN SENSOR.

Measurement Specialties makes the US381 in both Gauge and Absolute pressure.  In the Absolute case, it gives you the pressure with a reference to a vacuum.  In the gauge case it gives you a relative measurement.  The back side of this pressure sensor is exposed to the air, which lets it cancel out atmospheric pressure changes.  But I bought US381-000005-015PA instead of the correct US381-000005-015PG.


And, a few days later Mouser delivered me the correct sensor, and after and hour of mud and sweat I had things ready to try again.

Turn the Raspberry Pi Back on and Retest

After re-installing everything in the barn, I now get .202V across the 51.1 Ohm Sensor Resistor, which means that I am getting exactly 4mA.  That makes perfect sense as right now the pressure sensor is just exposed to the air. (meaning it is sticking out of the water)

And now www.elkhorn-creek.org is working again.  Good.

RS Components & the Elkhorn Creek

Summary

Earlier this year I hosted RS Components at my house in Kentucky.  Here are three videos that they recorded about the Elkhorn Creek Water Level System.  Whoever edited them knew what they were doing.  Thanks to RS Components.

Part 1

Part 2

Part 3


IoT Mailbox: Solar Battery Chargers & System Power Supplies

Summary

In the last Article I talked about my Mailbox problem.  My original plan was to have this device powered with a coin cell.  As I discussed the project with my lab assistant, Nicholas, he asked why it wasn’t going to be solar powered.  I didn’t have a good answer for this question.  This basic question led me down a multi-week deep dark rabbit hole.  For a while (weeks?) I am going to write about my experiences building a solar power supply for my board.  Ideally I want this architecture:

In words, I want to power the system at 3.3v from a battery, USB or a solar cells.  And, I want the solar cell and/or the USB to charge the LiPo battery.  It turns out that I don’t/didn’t know much about:

  1. Solar Cells
  2. Charging LiPo batteries – or in fact batteries
  3. Buck-Boost / Buck Convertors
  4. Super Capacitors

And it turns out that there is an unbelievably large number of PMIC combinations that might work.  Unfortunately, Cypress does not make one.  We do make an Energy Harvesting Boost Convertor, but nothing that can do battery charging.  The last things that surprised me about this whole thing is that the normal maker suspects (Adafruit, SEEED Studio and Sparkfun) don’t really make good breakout boards that meet my architecture needs.

My current plan is to:

  1. Research, buy and evaluate “a bunch” of different evaluation kits from the usual suspects (Ti, Analog, Linear, ST and Maxim)
  2. Document a comparison of the offerings
  3. Write about charging batteries
  4. Write about solar cells (How you use them?  Where do you buy them? How do you test them?)
  5. Write about buck-boost convertors
  6. Design the power supply for my IoT board

Solar Battery Charging PMICs

I started this whole process by making a google sheet with all of the characteristics that I care about.  I made the sheet public so that you can see the current version.

If you look in the spreadsheet you will notice that there are some holes.  And there are Im sure some missing rows.  If you know the answer to any of the open questions, or have other PMICs you are interested in, please either make a comment on this Article or send me an email at engineer@iotexpert.com

Development Kits

As you can see from the picture  below, I have a bunch of development kits.  Some were built by Semiconductor companies, some were built by third parties.  I have chips from Analog, Linear, Microchip, TI and ST.  There is one interesting company in China called Consonance (which I dont have boards for),  In addition, Fujistsu Electronics also makes a IC that I don’t have yet.

In the picture you can see that I have LTC3331, LTC3106, TI BQ25507, TI BQ25570, TI BQ24210, Microchip MCP73871, ST SPV1050 … for now.

In the coming articles look for detailed instructions on these chips, starting with the LTC3331.

Article Description
IoT Mailbox Introduction An introduction to the long series of articles about creating a new IoT System.
IoT Mailbox: Solar Battery Chargers & System Power Supplies

Pinball: Debugging the LM317 Power Supply- A Tale of Getting Lucky

Summary

My father always says he would rather be lucky than good.  I always assume that had something to do with his age.  I never liked that sentiment.  Actually “not like” doesn’t even begin to cover my dislike of that idea.  I guess that I am always distrustful of luck.  But todays post is a story of good luck.  In my post about testing the PCB I showed a picture of my Fluke Meter showing 4.153V DC.  That is cool, expect the power supply in my system is supposed to be regulating the power to 3.3v.  I didn’t sweat the number at the time, but that is a long way from 3.3v.  In fact it is enough to put 3.3V chips-like my accelertomer-at risk of blowing up.  So now what?

LM317 Power LDO Power Supply

Well, on my board I used an LM317 Low Drop Out adjustable regulator.    When I went to setup things up I googled and found this schematic and table of values.  So that is what I put in my design.

LM317 Circuit

I knew that the regulator is adjustable and the feedback resistor network sets the voltage of the output.  When I had the wrong voltage I assumed that I had the wrong size resistors.  So I unsoldered the damn resistors and measured them.  They were dead on, so I put them back on the board.  This left me really wondering, so I went and looked at the datasheet for the LM317.  This is what it says:

There are a bunch of LM317 calculators on the web.  When I looked at them I realized that something might be really bad.  Specifically the resistors from the table (R1=1.2k, R2=1.8k) were probably too large.  That means that there was probably no enough current going back into regulator.  So, this could be the source of my problem.  As I was soldering and unsoldering I realized something really BAD.  I did not put a LM317 on the board.  I put a LM117 on the board.  Holy shit batman!  Why does that work at ALL?

The basic answer is that the LM117 that I used was a 3.3V regulator and had the feedback resistors built in.  Meaning, it wasn’t adjustable at all.  I got totally totally luck as the pinout was exactly the same as the LM317 and ALL I had to do was connect the ADJ resistor to ground instead of the stack.  Moreover, the “tab” was not connected to anything so the output voltage wasn’t shorted to ground either.

As I read the datasheet I learned something else.  My layout is a long long way from optimal.  Here is a picture from the datasheet.

LM117 Datasheet Layout

And here is my layout.

LM317 Layout

Oh well.  I got lucky.  Totally.  I don’t like it.  But there it is.  When I tapeout the board again Ill fix the regulator layout.

You can find all of the source code and files at the IOTEXPERT site on github.

Index Description
Pinball: Newton's Attic Pinball An introduction to the project and the goals
Pinball: Lotsa Blinking LEDs Everyone needs a bunch of LEDs on their Pinball Machine
Pinball: Matrix LEDs (Part 1) Saving PSoC pins by using a matrix scheme
Pinball: Matrix LEDs (Part 2) Solving some problems with the matrix
Pinball: Matrix LEDs Component How to turn the Matrix LED into a component
Pinball: A Switch Matrix Implementing a bunch of switches
Pinball: Switch Matrix Component (Part 1) The switch matrix component implementation
Pinball: Switch Matrix Component (Part 2) The firmware for matrix component
Pinball: Switch Matrix Component (Part 3) Test firmware for the matrix component
Pinball: The Music Player (Part 1) The schematic and symbol for a Music Player component
Pinball: The Music Player (Part 2) The Public API for the Music Player component
Pinball: The Music Player (Part 3) The firmware to make the sweet sweet music
Pinball: The Music Player (Part 4) The test program for the music player
Pinball: The Motors + HBridge Using an Bridge to control DC Motors
Pinball: The Eagle Schematic All of the circuits into an Eagle schematic
Pinball: The Printed Circuit Board 1.0 The first Eagle PCB layout of the printed circuit board
Pinball: The PCB Version 1.0 Fail Problems with the first version of the Eagle PCB layout
Pinball: PCB Layout 1.2 Updates using Eagle Fixing the errors on the first two versions of the Eagle PCB
Pinball: Assemble and Reflow the 1.2 PCB Assembling the Eagle PCB
Pinball: Testing the Eagle PCB Firmware to test the newly built Pinball printed circuit board
Pinball: Debugging the Motor Driver Fixing the motor driver PSoC project
Pinball: Hot-Air Reworking the Accelerometer Solder Using a Hot-Air Rework tool to reflow a QFN
Pinball: Debugging the LM317 Power Supply- A Tale of Getting Lucky Debugging the LM317/LM117 power supply

Pinball: Hot Air Solder Reworking the Accelerometer

Summary

If you have to use a hot air solder tool, you are probably having a bad day.  But when you need a hot air solder rework tool, you are very, very glad to have one.  I am sure that there are people who can get a QFN off a printed circuit board without one, but I am not one of them.  It is even more fun to put a QFN back on a board without one.  But, once again, I am not one of those people.

Hot Air Solder

I have a Metcal HCT-900-11 Hand Held Convection Rework tool aka Hot Air Solder tool.  This machine can blow out hot air … really, really hot air, up to about 950 degrees Fahrenheit.  I’m pretty sure you could cut your arm off with it.  The tool has a bunch of nozzles of different shapes and sizes.  Using one of these things is an art form because you need to get the temperature right, the airflow right, the distance from the board right or you will find yourself blowing components off the board and making things worse.

Metcal HCT-900 Hot Air Solder Tool

Pinball machine PCB Solder Problem

In the post where I discussed the first test of the Pinball board I told you that the power supply was not working.  It turns out that the cause of the problem was a big blob of solder under the accelerometer.  To fix that problem I had to remove the tiny little 3x3mm QFN accelerometer using the hot air solder tool.  Once I did, there was a big mess of solder under the package which I cleaned up with a braided copper wick and a soldering iron.  I suspect that I put too much solder onto the pads with the metal stencil when I built the board.

Here is what the board looked like after I cleaned it up:

Pinball PCB Solder Problem

And here is a picture of the damn tiny chip.  The problem with all of these chips is they are meant to be used in cell phones, so they are as small and thin as possible.  And to make matters worse, the pads are on 0.5mm pitch or smaller.

0.5mm QFN with solder problems

Hot Air Solder Rework

When I first started fighting with these QFN problems, I talked to the guys in the Cypress Development Kit team in India.  The manager of the group recorded this video of Jesudasan Moses, who is a wizard with hot air solder tools and a soldering irons.  This video was a huge help and I am grateful to them for recording it.

To fix my problem I followed the same process.  Here is the video:

After three attempts, I got the chip  mostly on.  As you can see in the picture below, I was missing a connection to one of the pins.  The other problem was that I melted the screen with the hot air.  Suck.

Hot Air Solder rework of 5mm QFN

After I touched up that pin with a soldering iron I still couldn’t talk to it with the PSoC, and I didn’t have easy access to the I2C bus to figure out what was going on.  In the future I need to make sure that there is a place to plug into the I2C bus to debug network traffic.  I will add this to my PCB design guidelines.

Back to the soldering iron to fix it.  I started by putting some flux on the pins of the QFN package.  Then, I draged a very fine tipped iron with a little bit of solder on it across the pins.  After a couple of rounds of this, I got the chip working.  I still need to cleanup the flux, but here is a picture of one side:

Shorts between pins in 0.5mm QFN

And here is a picture of the other side.  You can see that I mangled the capacitor to the right during the rework process.

Hot Air Solder Repaired QFN

I think that a significant source of problems was not having the entire underside of the QFN with Solder Mask.  That would have helped repel the solder and kept the blob from forming.  I think that I will add that to the checklist as well.

Unfortunately when I was looking at the layout trying to figure out what was going on, I realized that the accelerometer interrupt pin was not connected to the PSoC.  This happened because I had the pins connected by “name” in the schematic.  This is something else that I will add to the checklist.

Using a hot air solder tool is definitely an art form.  One that I will need to practice quite a bit before I get to anywhere near Jesusdan level of skill.

You can find all of the source code and files at the IOTEXPERT site on github.

Index Description
Pinball: Newton's Attic Pinball An introduction to the project and the goals
Pinball: Lotsa Blinking LEDs Everyone needs a bunch of LEDs on their Pinball Machine
Pinball: Matrix LEDs (Part 1) Saving PSoC pins by using a matrix scheme
Pinball: Matrix LEDs (Part 2) Solving some problems with the matrix
Pinball: Matrix LEDs Component How to turn the Matrix LED into a component
Pinball: A Switch Matrix Implementing a bunch of switches
Pinball: Switch Matrix Component (Part 1) The switch matrix component implementation
Pinball: Switch Matrix Component (Part 2) The firmware for matrix component
Pinball: Switch Matrix Component (Part 3) Test firmware for the matrix component
Pinball: The Music Player (Part 1) The schematic and symbol for a Music Player component
Pinball: The Music Player (Part 2) The Public API for the Music Player component
Pinball: The Music Player (Part 3) The firmware to make the sweet sweet music
Pinball: The Music Player (Part 4) The test program for the music player
Pinball: The Motors + HBridge Using an Bridge to control DC Motors
Pinball: The Eagle Schematic All of the circuits into an Eagle schematic
Pinball: The Printed Circuit Board 1.0 The first Eagle PCB layout of the printed circuit board
Pinball: The PCB Version 1.0 Fail Problems with the first version of the Eagle PCB layout
Pinball: PCB Layout 1.2 Updates using Eagle Fixing the errors on the first two versions of the Eagle PCB
Pinball: Assemble and Reflow the 1.2 PCB Assembling the Eagle PCB
Pinball: Testing the Eagle PCB Firmware to test the newly built Pinball printed circuit board
Pinball: Debugging the Motor Driver Fixing the motor driver PSoC project
Pinball: Hot-Air Reworking the Accelerometer Solder Using a Hot-Air Rework tool to reflow a QFN
Pinball: Debugging the LM317 Power Supply- A Tale of Getting Lucky Debugging the LM317/LM117 power supply

Pinball: Debugging the PSoC Motor Driver

Summary

I spent a lot of time the last few days building and testing the Pinball board.  This morning when I plugged in my oscilloscope to test the PSoC motor driver, I saw this:

Pinball Machine PSoC Motor Driver Bug

Here is a screenshot directly from the oscilloscope.  When I saw this, I wondered what was going on.  Why does the driver pull-up very quickly, but have some kind of RC delay on the pull-down?  This was particularly troubling as the PWM was set to 50 Hz (see on the picture where the (1) Freq is showing the measurement)

Broken Motor Driver Output

Things got much worse when I increased the frequency to 500 Hz.  In fact, the motor driver doesn’t pull-down at all.

Crazy PWM Output

PSoC Motor Driver

So where do I start debugging?  First I looked at the PSoC Creator schematic.  When you look at the schematic you can see that I took the PWM output and steered it to either M0L or M0R (or M1L or M1R).  Then I used a control register to flip it.

PSoC Motor Driver Schematic (broken)

The M0R/M0L signals are used to control the switches on the H-Bridge.  Here is the actual schematic from the PCB:

PSoC Motor Driver Schematic

I chose the Toshiba TB6612FNG motor driver chip for this design.  It has two H-Bridges built in and is the same one that we used on the PSoC 211 Robot.  You can see from the schematics above that I save 1 pin by attaching the PWM input to “H(igh)” and that I pulse either In1 or In2.

Hbridge Schematic

When you look at this table, or the schematic, you’ll see my problem.  I connected one of the inputs to “L”  That means that the NMOS switch that controls the pull-down is always off.  When the PWM is low, there is no pull-down.  That explains the funny RC pull-down, which is just some leakage on that node.

HBridge Truth Table


To fix this, I make this change to my PSoC Creator schematic.  In this configuration I get the following:

CR=00 the output = 00 (stop)

CR=02 the output = 1PWM = CCW

CR=03 the output = PWM1 = CW

PSoC Motor Driver Schematic

Now when I run this thing, here is what I get (at my desired 20KHz):

Oscilloscope of functioning PSoC Motor Driver

And finally a video showing the PSoC Motor Driver working:

Pinball: Driving the OLED using the U8G2 Library

In the previous Pinball post, I wrote about getting the OLED going and getting the footprint onto my printed circuit board.  Now I need to make PSoC firmware to drive the display.  I turns out that there are a number of different driver chips out there including at least SSD1306, SH1106, LD7032, SSD1325, and ST7920 that handle multiplexing the columns/rows, managing frame buffers, power management, etc.  To make matters more fun, these chips support I2C, 3&4 wire SPI and a couple of different parallel interfaces (6800, 8080).  I certainly didn’t want to go down the rathole of building up a complete driver library.  But I didn’t have to, as it turns out that that Oliver Kraus built and open-sourced a very nice library that you can get at www.github.com/olikraus/u8g2.  This library (and its predecessor u8glib) seem to be in pretty wide use in Arduino and Raspberry Pi.

In order to make the library work with the PSoC I had to do several things

  1. Download it from GitHub (git clone git@github.com:olikraus/u8g2.git)
  2. Created a new PSoC4200M project for the CY8CKIT-044 (which was the devkit that I happened to have sitting next to my computer)
  3. Change the build settings (right click on the project and select building settings) then add the directory in “Additional Include Directories” and include the “u8g2/csrc” directory.
  4. Add the header files to the project by right clicking and selecting “Add->Existing item” so that the project can f
  5. Add the U8G2 C-Files to the project (same as step 4 but add the C files)
  6. Build a schematic which has an I2C (for the display) and a debugging UART.  The I2C is configured as a master with 400kbs data rate.  The UART uses the default configuration.
  7. Assign the pins

Now I am ready to build some firmware that will drive the display.  In order to use the library with a PSoC I need to create two functions for the U8G2 HAL to use as an interface to the PSoC hardware.  You initialize the U8G2 system with a call to the u8x8_Setup function.  In that call you need to provide function pointers too the two HAL functions

  1. The GPIO and Delay Interface
  2. The byte oriented communication interface

This is an example of the setup required:

The GPIO and Delay interface is used by the byte oriented communication functions to read/write the GPIOs and provide delays.  This function provides the underpinnings of a bit-banged I2C, UART, SPI etc.  Because I am only going to use PSoC Hardware to provide the I2C interface I will only respond to the delay messages.  All of the delay functions are implemented as busy wait loops, which I am not a big fan of.  The input to the function is a “message” that is one of a sprawling list of #defines in the file u8x8.h.  I believe that I found all of the possible cases, but I am not sure.

The first message, UX8X8_MSG_GPIO_AND_DELAY_INIT doesnt need to do anything because the GPIOs are configured correctly by the default.

I did not respond to the messages of the form U8X8_MSG_GPIO_X which are the read and write of the GPIOs as I am not going to use the bit-banged interface.

The other function that needs to be provided is the byte-oriented communication function.  This function needs to respond to the messages to start, send, and end communication.  I just mapped those messages onto the PSoC hardware APIs.  While I was trying to understand what was happening with the system I implemented a debugging UART which you can see in the #ifdef DEBUG_UART sections.

You can find all of the source code and files at the IOTEXPERT site on github.

Index Description
Pinball: Newton's Attic Pinball An introduction to the project and the goals
Pinball: Lotsa Blinking LEDs Everyone needs a bunch of LEDs on their Pinball Machine
Pinball: Matrix LEDs (Part 1) Saving PSoC pins by using a matrix scheme
Pinball: Matrix LEDs (Part 2) Solving some problems with the matrix
Pinball: Matrix LEDs Component How to turn the Matrix LED into a component
Pinball: A Switch Matrix Implementing a bunch of switches
Pinball: Switch Matrix Component (Part 1) The switch matrix component implementation
Pinball: Switch Matrix Component (Part 2) The firmware for matrix component
Pinball: Switch Matrix Component (Part 3) Test firmware for the matrix component
Pinball: The Music Player (Part 1) The schematic and symbol for a Music Player component
Pinball: The Music Player (Part 2) The Public API for the Music Player component
Pinball: The Music Player (Part 3) The firmware to make the sweet sweet music
Pinball: The Music Player (Part 4) The test program for the music player
Pinball: The Motors + HBridge Using an Bridge to control DC Motors
Pinball: The Eagle Schematic All of the circuits into an Eagle schematic
Pinball: The Printed Circuit Board 1.0 The first Eagle PCB layout of the printed circuit board
Pinball: The PCB Version 1.0 Fail Problems with the first version of the Eagle PCB layout
Pinball: PCB Layout 1.2 Updates using Eagle Fixing the errors on the first two versions of the Eagle PCB
Pinball: Assemble and Reflow the 1.2 PCB Assembling the Eagle PCB
Pinball: Testing the Eagle PCB Firmware to test the newly built Pinball printed circuit board
Pinball: Debugging the Motor Driver Fixing the motor driver PSoC project
Pinball: Hot-Air Reworking the Accelerometer Solder Using a Hot-Air Rework tool to reflow a QFN
Pinball: Debugging the LM317 Power Supply- A Tale of Getting Lucky Debugging the LM317/LM117 power supply