Summary
A description of an analytic model to adjust pressure sensor depth data to reflect measured data.
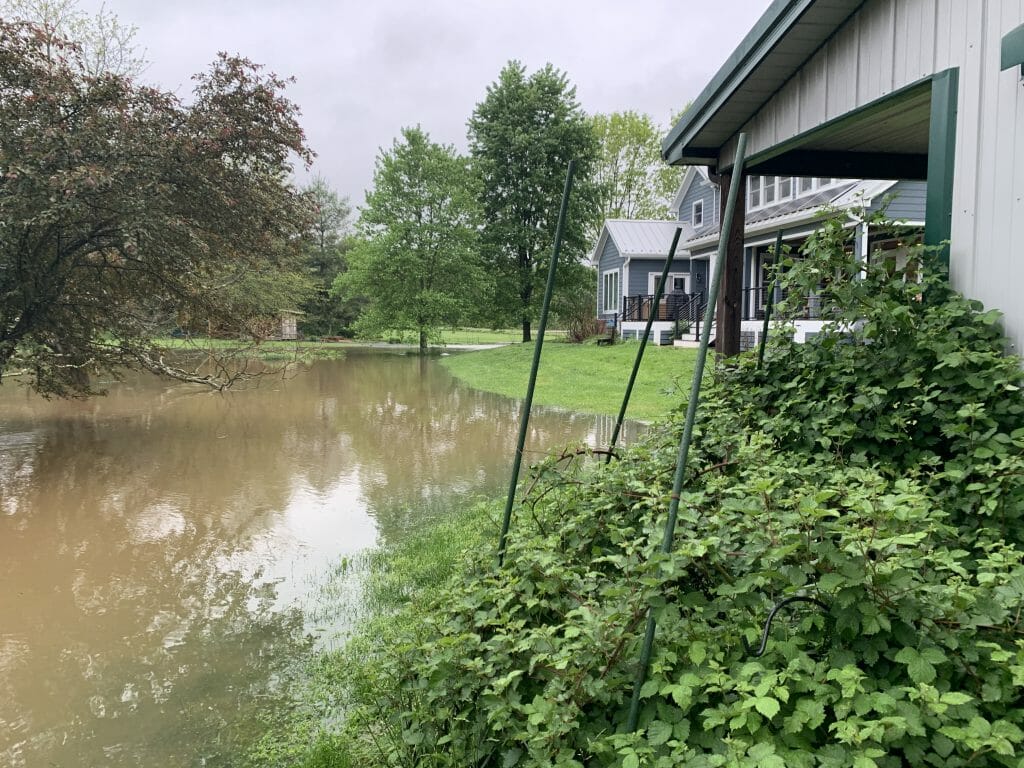
Story
About a year ago I repaired my Creek Water Level sensing system. At that time I installed a new pressure sensor into the system (which had been blown up). When I did the surgery I did not have data to recalibrate the system. All along I knew that the system was reading low by about 1 foot or so. I am in America, I do Imperial measurement 🙂 But I didn’t really know exactly how much. I also knew that my original calculate used 0.53ft/psi as the conversion to depth. This is only true with pure water at about 80 degrees F which meant that it was something else for muddy creek water.
Well on Wednesday last week I had a flood. So I got the opportunity to collect some real data on the conversion
Old School Measurement
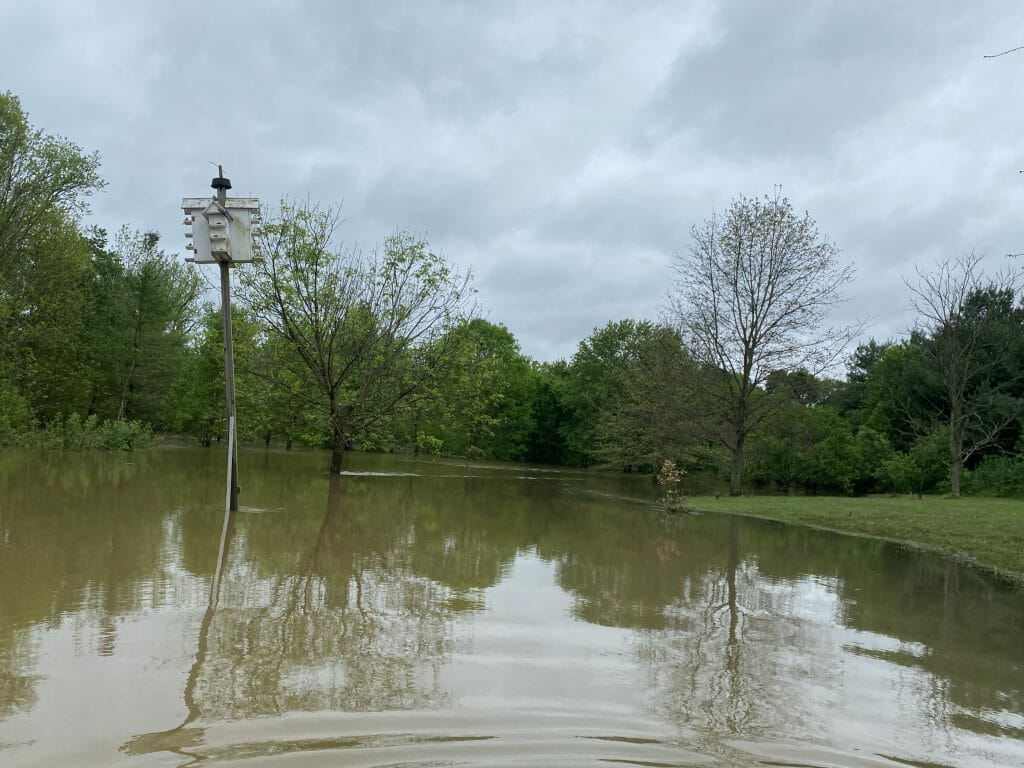
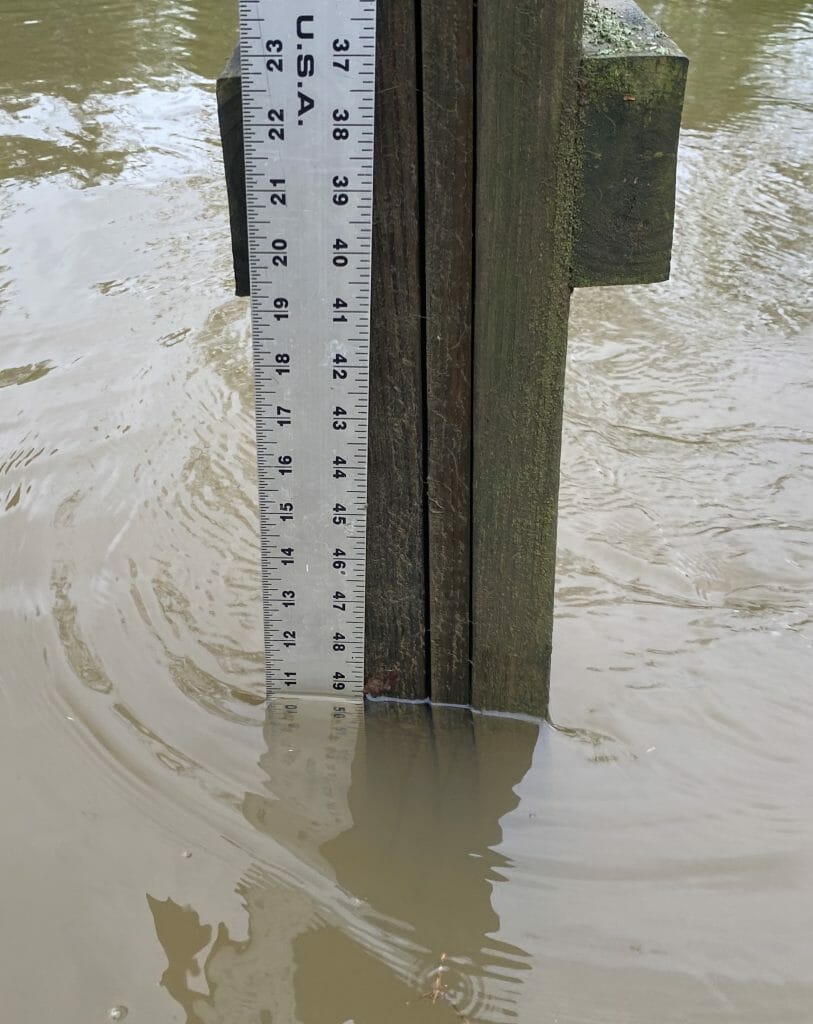
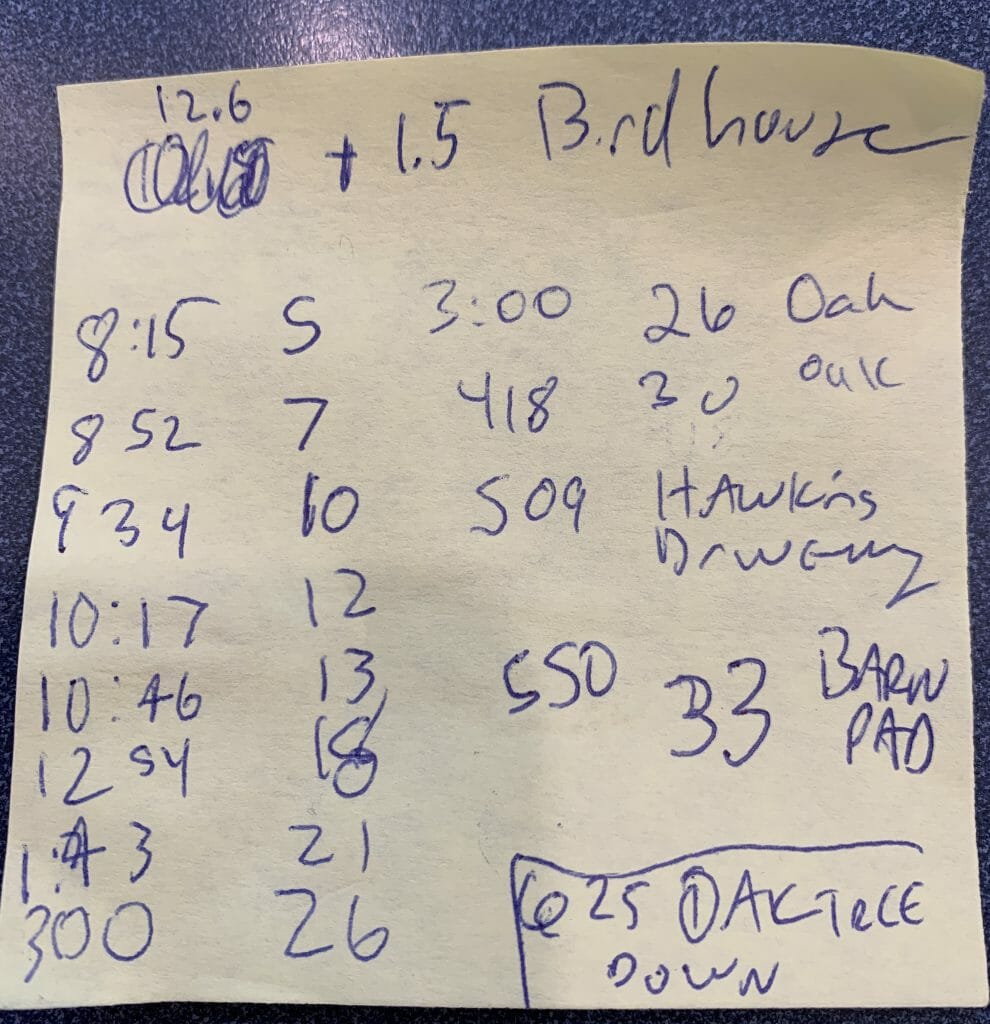
A couple of years ago a friend an I went out with a site level and measure a bunch of marker points, including the base of this treehouse which I know is 12.6 feet over the normal creek level. When I woke up and saw that the flood was going strong I went out with a long ruler and screwed it into the post holding up the birdhouse.
Here is how it looks close up.
Collect the Data
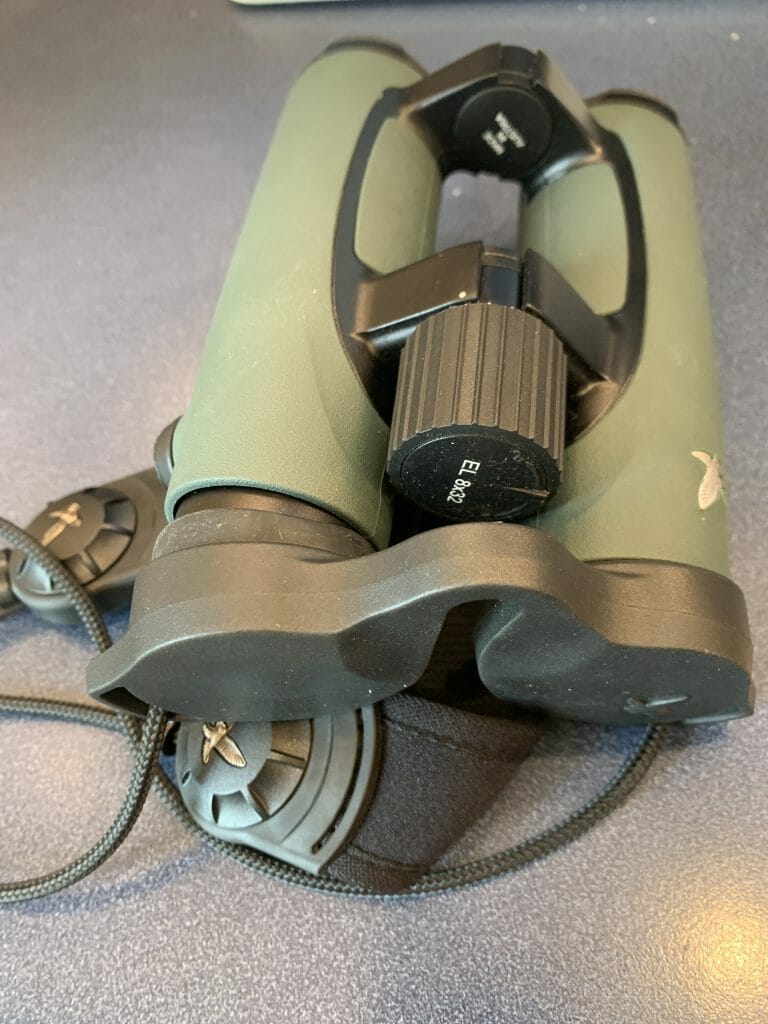
Unfortunately as the water went higher and higher the only way to collect the data was with a pair of (bad-ass) binoculars.
Over the course of the flood, my children and I would occasionally go out and collect the data.
The next morning I did two things.
- Entered the data into a table.
- Used mysql to look up the sensor readings at the same time we took the measurement.
Here is the data:
| Time | Ruler | Ruler + BH | Sensor | Measure |
| 8:15 | 5 | 23 | 13.0 | 14.6 |
| 8:52 | 7 | 25 | 13.4 | 14.8 |
| 9:34 | 10 | 28 | 13.3 | 15.0 |
| 10:17 | 12 | 30 | 13.5 | 15.2 |
| 10:46 | 13 | 31 | 13.6 | 15.3 |
| 12:54 | 18 | 36 | 14.0 | 15.7 |
| 13:43 | 21 | 39 | 14.2 | 16.0 |
| 15:00 | 26 | 44 | 14.7 | 16.4 |
| 16:18 | 30 | 48 | 15.0 | 16.7 |
| 17:50 | 33 | 51 | 15.2 | 17.0 |
| 7:55 | 15 | 33 | 13.8 | 15.5 |
Analyze the Data
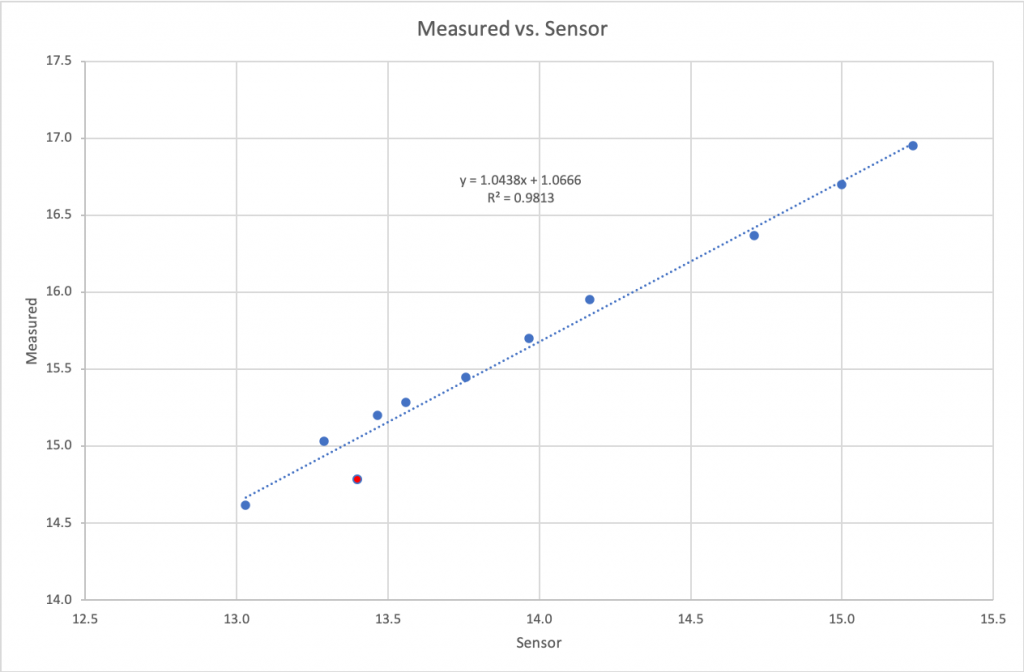
The next step was to analyze the data. So, I created an x-y plot. Notice the red datapoint almost certainly was read in error. The dotted line is an excel created least squares fit of the data.
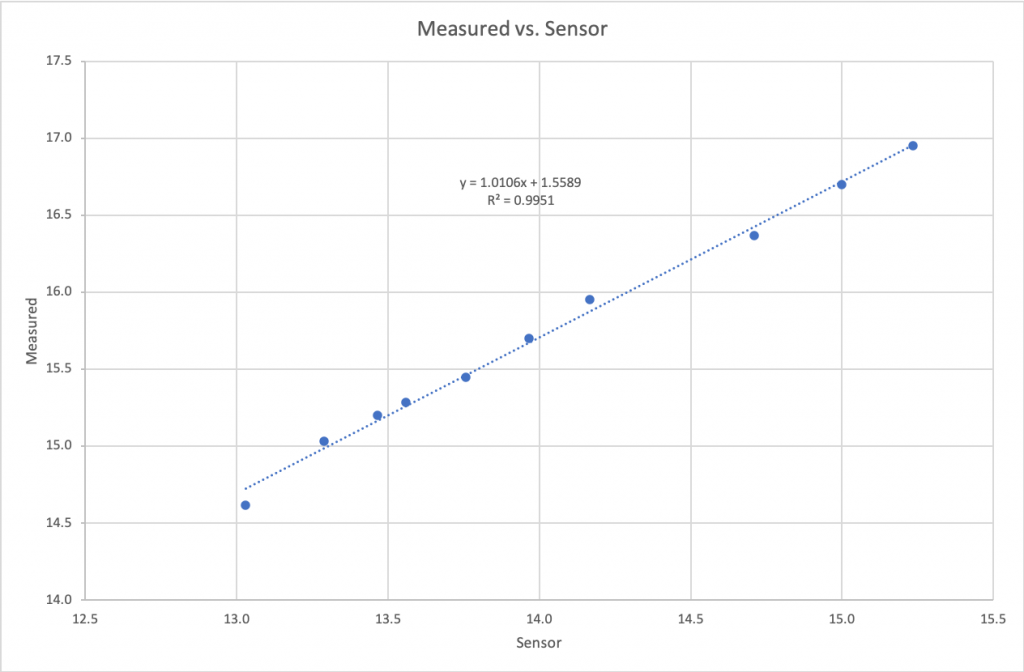
When I remove the red dot I get a correlation coefficient of 0.9951 … that is money in my business.
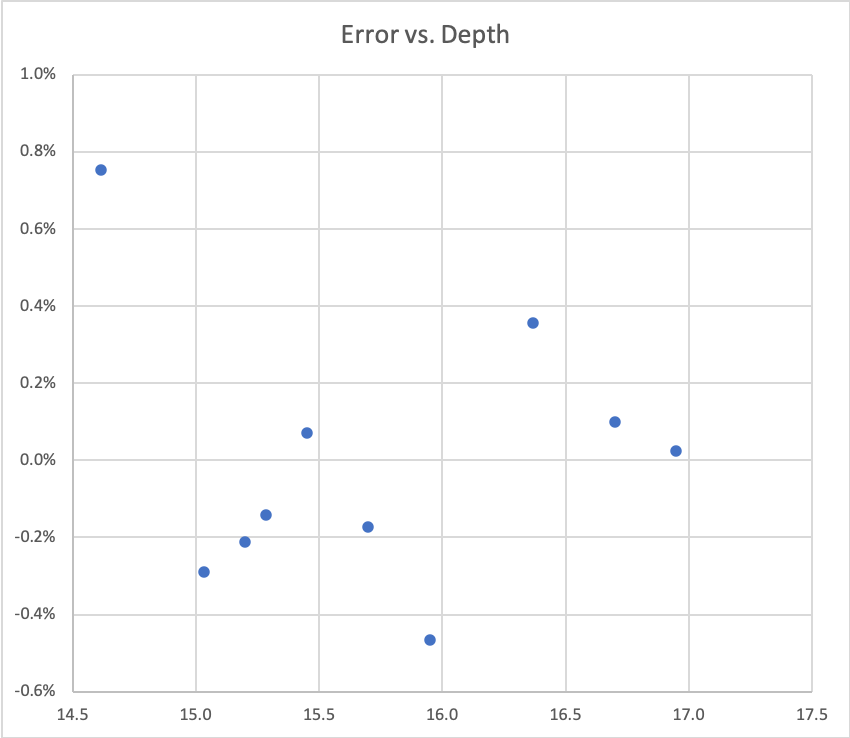
Now when I create column the new model you can see that all of the datapoints are within 1%.
| Time | Ruler | Ruler + BH | Sensor | Measure | Model | Error | RMS |
| 8:15 | 5 | 23 | 13.0 | 14.6 | 14.7 | 0.8% | 0.0 |
| 8:52 | 7 | 25 | 13.4 | 15.1 | |||
| 9:34 | 10 | 28 | 13.3 | 15.0 | 15.0 | -0.3% | 0.0 |
| 10:17 | 12 | 30 | 13.5 | 15.2 | 15.2 | -0.2% | 0.0 |
| 10:46 | 13 | 31 | 13.6 | 15.3 | 15.3 | -0.1% | 0.0 |
| 12:54 | 18 | 36 | 14.0 | 15.7 | 15.7 | -0.2% | 0.0 |
| 13:43 | 21 | 39 | 14.2 | 16.0 | 15.9 | -0.5% | 0.0 |
| 15:00 | 26 | 44 | 14.7 | 16.4 | 16.4 | 0.36% | 0.0 |
| 16:18 | 30 | 48 | 15.0 | 16.7 | 16.7 | 0.10% | 0.0 |
| 17:50 | 33 | 51 | 15.2 | 17.0 | 17.0 | 0.02% | 0.0 |
| 7:55 | 15 | 33 | 13.8 | 15.5 | 15.5 | 0.1% | 0.0 |
| 0.011 |
Here is a plot of the error:
Fix the Firmware
The next step is to update the firmware on sensor system. The comment on line 56 of the code “USC correction model” means that I talked with the guy in charge of transistor device modeling at Infineon/Cypress. He suggested some improvements from my original analysis.
dp.pressureCounts = adc_GetResult16(PRESSURE_CHAN);
            // 408 is the baseline 0 with no pressure = 51.1ohm * 4ma * 2mv/count
            // 3.906311 is the conversion to ft
            // Whole range in counts = (20mA - 4mA)* 51.1 ohm * 2 mv/count = 1635.2 counts
            // Range in Feet = 15PSI / 0.42PSI/Ft = 34.88 Ft
            // Count/Ft = 1635.2 / 34.88 = 46.8807 Counts/Ft

            float depth =( ((float)dp.pressureCounts)-408)/46.8807;

            // Apply the USC correction model
            depth = 1.0106 * depth + 1.5589;

            dp.depth = ( depth + 7*previousDepth ) / 8.0;  // IIR Filter
The last thing to do is fix all of the old data in my database. So I use mysql to update all of the datapoint with the adjusted values since I installed the new sensor.
update creekdata set depth=depth*1.016 + 1.5589 where id>=1749037 AND id<= 1981538;
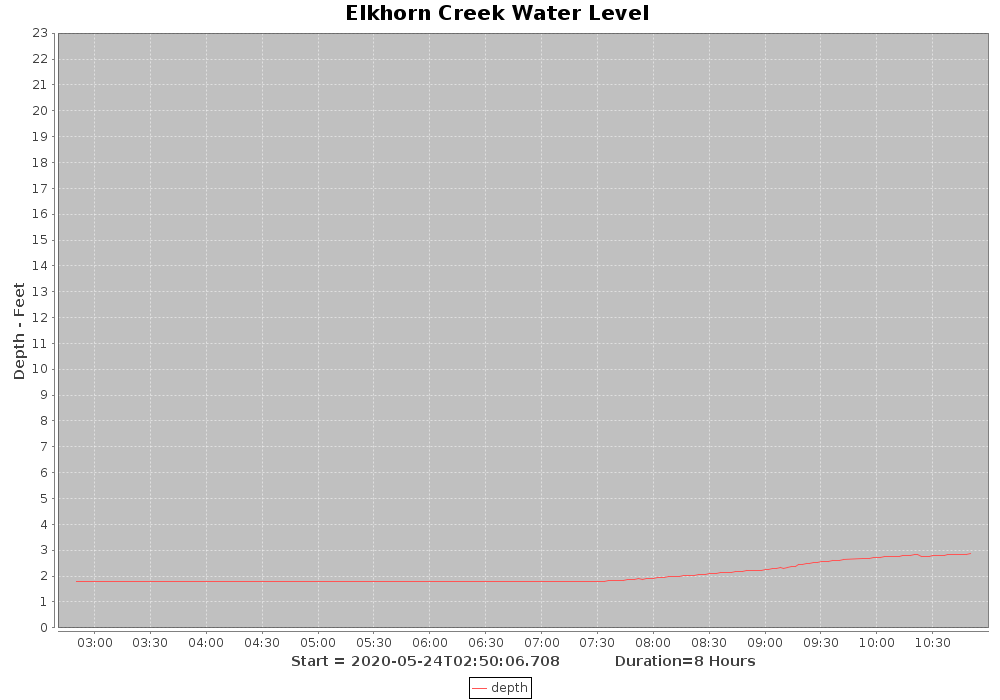
This morning while I was doing the updates the creek started flooding again. Here is the plot where you can see the offset being applied.

And with the offset applied, things are “more better” as my mom would say.
No comment yet, add your voice below!