In the previous post I introduced my IOT Project for the Elkhorn Creek. In this post I provide an overview of each of the building blocks in the system. Currently (because I have some ideas for improvements) there are four major blocks. Over the next few weeks I will write one or more detailed posts for each of the blocks.
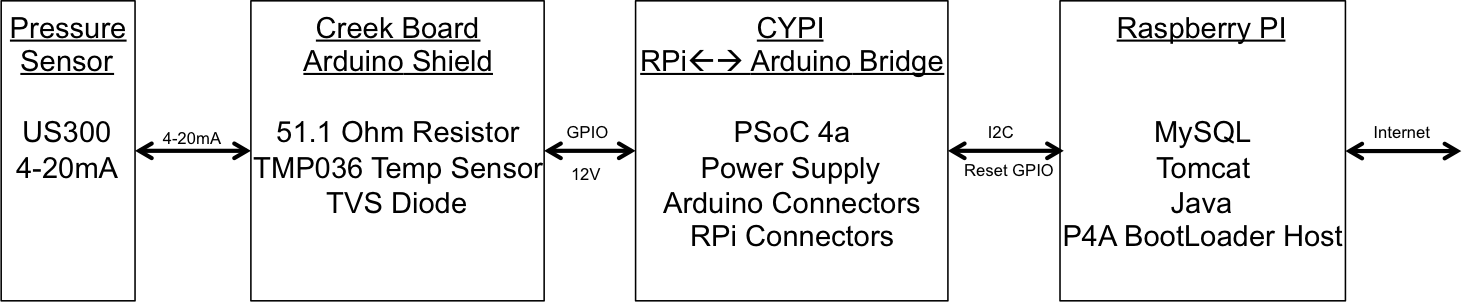
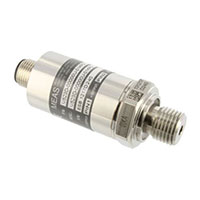
1. Pressure Sensor
The Pressure Sensor is a Measurement Specialties US381-000005-015PG installed into the end of a long PVC pipe. Inside of the pipe there is a ~150 foot long telephone wire which is attached to the Creek Board.
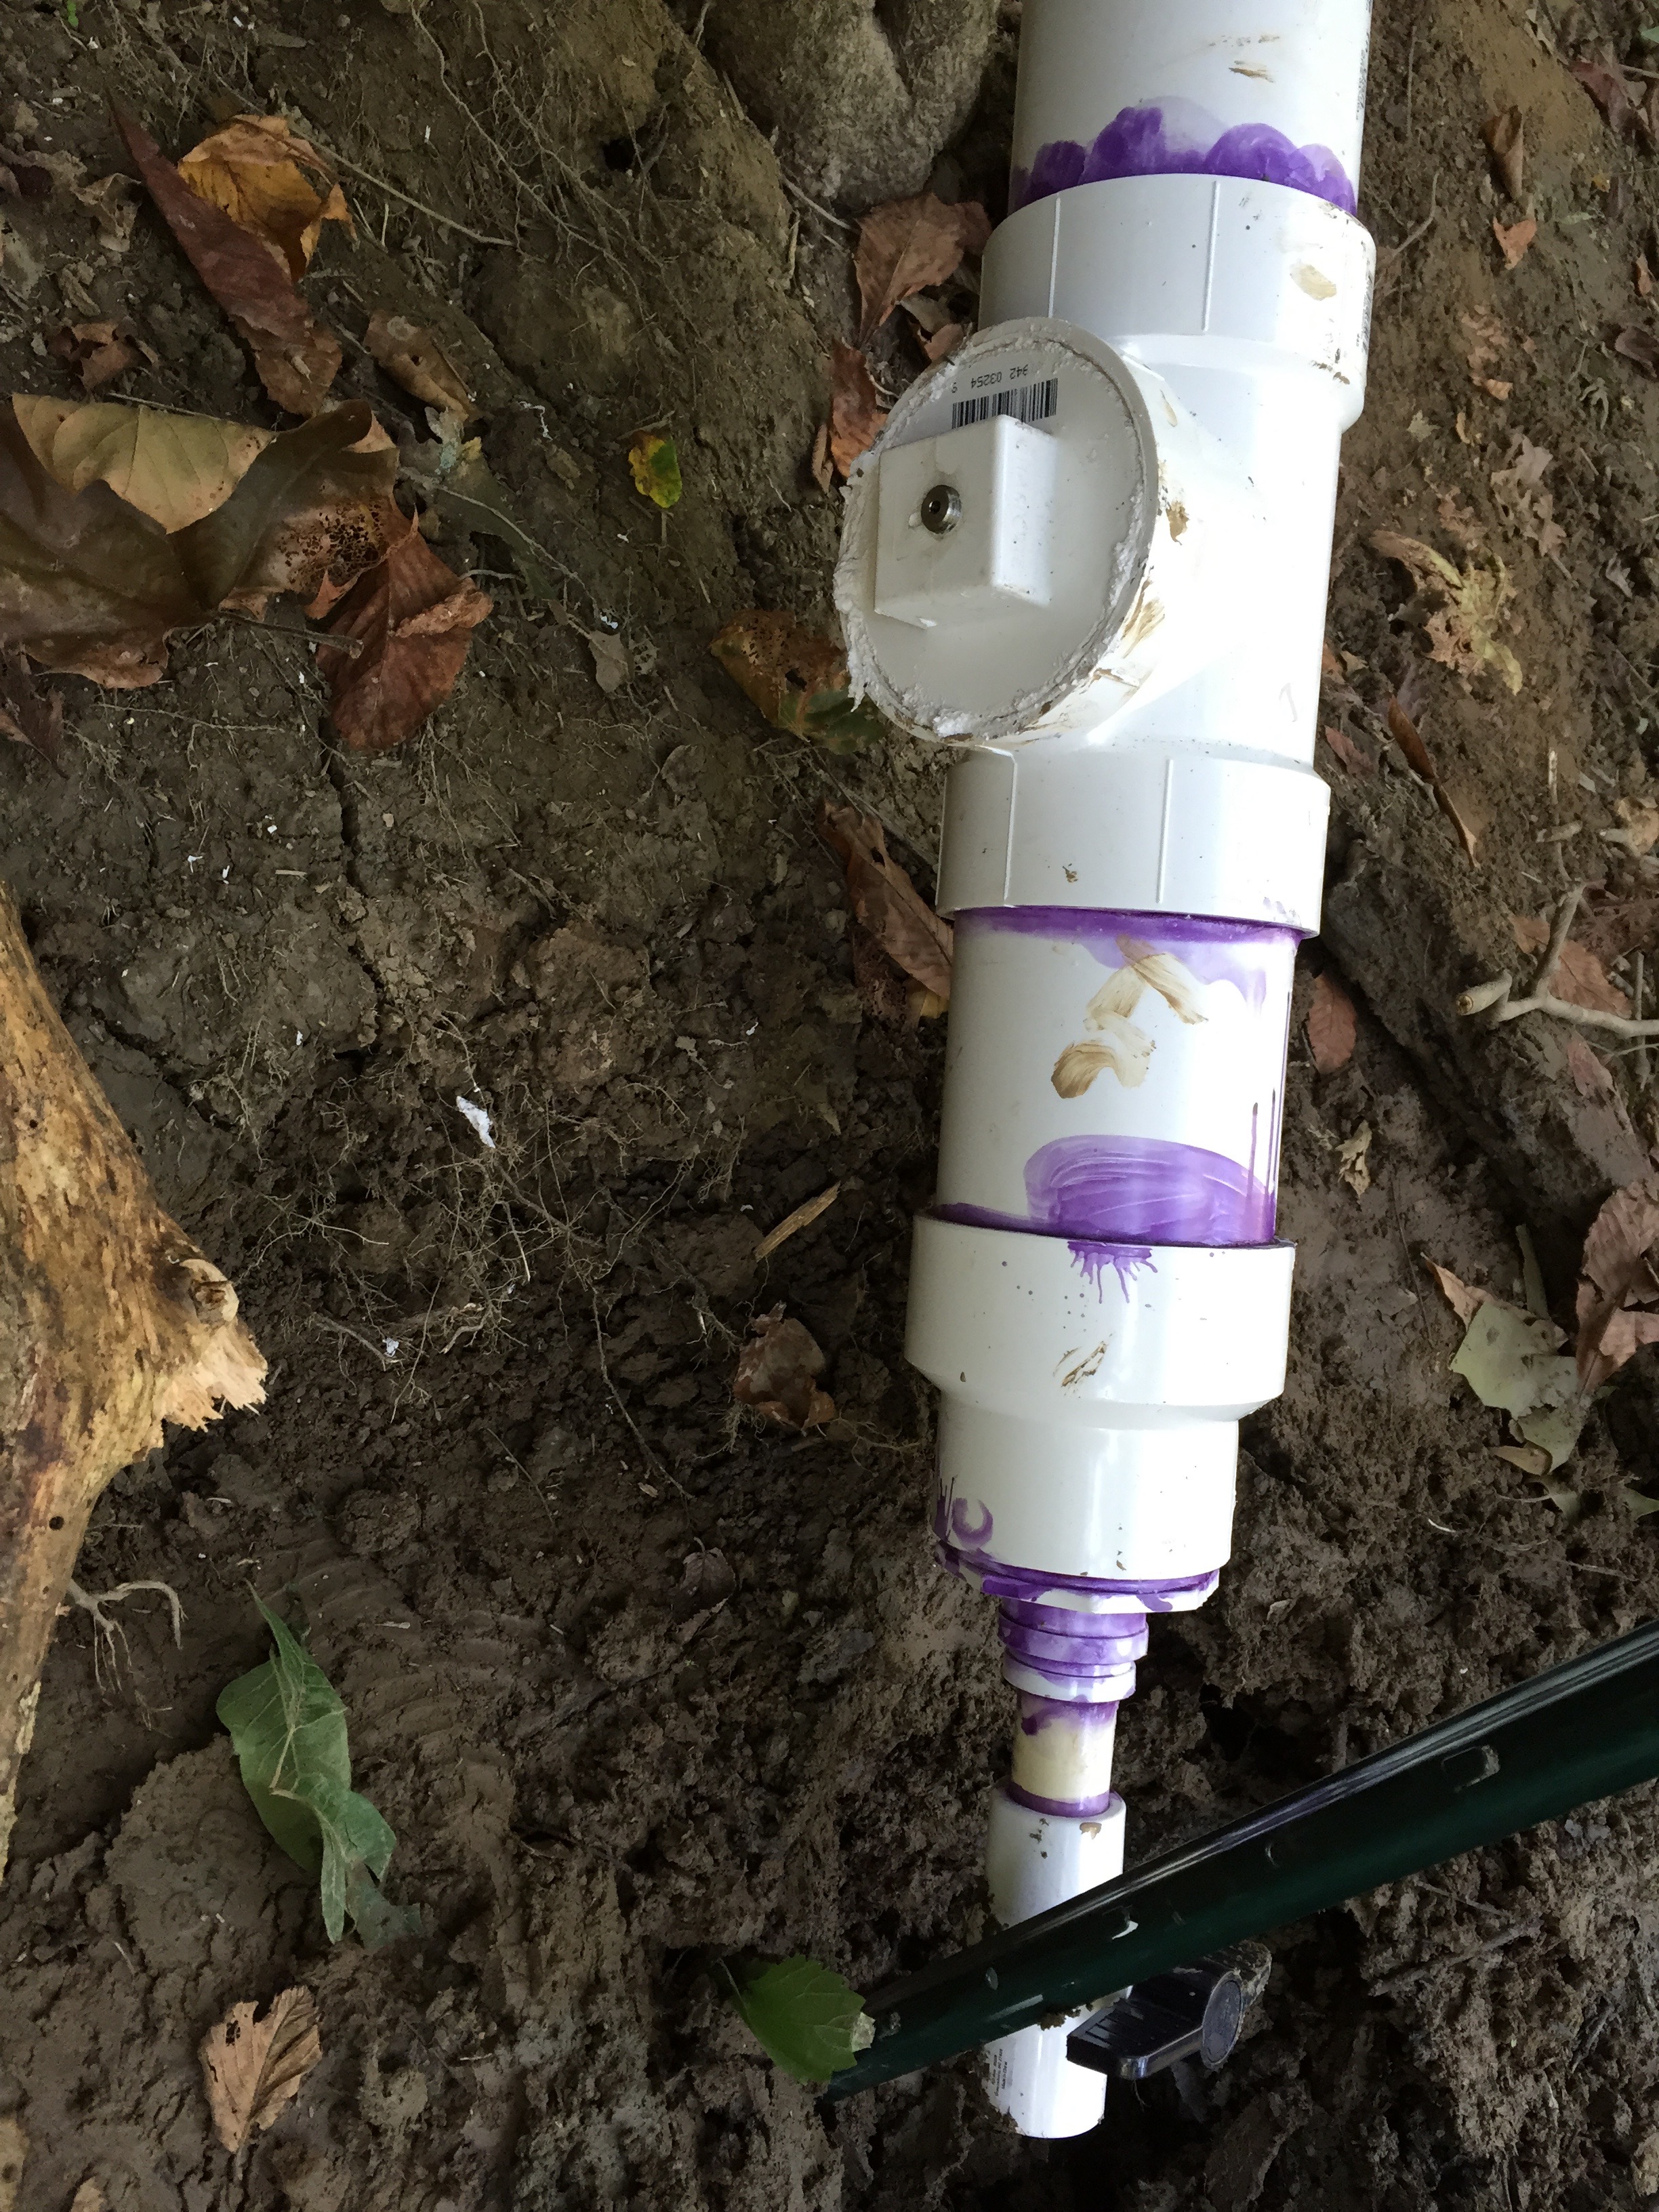 All of the PVC came from Lowe’s and is glued together with PVC cement. At the end of the pipe you can see a ball valve. This valve will allow me to drain out any water that leaks or condenses into the system. This can absolutely happen and in fact killed an earlier revision of the system. The sensor itself is screwed into a 4″ clean-out cap. This will allow me to unscrew the cap and replace the sensor if it is ruined by something. Also, the cap is fairly thick and allowed for more threads on the sensor to grab into the PVC, which also improves my chances of not needing to replace this $142 sensor.
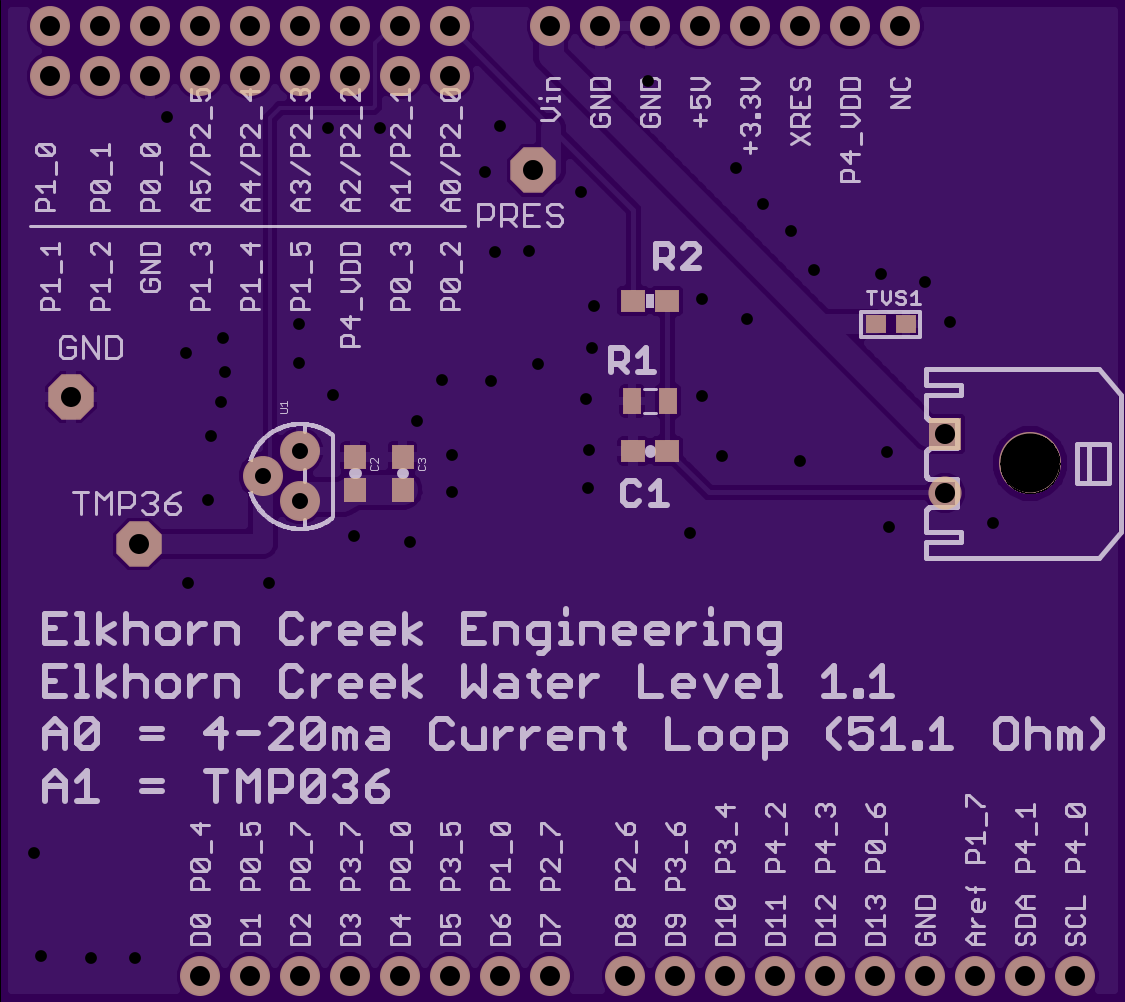
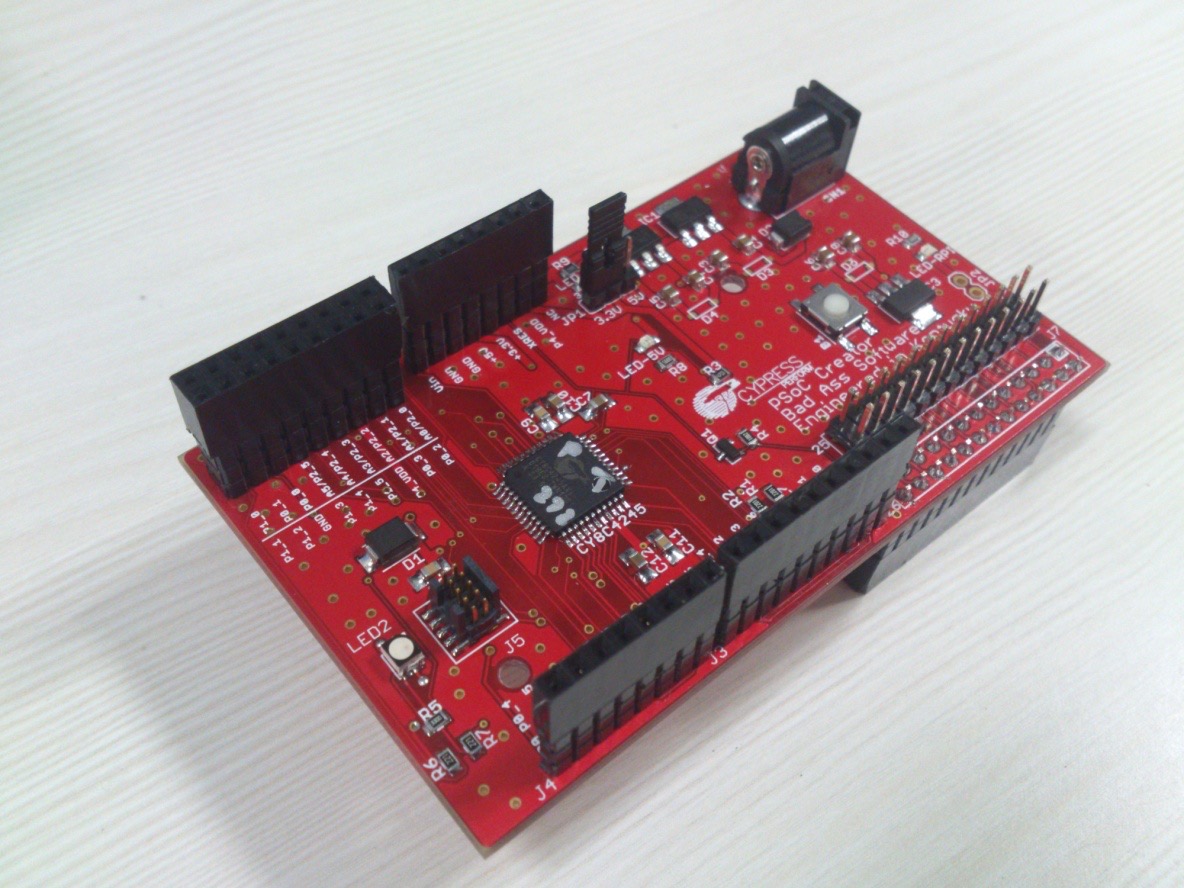
2. The “Creek Board”
The Creek Board is an Arduino Shield that I designed to replace my prototype bread-board. The shield contains:
- The 51.1 Ohm Resistor which turns the current loop into a measurable voltage
- A TMP36 Temperature Sensor which I was originally planning to use for temperature compensation.
- Testpoint’s to measure the voltages with a DMM
- Analog low-pass noise filters for the current loop
- A Transient Voltage Supressor Diode to protect the CYPI board from an ESD event.
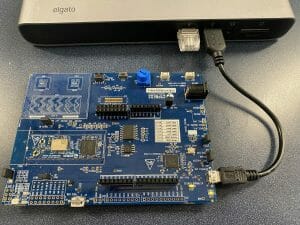
3. CYPI
I designed CYPI to be a “Cypress” to “Raspberry Pi” bridge. On the bottom of the board is a connector that is compatible with the Raspberry Pi GPIOs. On the top of the board are connectors that are compatible with Arduino. On the board is:
- A Cypress PSoC4200 – CY8C4245AXI-483
- A wall wart barrel power connection
- Voltage regulators that allow the entire system to run off of one wall wart
- A 10-pin ARM Program/Debug header
- A reset switch
- A user LED
4. Raspberry PI
The Raspberry PI is a single board linux computer.
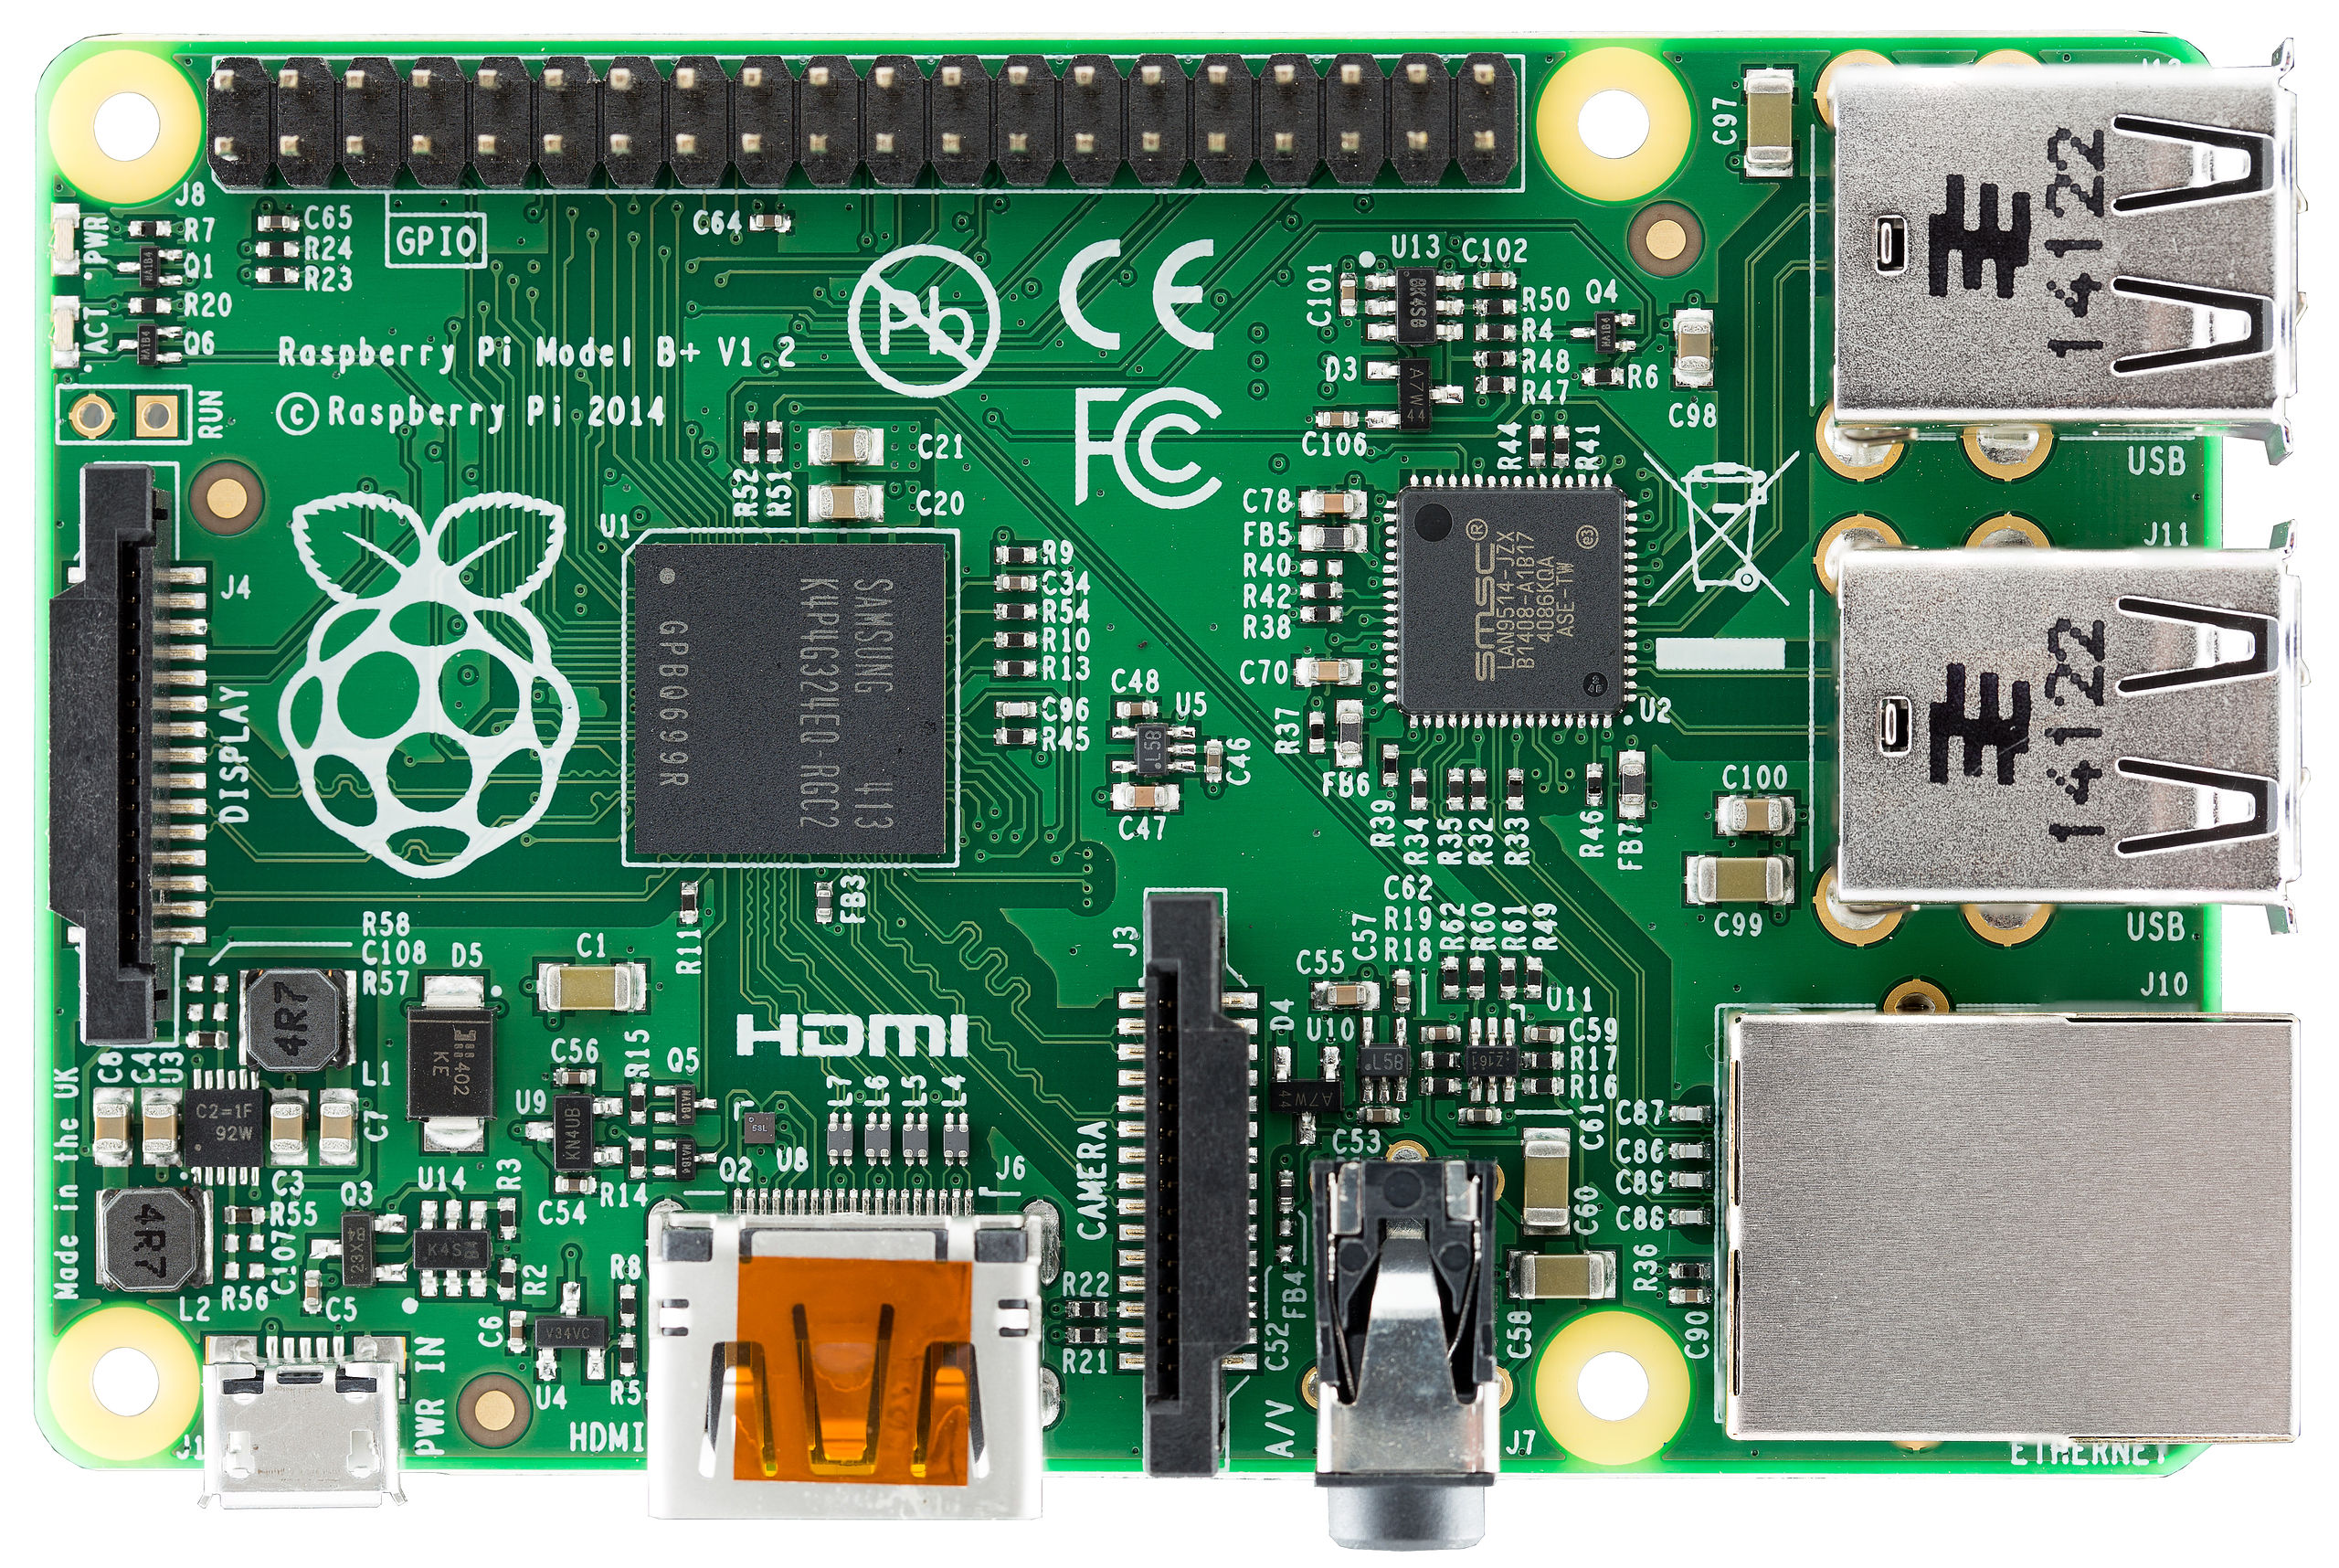
This RPi serves the following tasks
- An I2C Master to read temperature and pressure data from the PSoC4. This task is performed by a Java program that is triggered once per minute by the Linux crontab
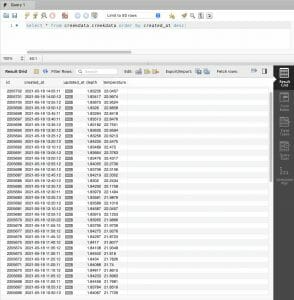
- A MySQL database server to hold the historical data
- A Java program that uses a JDBC connection and JFreeChart to once per minute create a PNG chart of the last 8 hours of data.
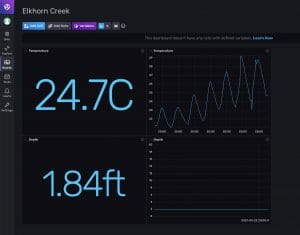
- Tomcat with a Java Server Page (JSP) which dynamically creates the website http://www.elkhorn-creek.org
Index
Description
The Creek: IOT for the Elkhorn Creek
Introduction
The Creek: Solution Architecture 1.0
Overall architecture
The Creek: Creek Board 1.1
Eagle layout of the board
The Creek: Creek Board 1.0 – RCCA
A discussion of the errors in the 1.0 board
The Creek: CYPI, a Raspberry Pi to Arduino Bridge
PSoC4 <--> Raspberry Pi Bridge Board
The Creek: PSoC4 Creator Schematic and Firmware
Firmware to interface with the temperature and pressure sensors
The Creek: Testing the Firmware
Using tools to verify that the PSoC 4 Firmware is working correctly
The Creek: Testing the Bootloader
Make sure that you can load new firmware into the PSoC
The Creek: Software Architecture
All of the Raspberry Pi software connections
The Creek: Install MySql
Instruction to configure MySql
The Creek: Install Tomcat
Instruction to configure Tomcat JSP Server
The Creek: Data Collection Java (Part 1)
The Java program that reads the I2C and saves it in the database
The Creek: Data Collection Java (Part 2)
The Java program that reads the I2C and saves it in the database
The Creek: Create the Chart with JFreeChart
Using open source Java charting software to create plots of the Creek Depth
The Creek: Flood Event Data Processor
A batch program to create analyze the database and create a table of flood events
The Creek: Flood Event Web Page
A batch program to create the flood event web page
The Creek: Creek Server 1.1
Updates to all of the back off server programs to integrate charts
The Creek: JSP Web Page for www.elkhorn-creek.org
The JSP program to make the table and display the website
The Creek: Raspberry Pi Clock Stretching
Sorting out a bug in the system having to do with the Broadcomm Raspberry Pi Master not functioning well with clock stretching
The Creek: Creek Server 1.2
Caching the web pages to make them faster
No comment yet, add your voice below!