The Creek 2.0: AWS IoT Actions & Rules

Summary

In this article, I will show you how to use the AWS IoT rules engine to make the last connection required in the chain of data from the Creek Sensor all the way to the AWS RDS Server.  I will also show you the AWS CloudWatch console.  At this point I have implemented

Let’s implement the final missing box (6) – The AWS IoT Rules

The AWS Rules

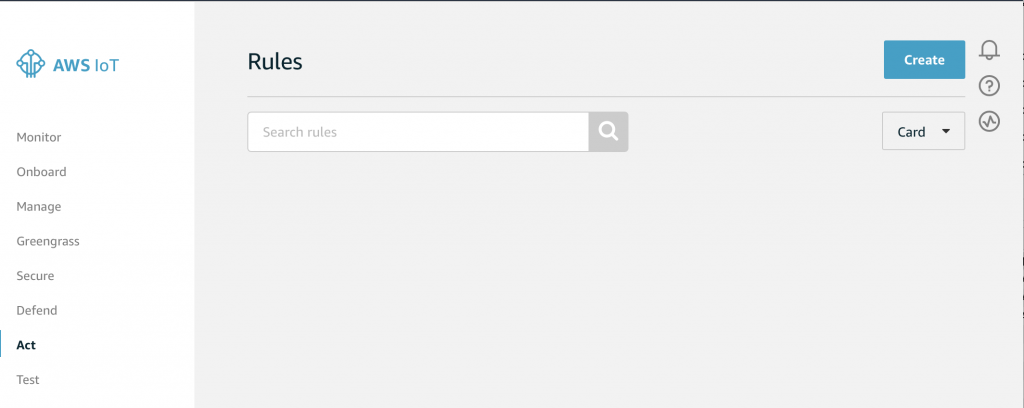
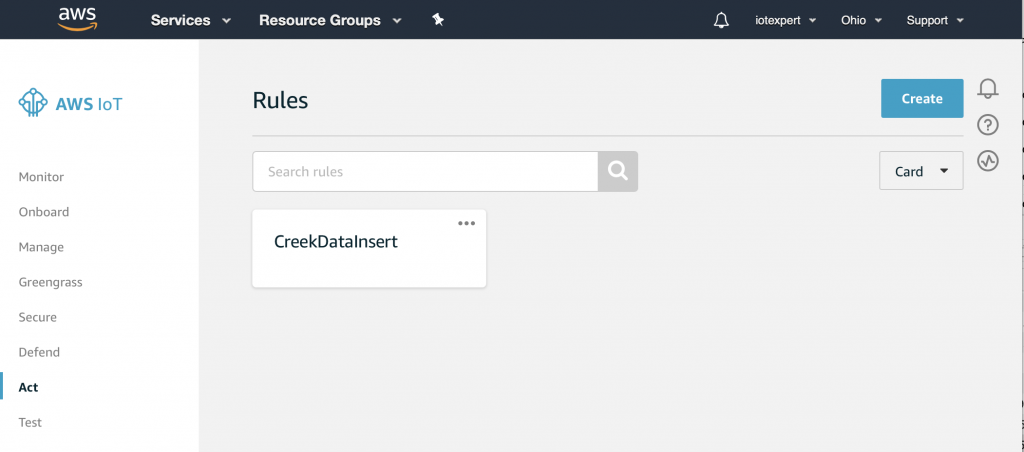
Start by going to the AWS IoT Console.  On the bottom left you can see a button named “Act”.  If you click Act…

You will land on a screen that looks like this.  Notice, that I have no rules (something that my wife complains about all of the time).  Click on “Create” to start the process of making a rule.

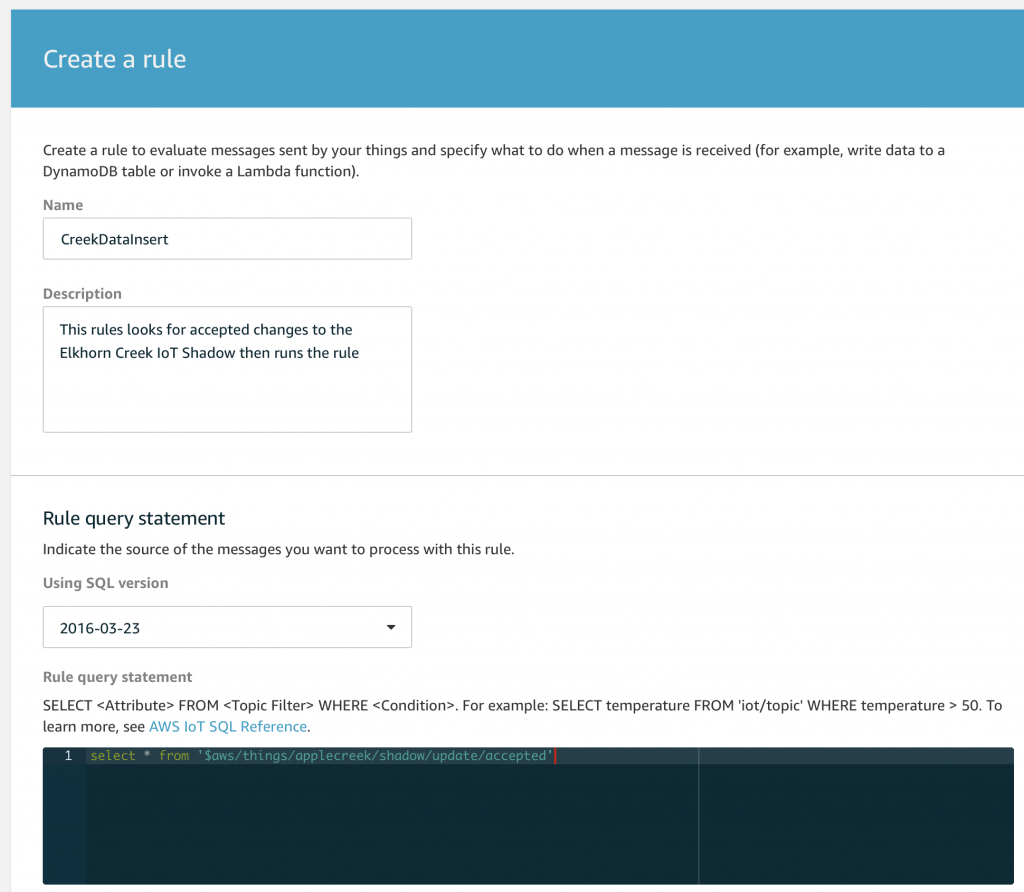
On the create rule screen I will give it a name and a description.  Then, I need to create a “Rule query statement“.  A rule query statement is an SQL like command that is used to match topics and conditions of the data on the topic.  Below, you can see that I tell it to select “*” which is all of the attributes.  And then I give it the name of the topic.  Notice that you are allowed to use the normal MQTT topic wildcards # and + to expand the list to match multiple topics.

Scroll down to the “Set one or more actions” and click on “add action”

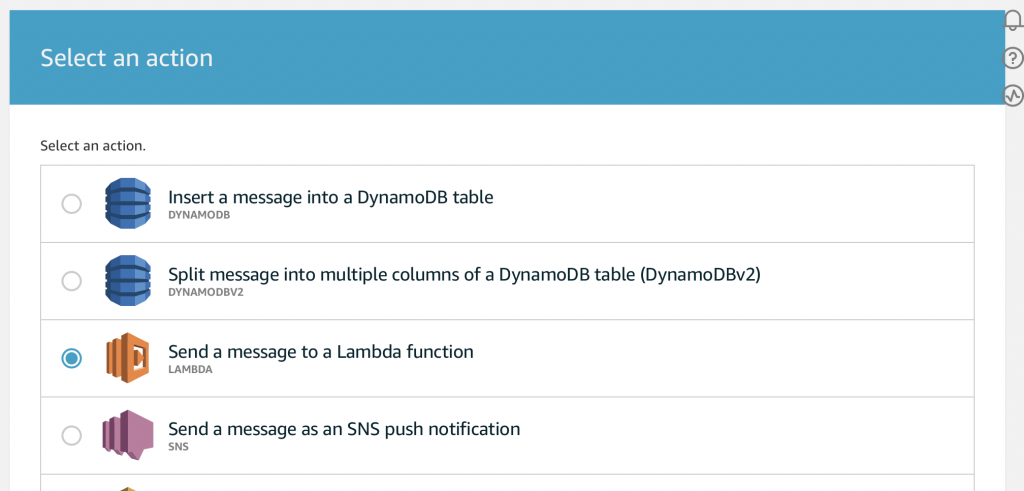
This screen is amazing as there are many many many things that you can do.  (I should try some of the others possibilities).  But, for this article just pick “Send a message to a Lambda function”

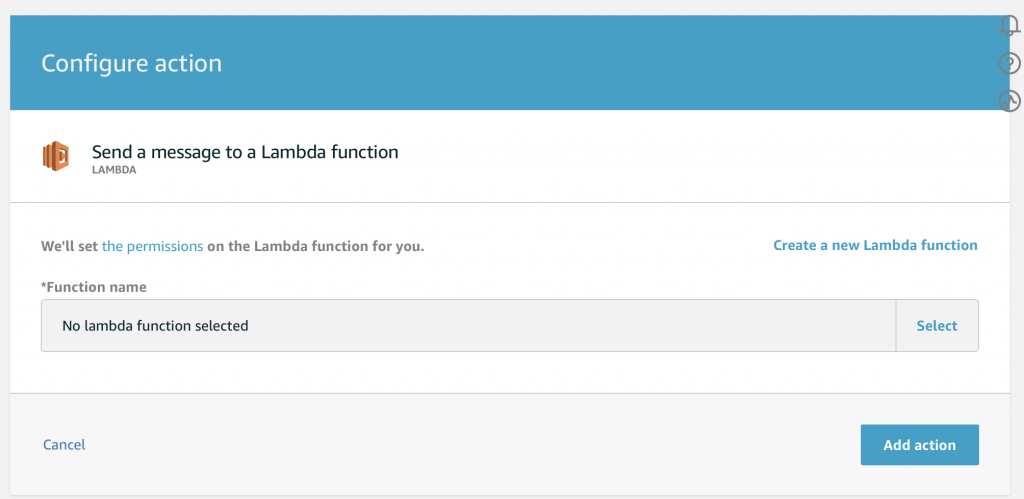
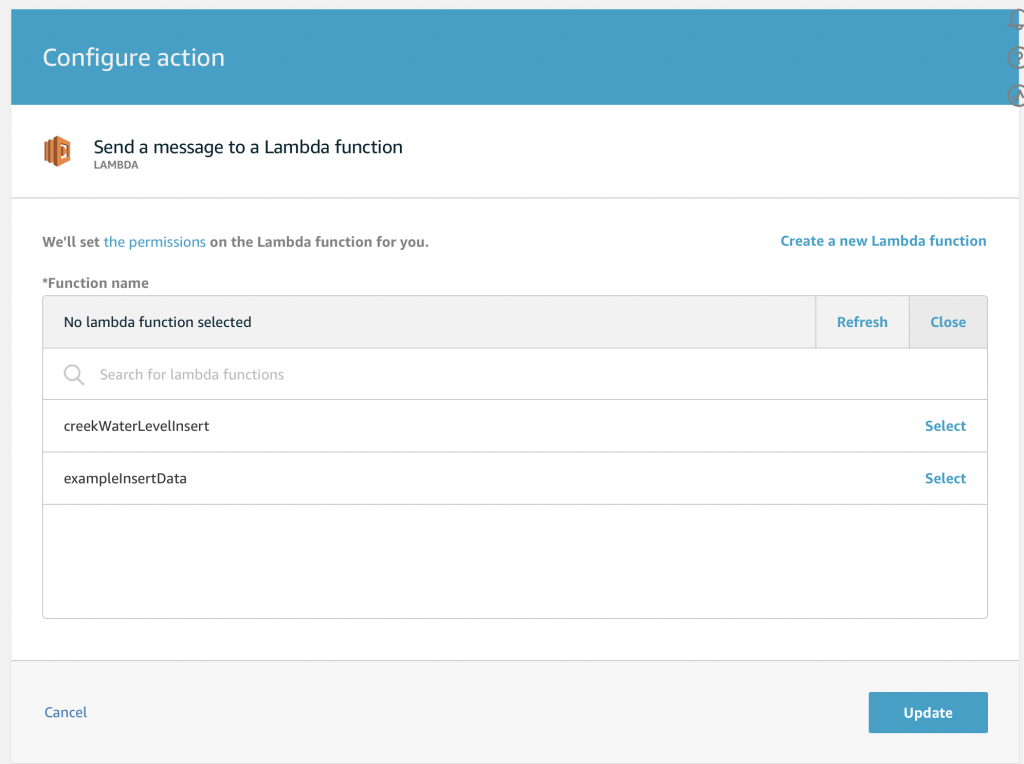
Then press “Select” to pick out the function.

Then you will see all of your Lambda functions.  Ill pick the “creekWaterLevelInsert” which is the function I created which takes the json data and inserts it into my AWS RDS MySQL database.

Once you press “Update”, you will see that you have the newly created rule…

The Test Console

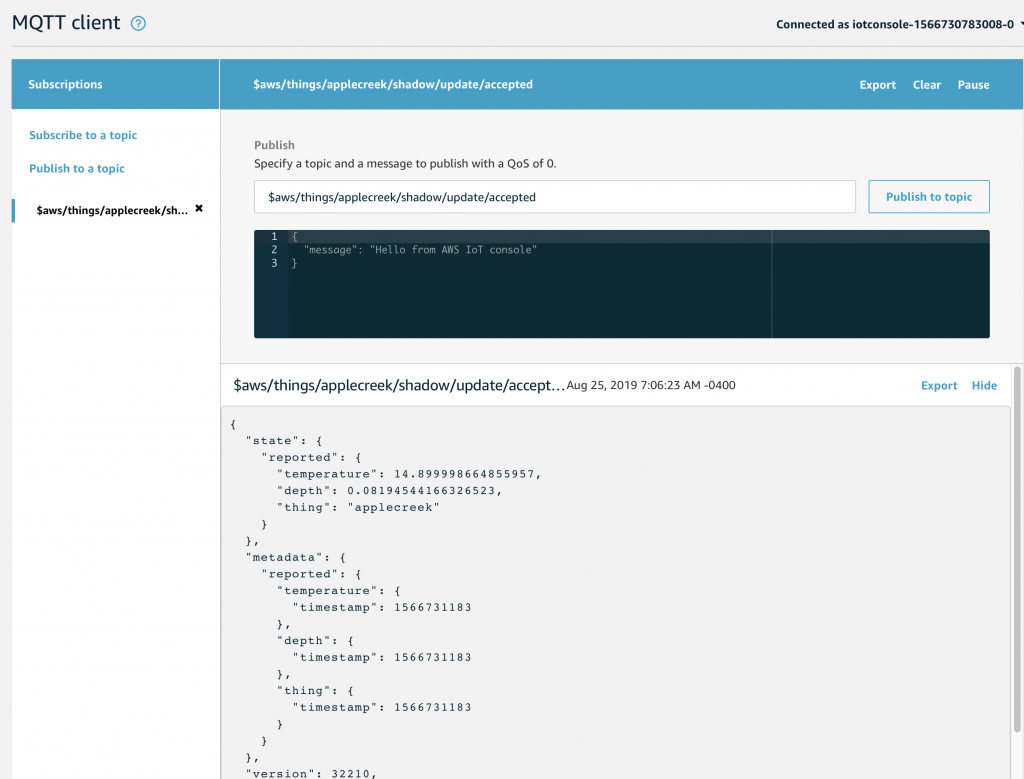
Now that the rule is setup.  Let’s go to the AWS MQTT Test Client and wait for an update to the “applecreek”  thing Shadow.  You might recall that when a shadow update message is published to $aws/things/applecreek/shadow/update if that message is accepted then a response will be published by AWS to $aws/things/applecreek/shawdow/update/accepted.

On the test console, I subscribe to that topic.  After a bit of time I see this message get published that at 7:06AM the Apple Creek is 0.08.. feet and the temperature in my barn is 14.889 degrees.

But, did it work?

 AWS Cloud Watch

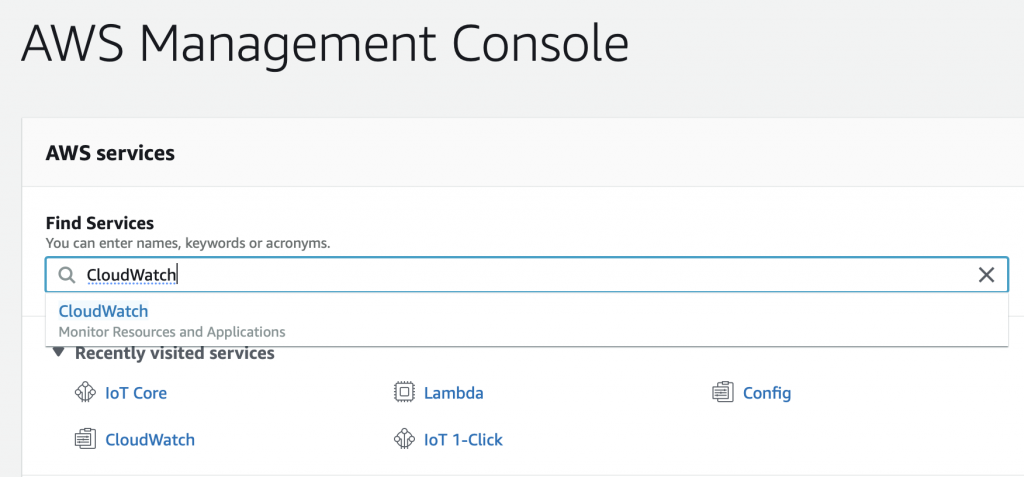
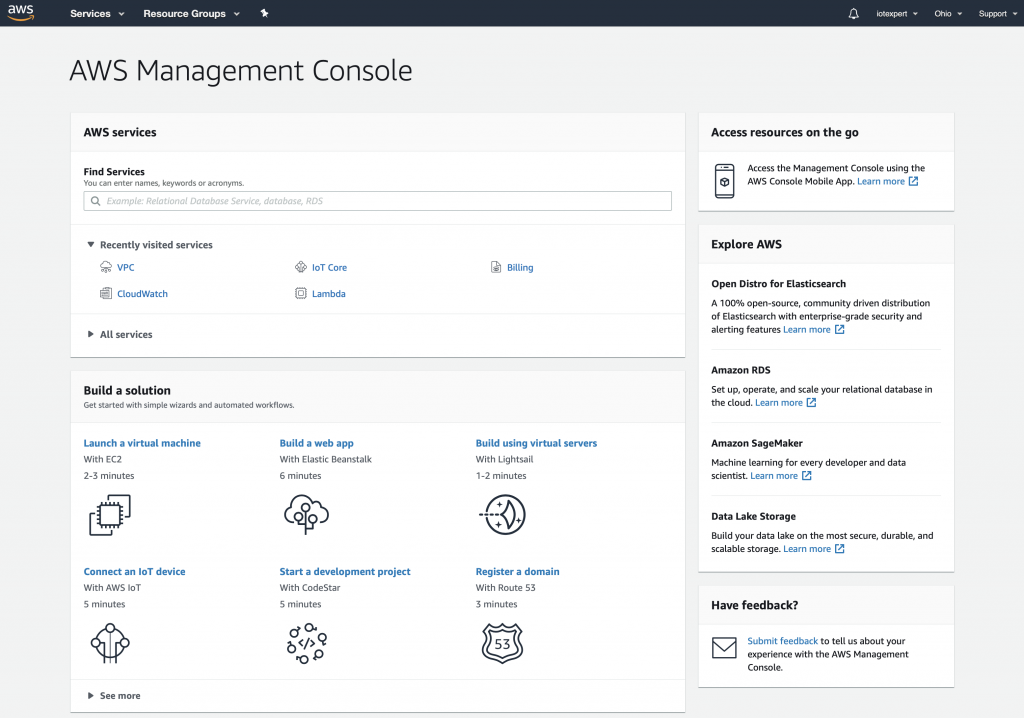
There are a couple of ways to figure this out.  But, I start by going to AWS CloudWatch which is the AWS consolidator for all of the error logs etc.  To get there search for “CloudWatch” on the AWS Management Console.

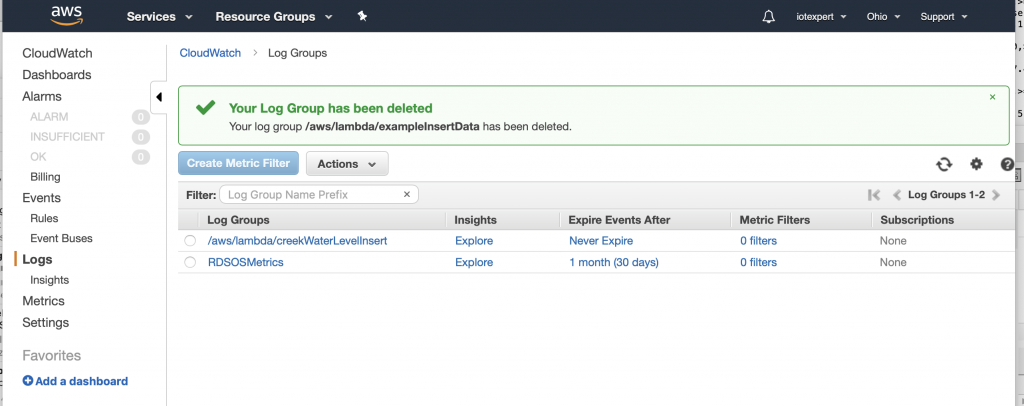
Then click on “logs”.  Notice that the log at the top is called “…/creekWaterLevelInsert”.   As best I can tell, many things in AWS generate debugging or security messages which go to these log files.

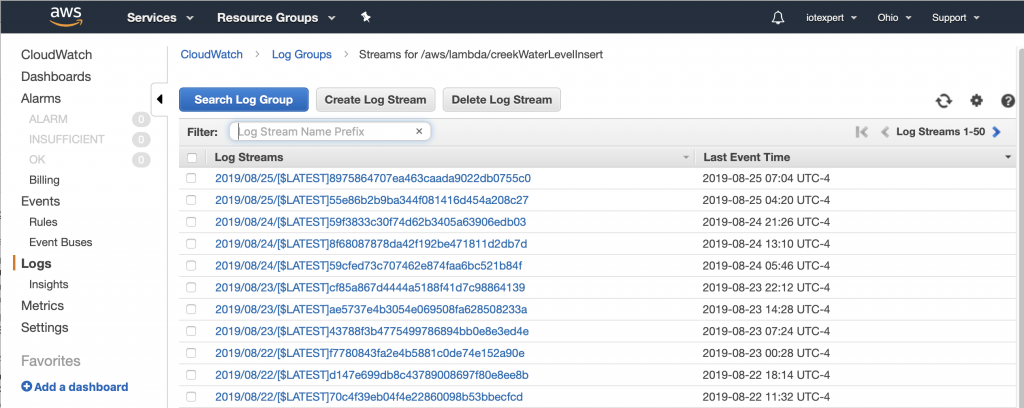
If you click on the /aws/lambda/creekWaterLevelInsert you can see that there are a bunch of different log streams for this Lambda Function.  These streams are just ranges of time where events have happened (I have actually been running this rule for  a while)

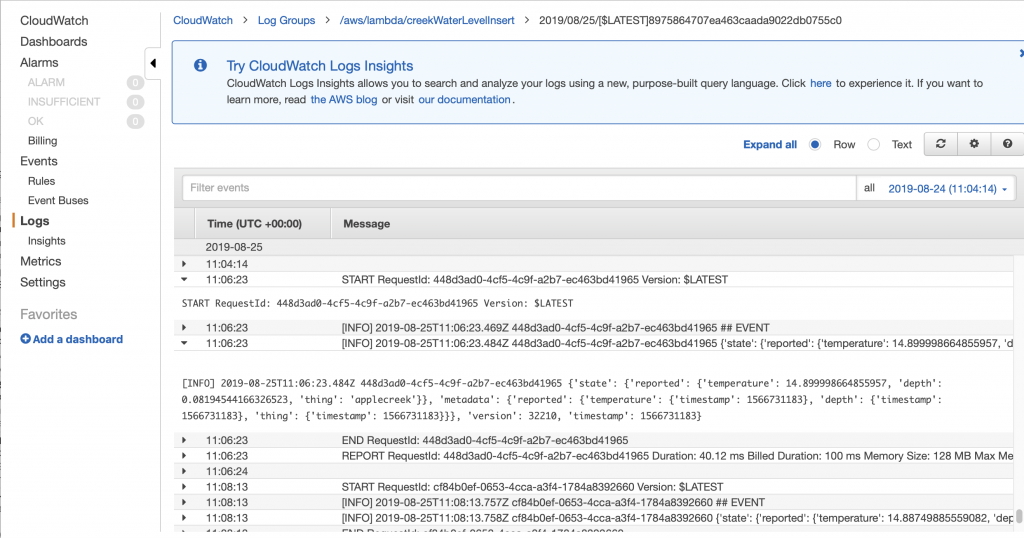
If I click on the top one, and scroll to the bottom you can see that at “11:06:23” the function was run.  And you can see the JSON message which was sent to the function.  You might ask yourself 11:06 … up above it was 7:06… why the 4 hours difference.  The answer to that question is that the AWS logs are all recorded in UTC… but I save my messages in Eastern time which is  current UTC-4.  (In hindsight I think that you should record all time in UTC)

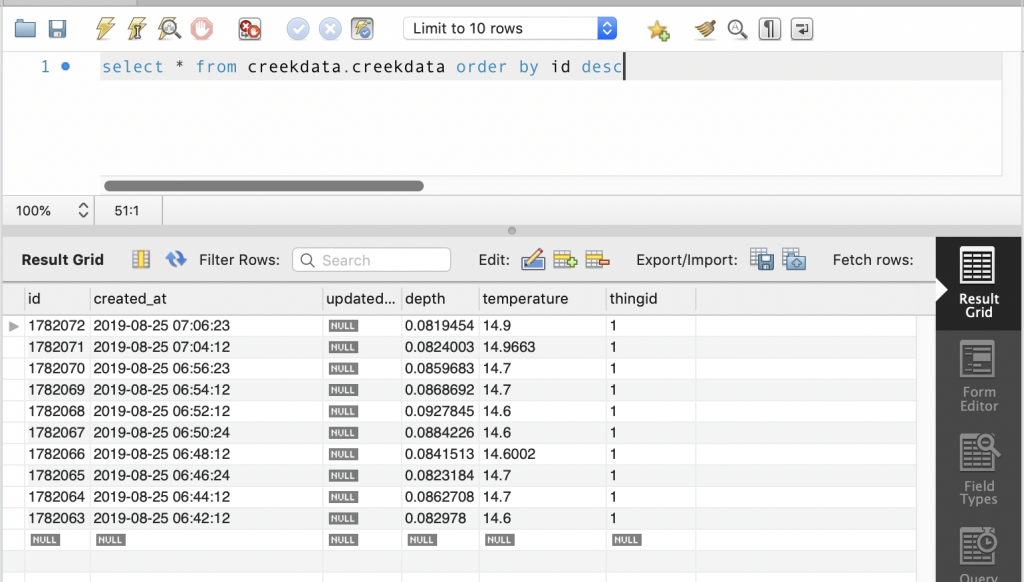
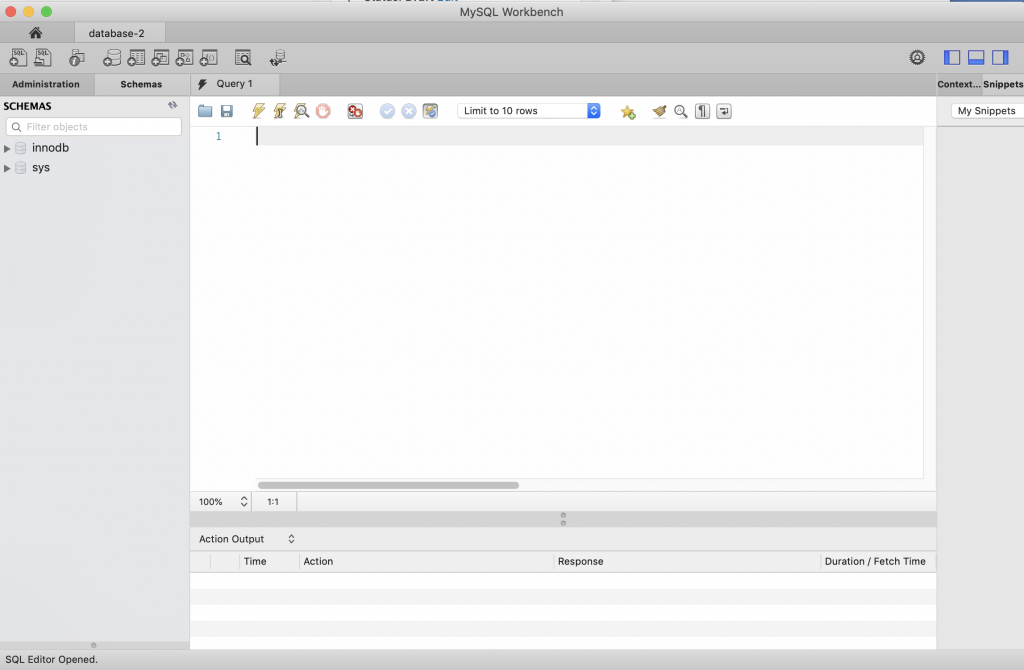
The real way to check to make sure that the lambda function worked correctly is to verify that the data was inserted into my RDS MySQL database.  To find this out I open up a connection using MySQL WorkBench (which I wrote about here).  I ask it to give me the most recent data inserted into the database and sure enough I can see that at 7:06 the temperature was 14.9 and the depth was 0.08… sweet.

For now this series is over.  However, what I really need to do next is write a web server that runs on AWS to display the data… but that will be for another day.

The Creek 2.0: AWS Lambda Function

Summary

At this point in the Creek 2.0 series I have data that is moving from my sensor into the AWS IoT core via MQTT.  I also have a VPC with an AWS RDS MySQL database running.  In order to get the data from the AWS IoT Device Shadow into the database, I am left with a two remaining steps:

  1. Create a Lambda Function which can run when asked and store data into the Database (this article)
  2. Connect the IoT MQTT Message Broker to the Lambda Function (the next article)

This article addresses the Lambda Function, which unfortunately is best written in Python.  I say ‘unfortunately’ because I’ve always had enough self-respect to avoid programing in Python – that evil witch’s brew of a hacker language.  🙂  But more seriously, I have never written a line of code in Python so it has been a bit of a journey.  As a side note, I am also interested in Machine Learning and the Google TensorFlow is Python driven, so all is not lost.

For this article, I will address:

  1. What is an AWS Lambda Function?
  2. Create a Lambda Function
  3. Run a Simple Test
  4. Install the Python Libraries (Deployment Package)
  5. Create a MySQL Connection and Test
  6. Configure the Lambda Function to Run in your VPC
  7. Create an IAM Role and Assign to the Lambda Function
  8. Update the Lambda Function to Insert Data
  9. The Whole Program

What is an AWS Lambda Function?

AWS Lambda is a place in the AWS Cloud where you can store a program, called a Lambda Function.  The name came from the “anonymous” function paradigm which is also called a lambda function in some languages (lisp was the first place I used it).  The program can then be triggered to run by a bunch of different things including the AWS IoT MQTT Broker.  The cool part is that you don’t have to manage a server because it is magically created for you on demand.   You tell AWS what kind of environment you want (Python, Go, Javascript etc), then AWS automatically creates that environment and runs your Lambda function on demand.

In this case, we will trigger the lambda function when the AWS IoT Message Broker accepts a change to the Device Shadow.  I suppose that the easiest way to understand is to actually build a Lambda Function.

Create a Lambda Function

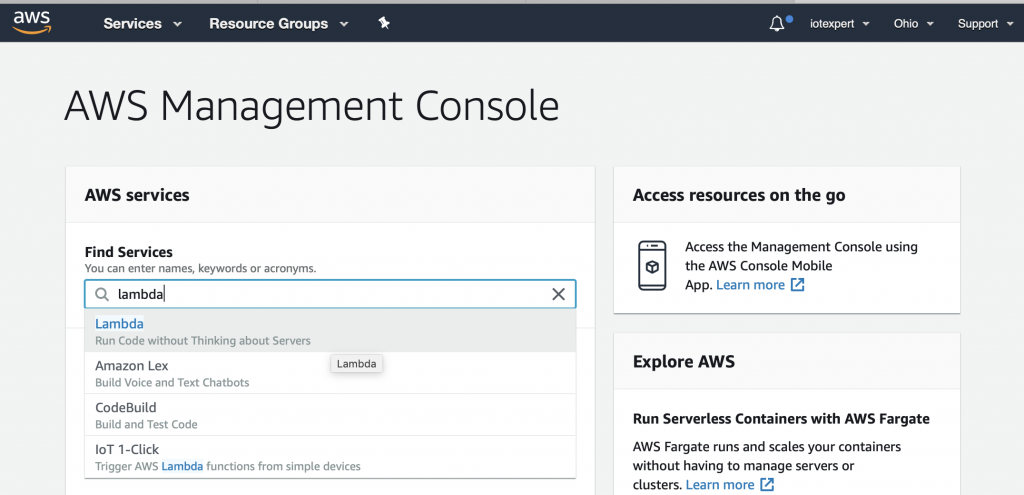
To create a Lambda function you will need to go to the Lambda management console.  To get there, start on the AWS Management console and search for “lambda”
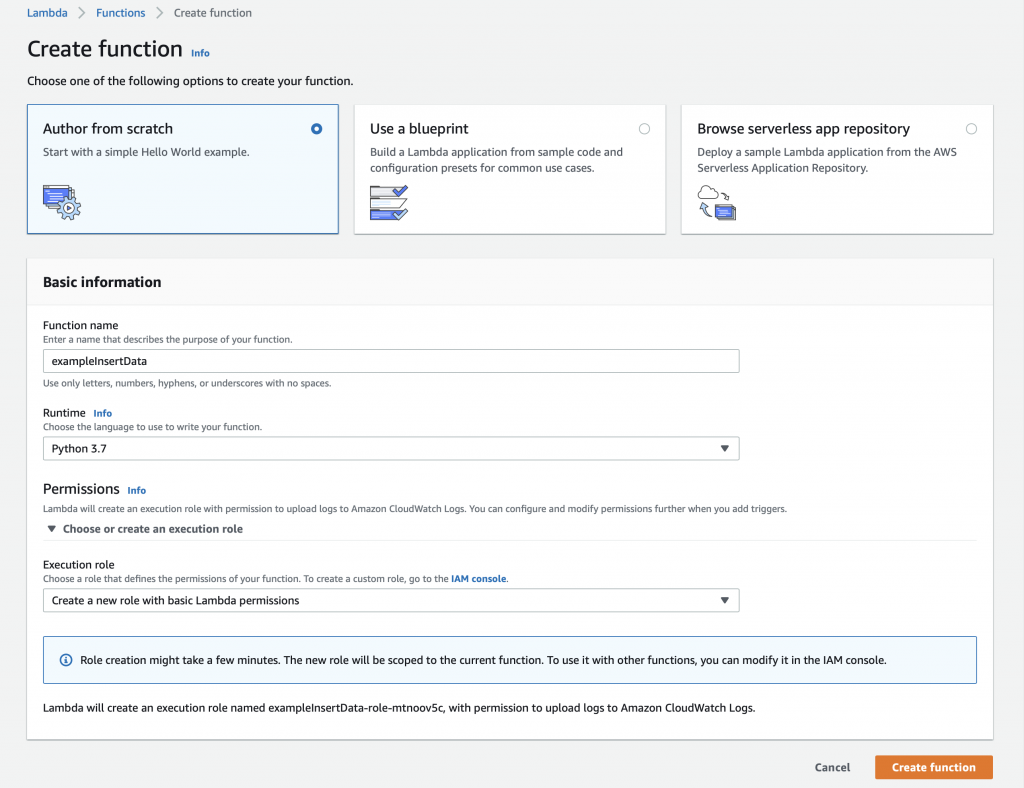
On the Lambda console, click “Functions” then “Create function”

We will build this function from scratch… oh the adventure.  Give the function a name, in this case “exampleInsertData”.  Finally, select the Runtime.  You have several choices including “Python 3.7” which I suppose was the lesser of evils.
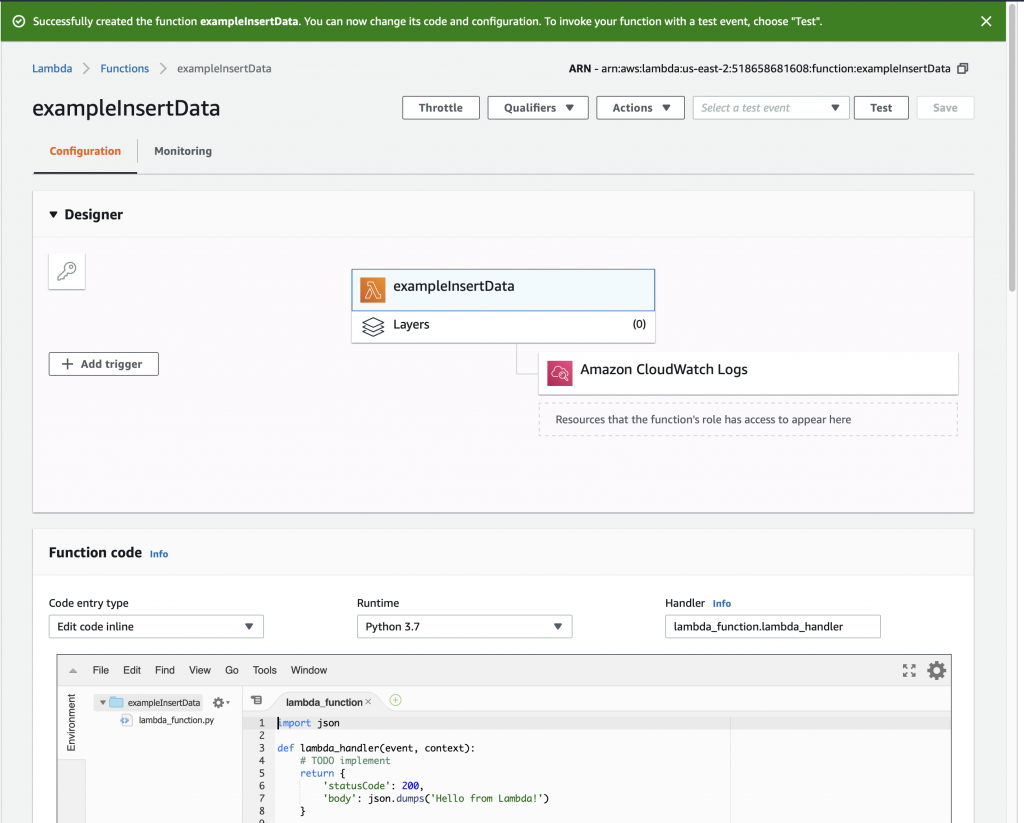
Once you click “Create function” you will magically arrive at this screen where you can get to work.  Notice that the AWS folks give you a nice starter function.
Run a Simple Test

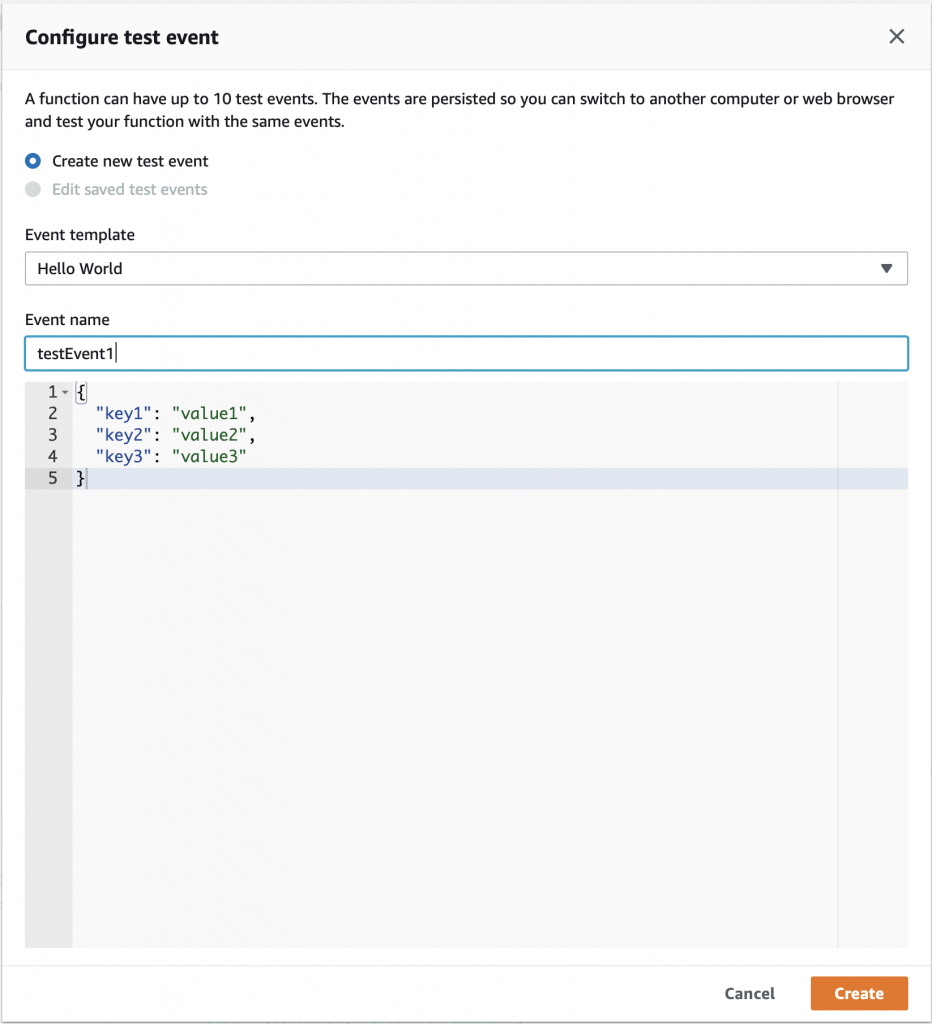
Now the we have a simple function let us run a simple test – simple, eh?  To do this, click on the drop down arrow where it says “Select a test event” and then pick out “Configure test events”

On the configure test event screen,  just give your event the name “testEvent1” and click “Create”
Now you can select “testEvent1” and then click “Test”

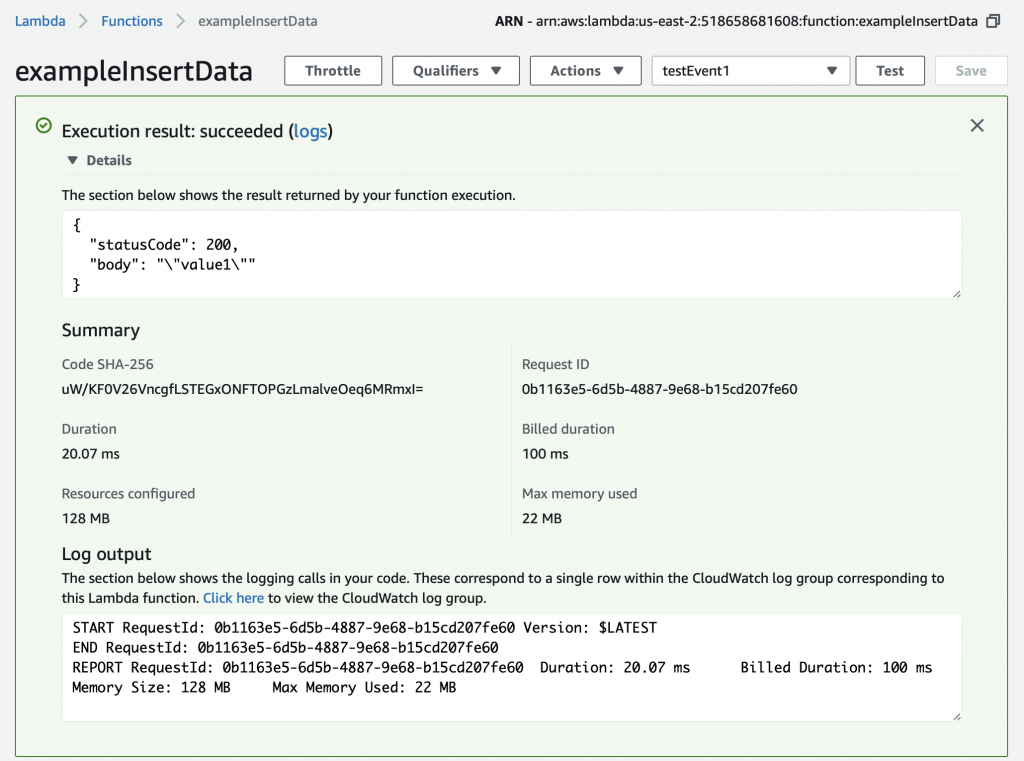
This will take the JSON message that you defined above (actually you let it be default) and send it into the Lambda program.  The console will show you the output of the whole mess in the “Execution result: …”  Press the little “Details arrow” to see everything.  Notice that the default function sends a JSON keymap with two keys.
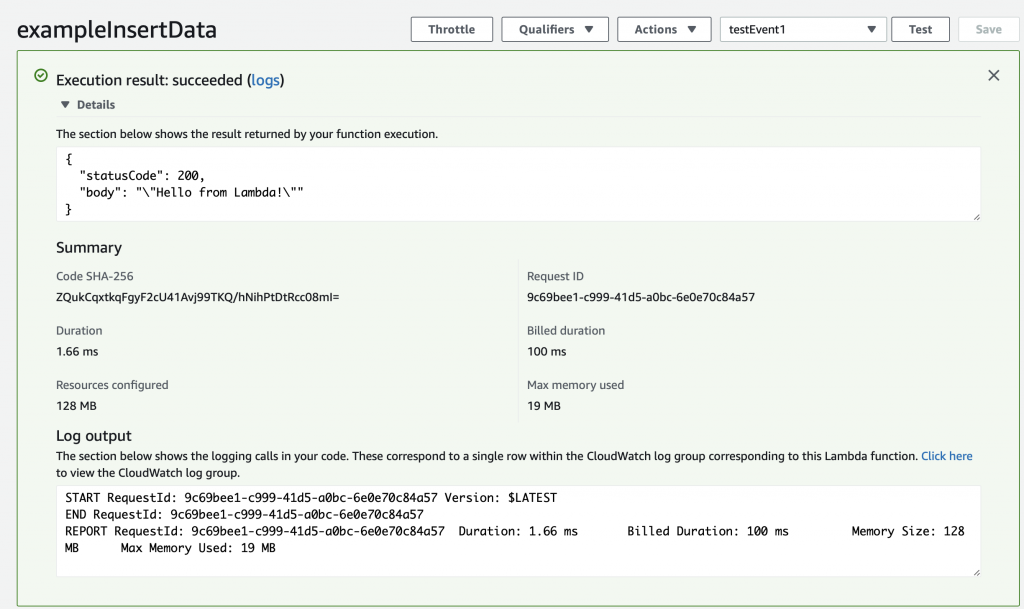
  • statusCode
  • body

When you function runs, an object is created inside of your Python program called “event” that is the JSON object that was sent to the Lambda function.  When we created the testEvent1 it gave us the option to specify the JSON object which is used as the argument to the function.  The default was a keymap with three keys key1,key2 and key3.

{
  "key1": "value1",
  "key2": "value2",
  "key3": "value3"
}

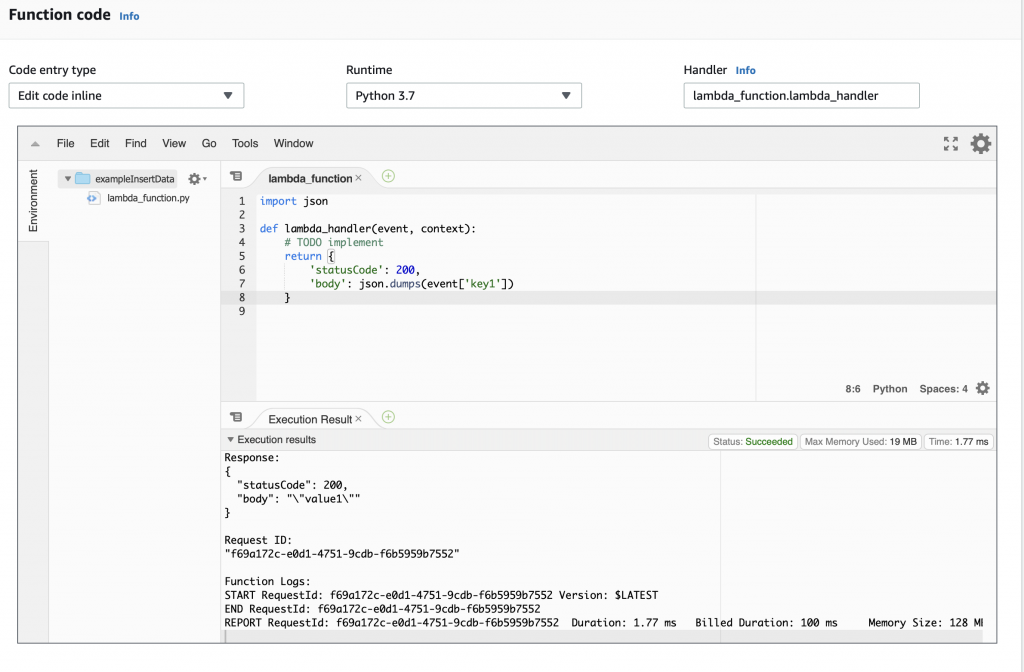
Instead of having the function return “Hello from Lambda” lets have it return the value that goes with “key1”.  To do that, make a little modification to the function to “json.dumps(event[‘key1’])”.  Now when you run the test you can see that it returns the “body” as “value1”.
Install Python Libraries

The default installation of Python 3.7 in Lambda does not have two libraries that I want to use.  Specifically:

  • pymysql – a MySQL database interface
  • pytz – a library for manipulating time (unfortunately it can’t create more time)

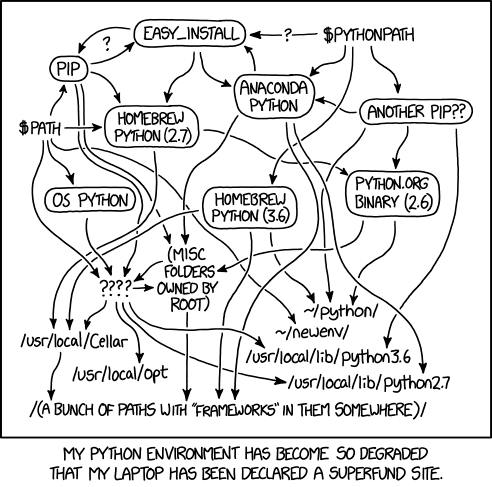
I actually don’t know what libraries are in the default Python3.7 runtime (or actually even how to figure it out?).  In order to use libraries which are not part of the Python installation by default, you need to create a “Python Deployment Package“.  If you google this problem, you will find an amazing amount of confusion on this topic.  The humorist XKCD drew a very appropriate cartoon about this topic.  (I think that I’m allowed to link it?  but if not I’m sorry and I’ll remove it)
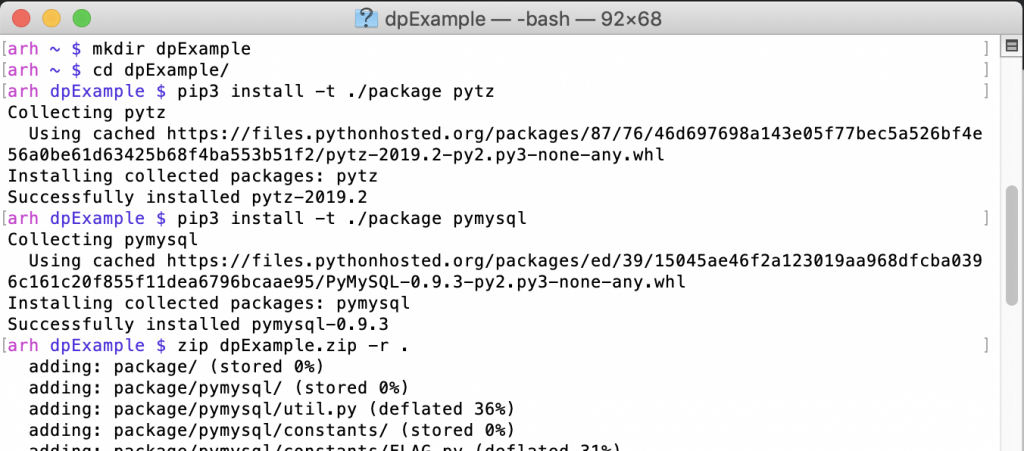
Making a deployment package is actually pretty straightforward.  The steps are:

  1. Create a directory on your computer
  2. Use PIP3 to install the libraries you need in your LOCAL directory
  3. Zip it all up
  4. Upload the zip file to AWS Lambda

Here are the first three steps (notice that I use pip3)
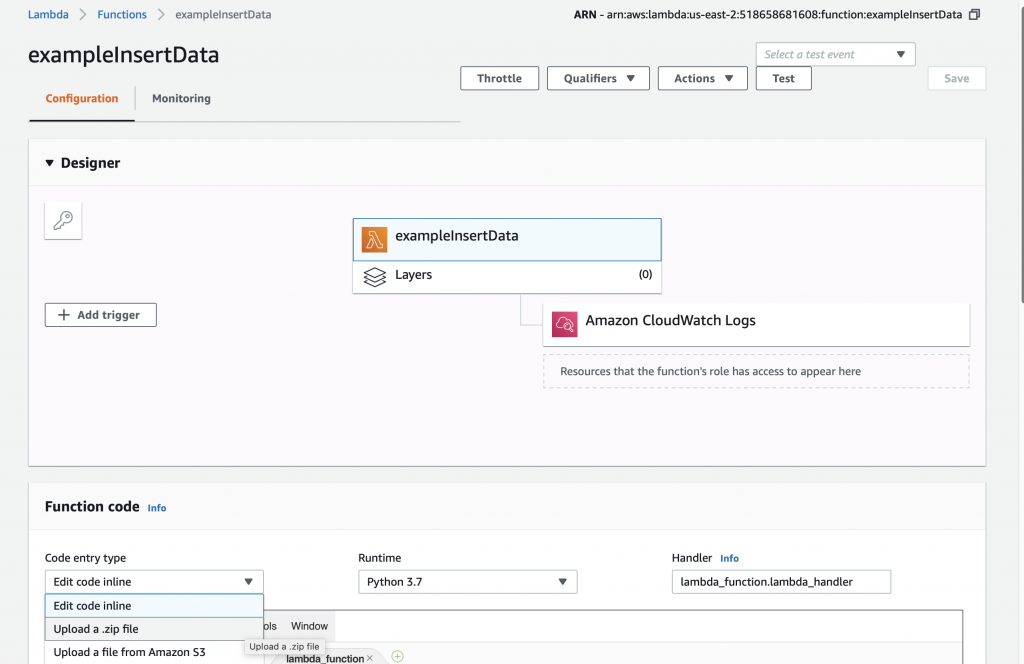
To update your AWS Lambda function, select “Upload a .zip file” on the Function code drop down.
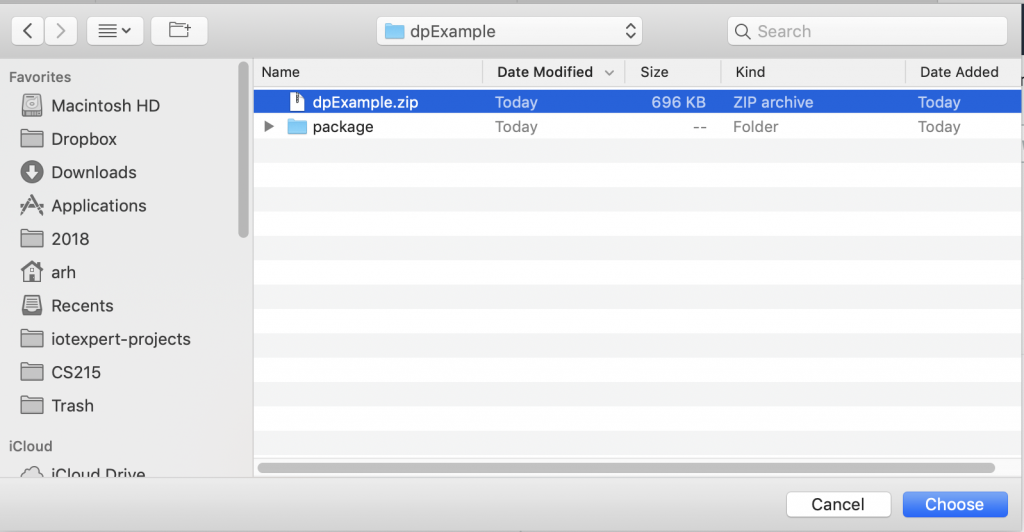
Then pick your zip file.
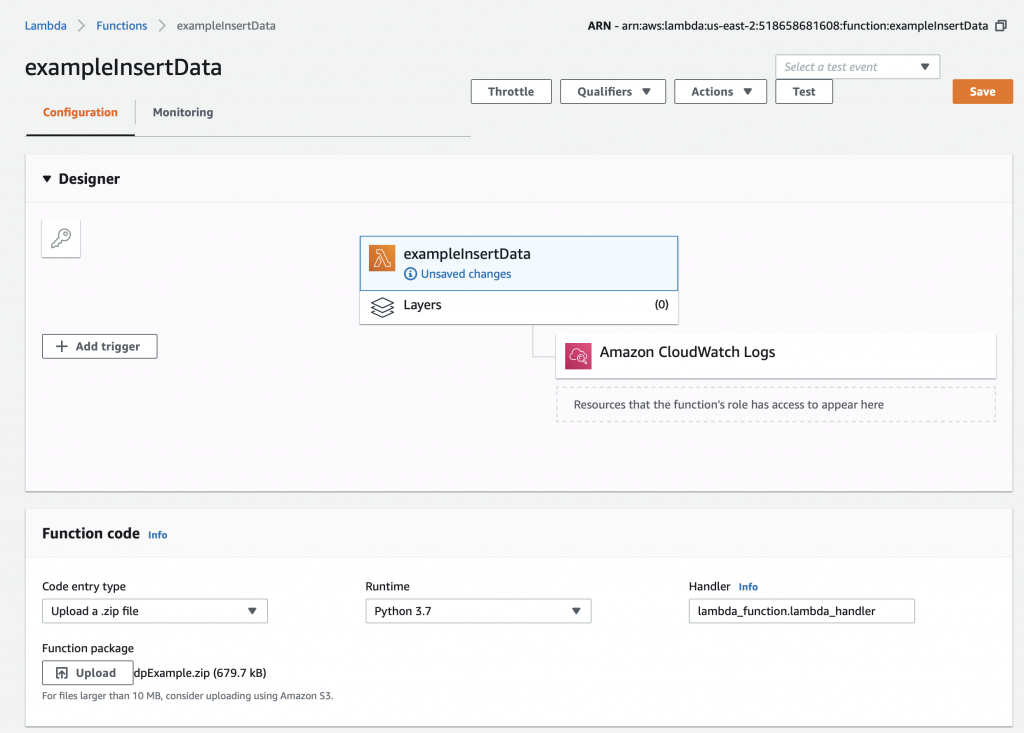
Now you need to press the “Save” button which will do the actual update.
After the upload happens you will get an error message like this.  The problem is that you don’t have a file called “lambda_function.py” and/or that file doesn’t have a function called “lamda.handler”.  AWS is right, we don’t have either of them.
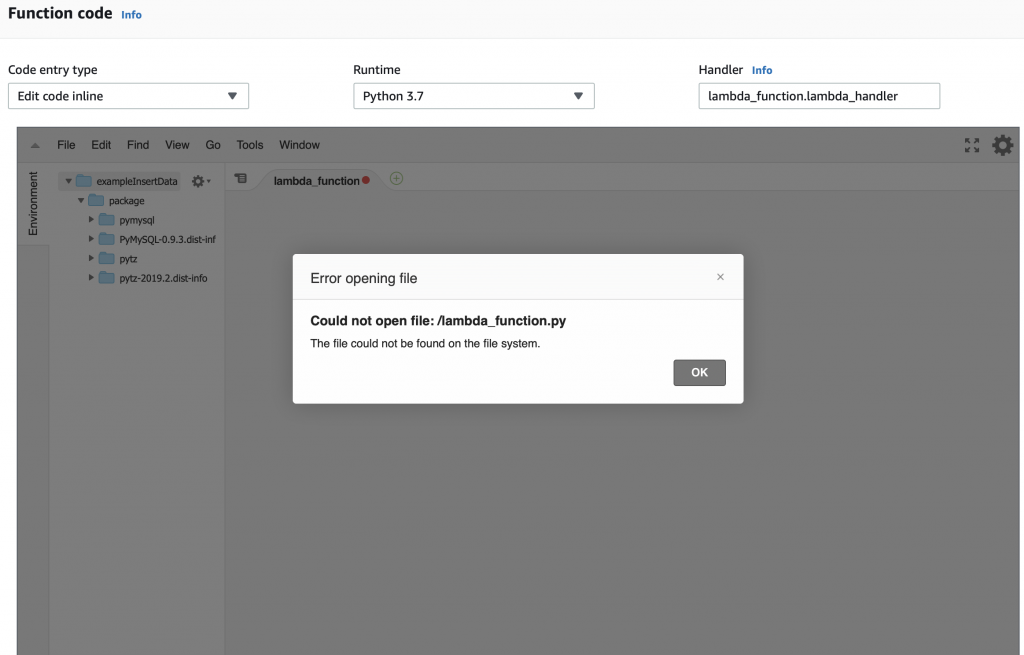
But you can see that we now have the “package” directory with the stuff we need to attach to the MySQL database and to manipulate time.
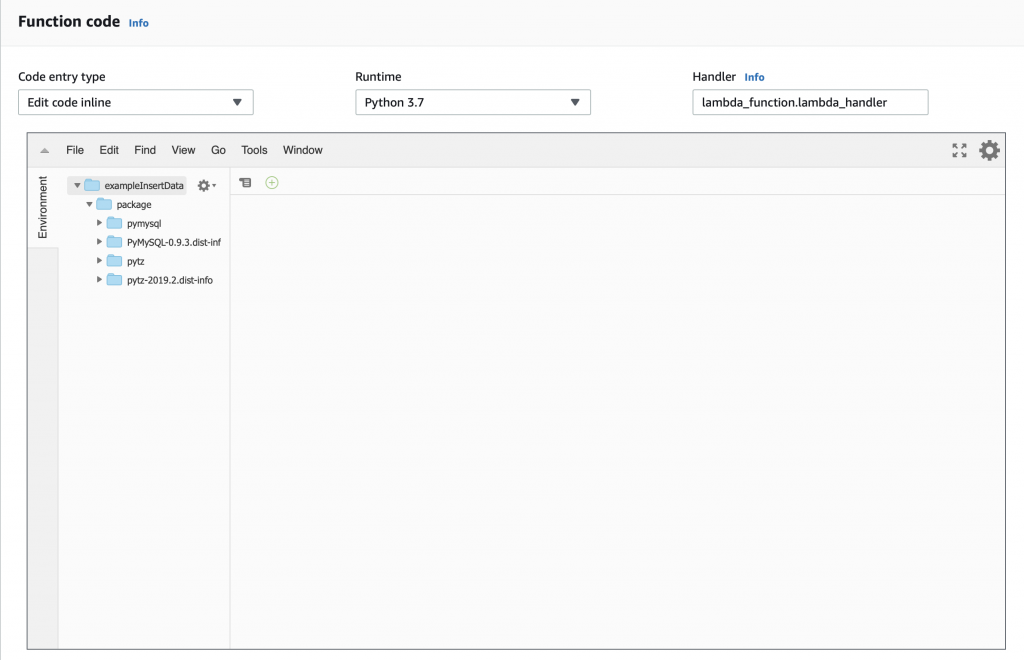
The little box that says “handler” tells you that you need to have a file called “lamda_function.py” and that Python file needs to have a function called “lambda_handler”.  So let’s create that file and function.  Start with “File->New File”
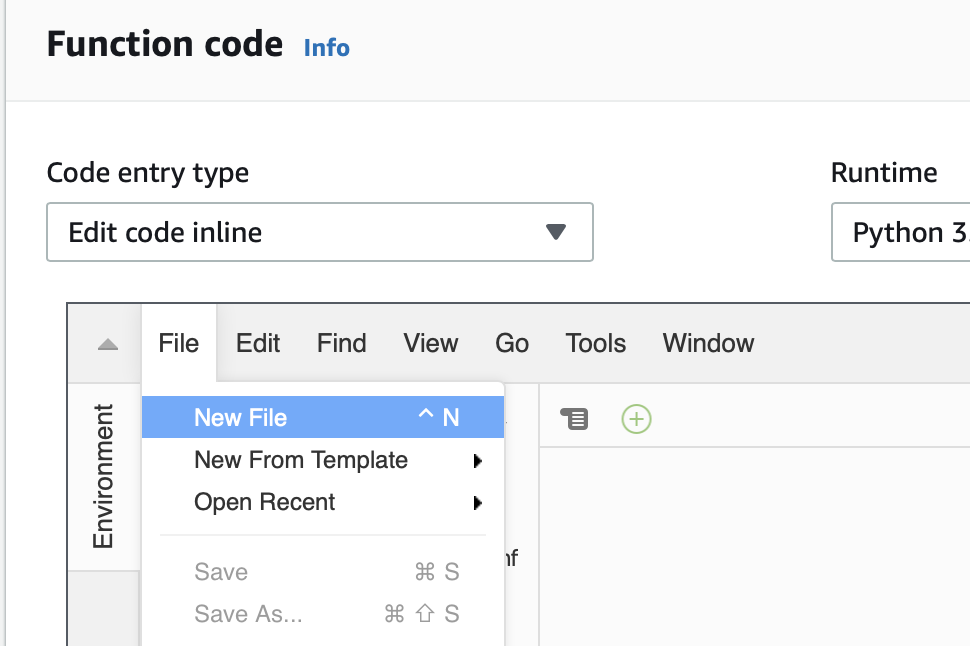
The a “File->Save As…”
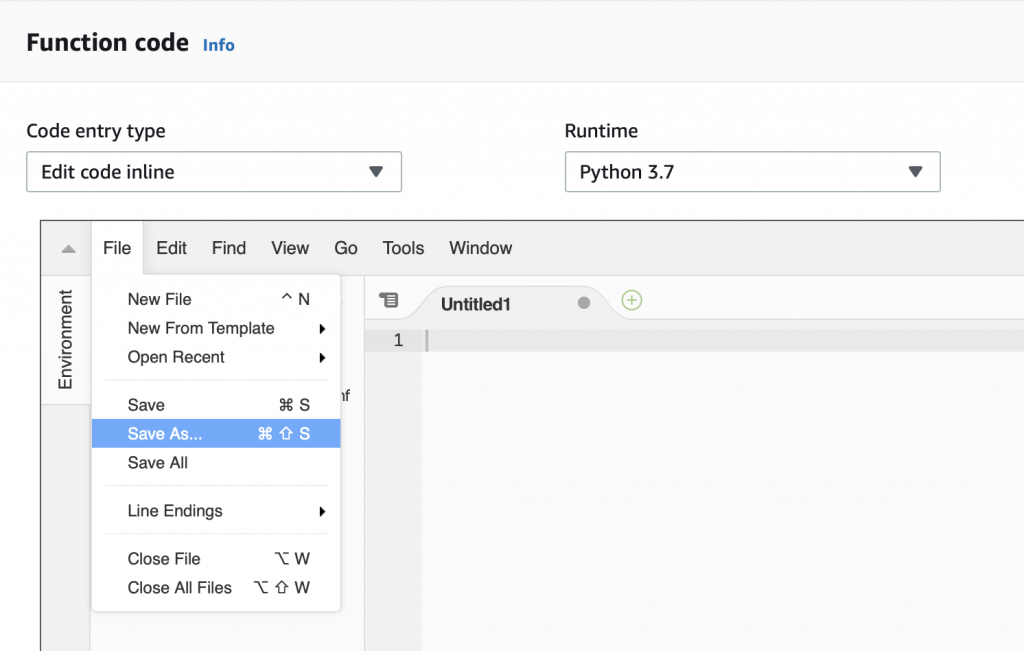
Give it the name “lambda_function.py”
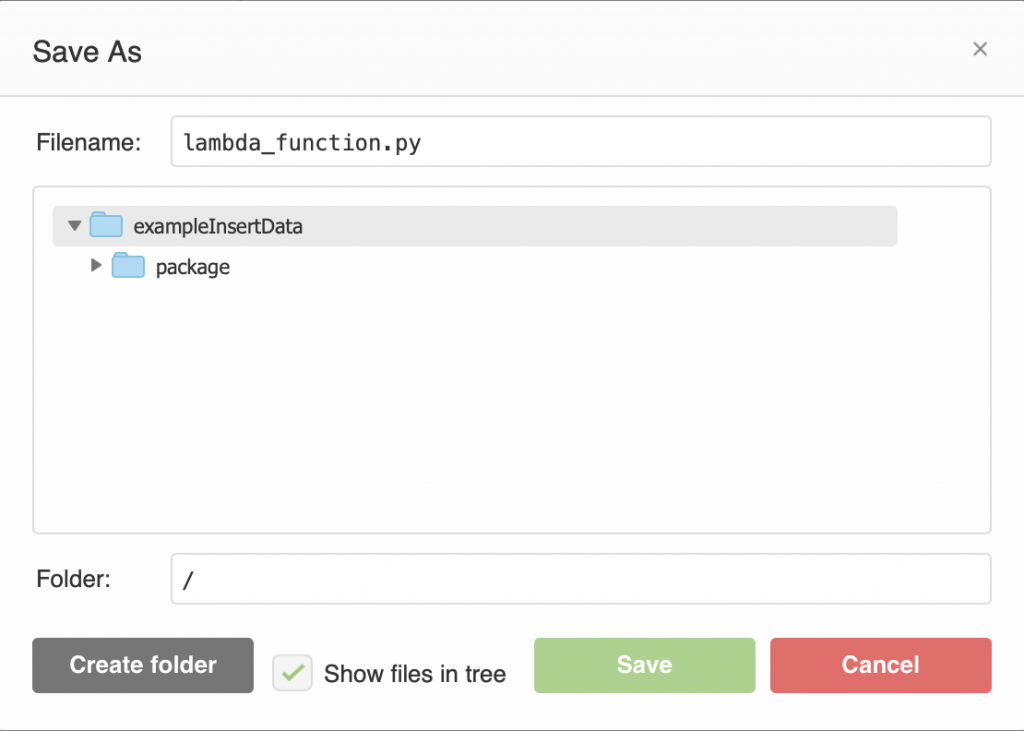
Now write the same function as before.  Then press “save”.  You could have created the function and file on your computer and then uploaded it as part of the zip file, but I didn’t.

import json

def lambda_handler(event,context):
    return {
        'statusCode' : 200,
        'body' : json.dumps(event['key1'])
    }

OK.  Let’s test and make sure that everything is still working.  So run the “testEvent1″… and you should see that it returns the same thing.
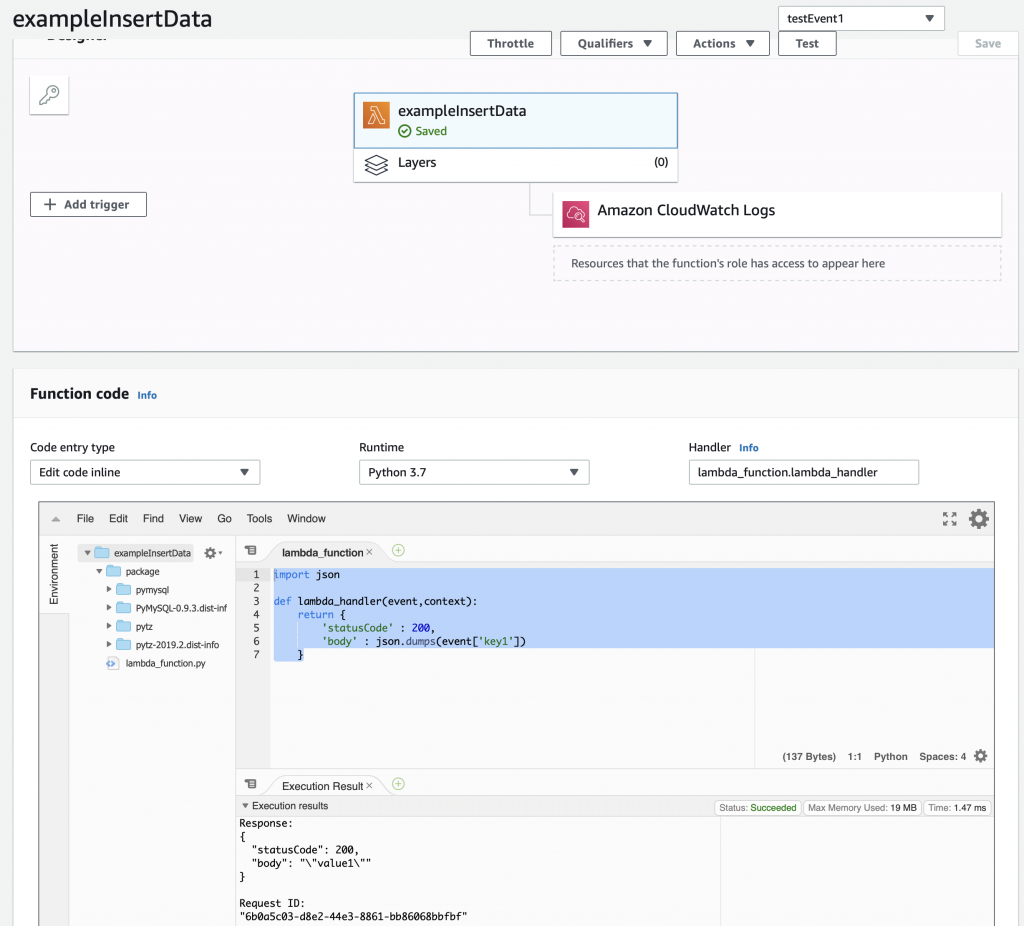
The next step is to create and test a MySQL connection.

Create a MySQL Connection and Test

This simple bit of Python uses the “pymysql” library to open up a connection to the “rds_host” with the “name” and “password”.  Assuming this works, the program goes on and runs the lambda_hander.  Otherwise it spits out an error to the log and exits.

import json
import logging
from package import pymysql


#rds settings
rds_host  = "your database endpoint goes here.us-east-2.rds.amazonaws.com"
name = "your mysql user name"
password = "your mysql password "
db_name = "your database name"

logger = logging.getLogger()
logger.setLevel(logging.INFO)

try:
    conn = pymysql.connect(rds_host, user=name, passwd=password, db=db_name, connect_timeout=5)
except:
    logger.error("ERROR: Unexpected error: Could not connect to MySQL instance.")
    sys.exit()
    

def lambda_handler(event,context):
    return {
        'statusCode' : 200,
        'body' : json.dumps(event['key1'])
    }

When I run the test, I get this message which took me a long time to figure out.  Like a stupidly long time.  In order to fix it, you need to configure the Lambda function to run in your VPC.
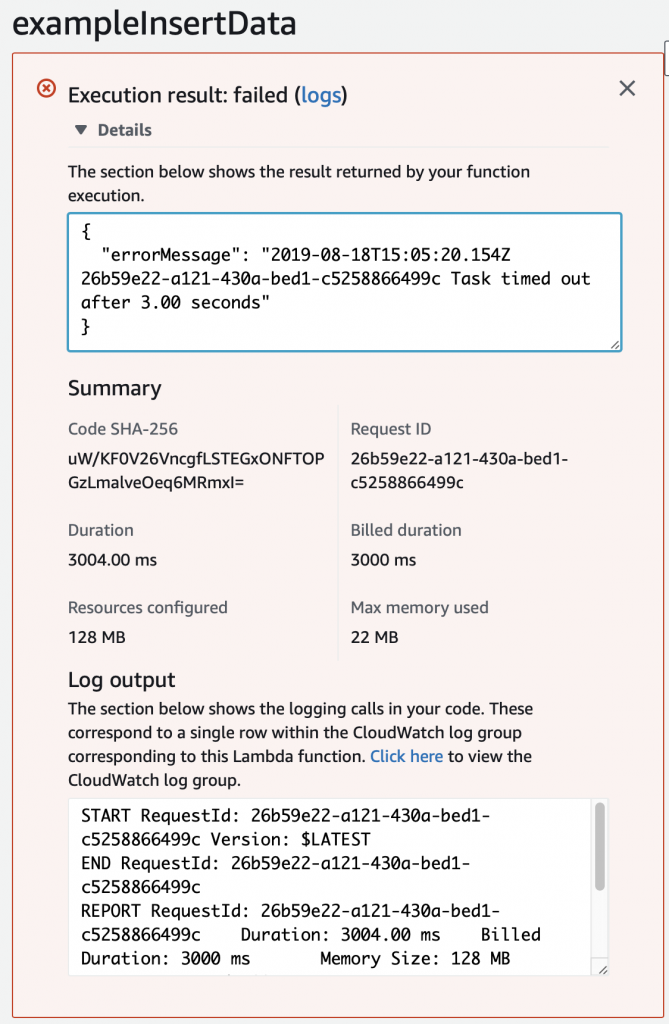
Configure the Lambda Function to Run in your VPC

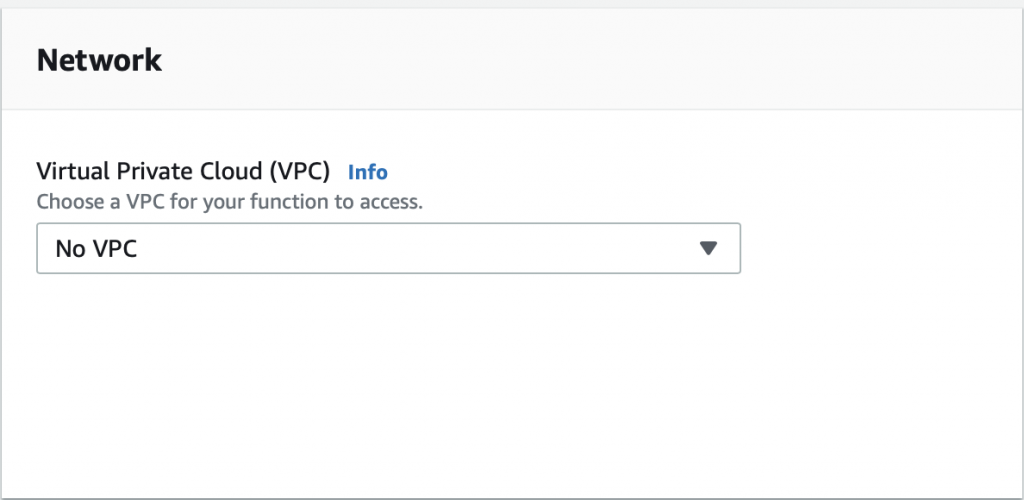
The problem is that the AWS Lambda Functions runs on the public Internet which does not have access to your AWS RDS database which you might recalls is on a private subnet in my VPC.  To fix this, you need to tell AWS to run your function INSIDE of your VPC.  Scroll down to the network section.  See where it says “No VPC”
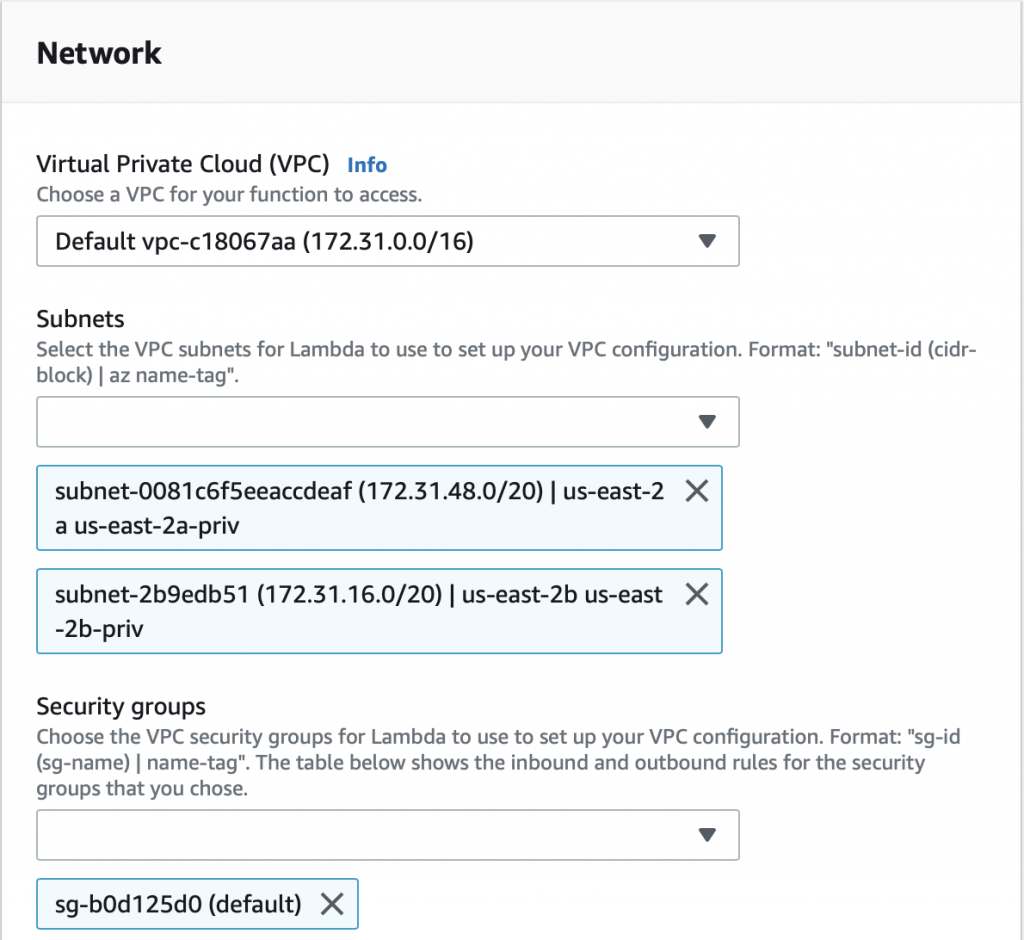
Pick out your VPC and then pick out two subnets in your VPC.  You probably should pick two subnets from different availability zones.  But it doesn’t matter if they are public or not as they only talk to the database.
After clicking save I get this message “Your role does not have VPC permissions”.  This took forever to figure out as well.  To fix this problem, you need to create the correct IAM role….
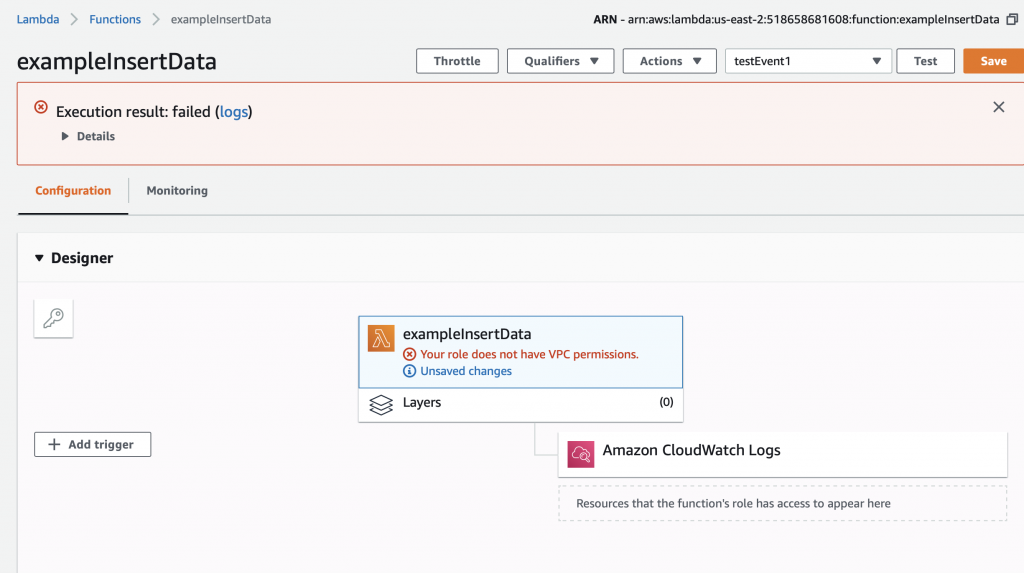
Create an IAM Role and Assign to the Lambda Function

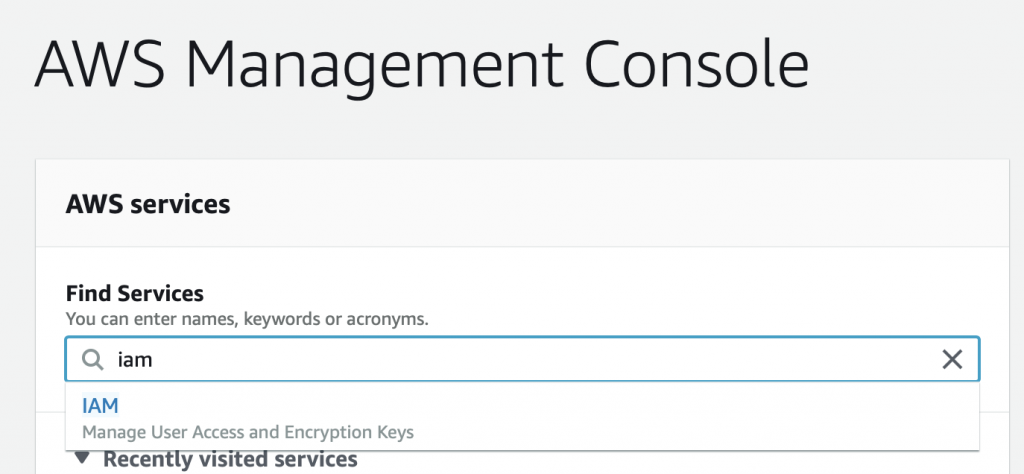
To create the role, you need to get to the IAM console and the “roles” sub console.  There are several way to get to the screen to create the role.  But I do this by going to the AWS console, searching for IAM, and clicking.
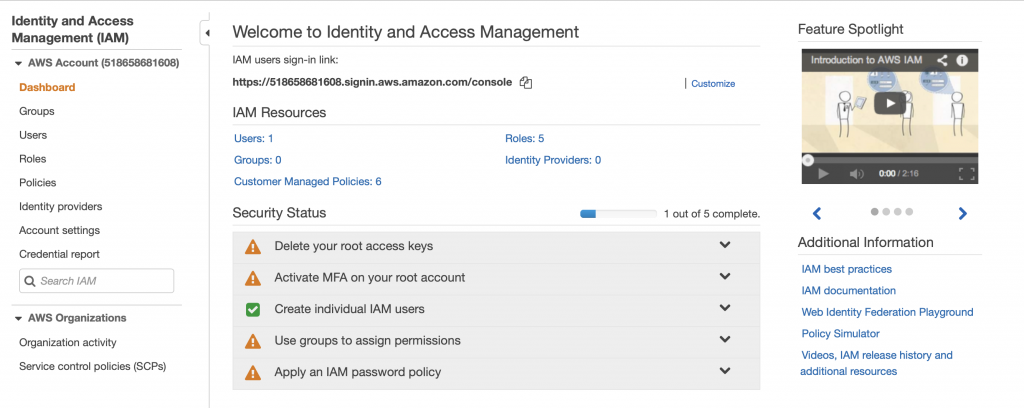
This takes me to the IAM Console.  I don’t know that much about these options.  Actually looking at this screen shot it looks like I have some “Security status” issues (which I will need to figure out).  However in order to get the Lambda function to attach to your VPC, you need to create a role.  Do this by clicking “Roles”
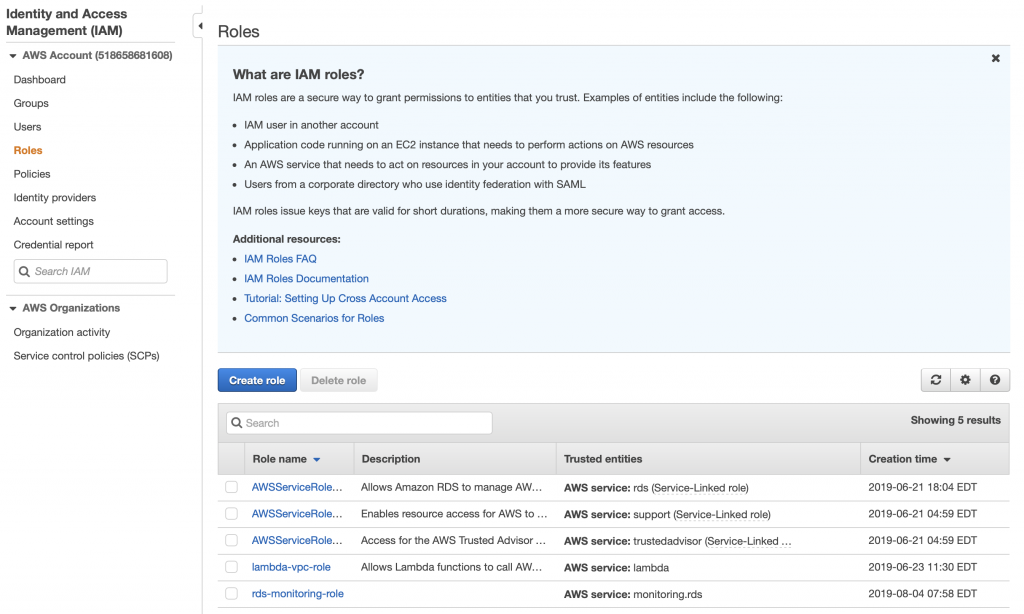
When you click on roles you can see that there are several roles, essentially rules that give your identity the ability to do things in the AWS cloud.  There are some that are created by default.  But in order for your Lambda function to attach to your VPC, you need to give it permission.  To do this click “Create role”
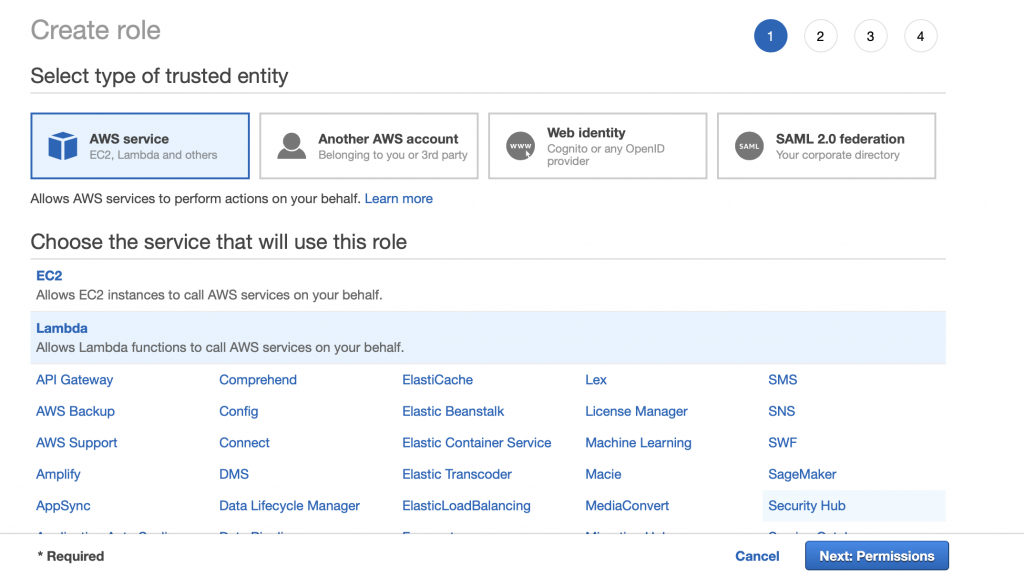
Pick “AWS service” and “Lambda” then click Next: Permissions
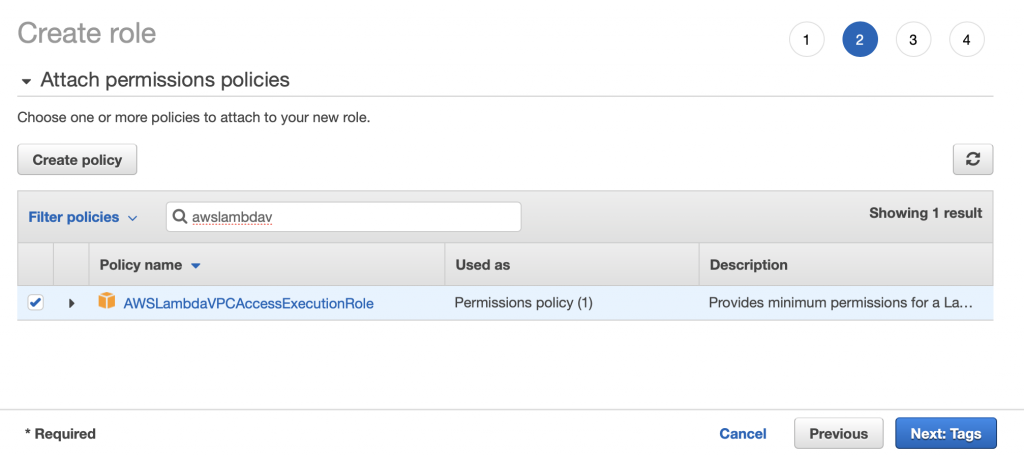
Search for the “AWSLambdaVPCAccessExecutionRole”.  Pick it and then click Next: Tags
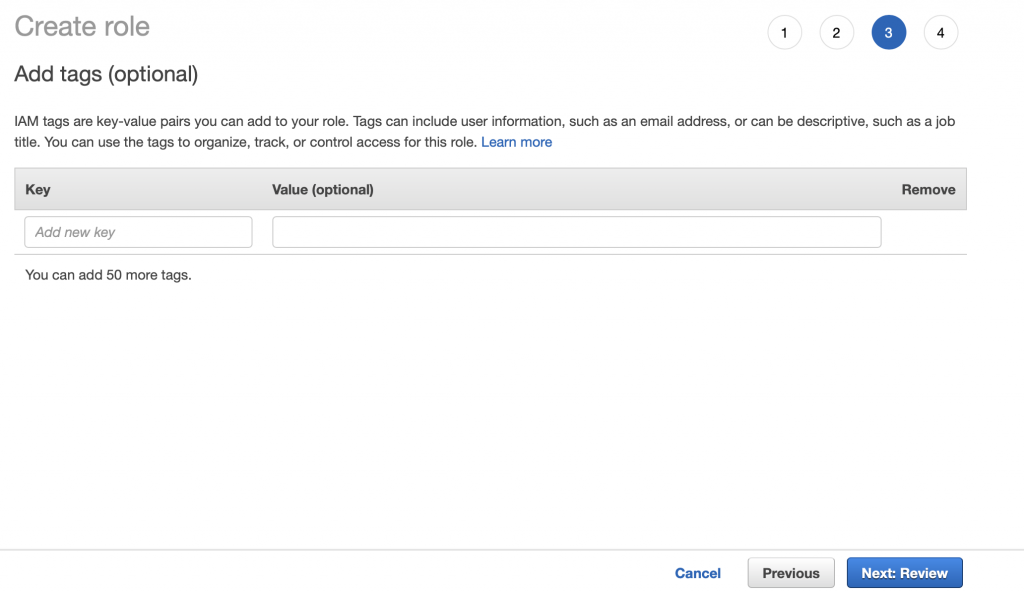
I don’t have any tags so click Next: Review
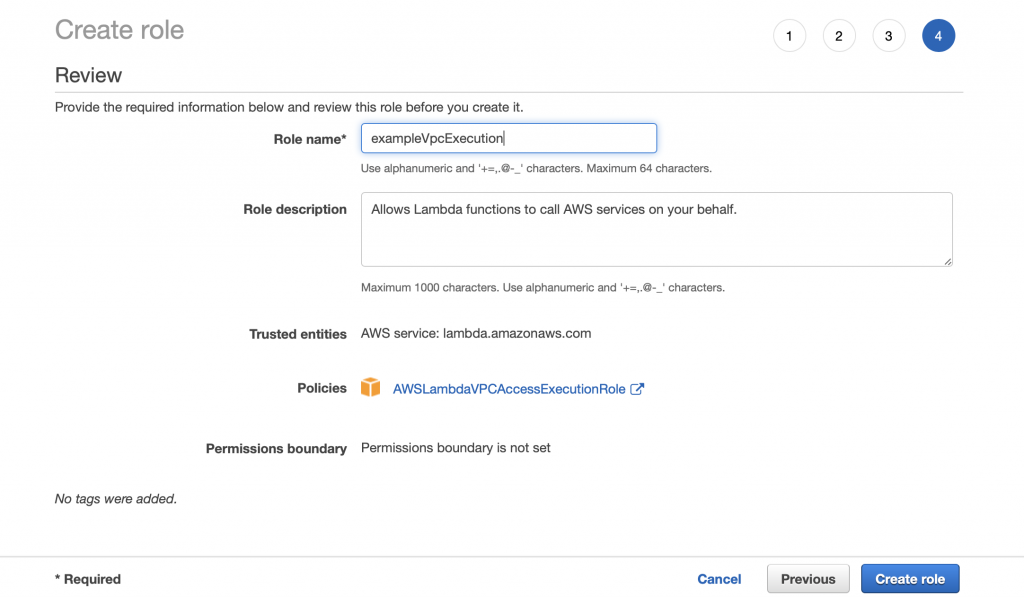
Give the role a name “exampleVpcExecution” then click Create role.
You should get a success message.
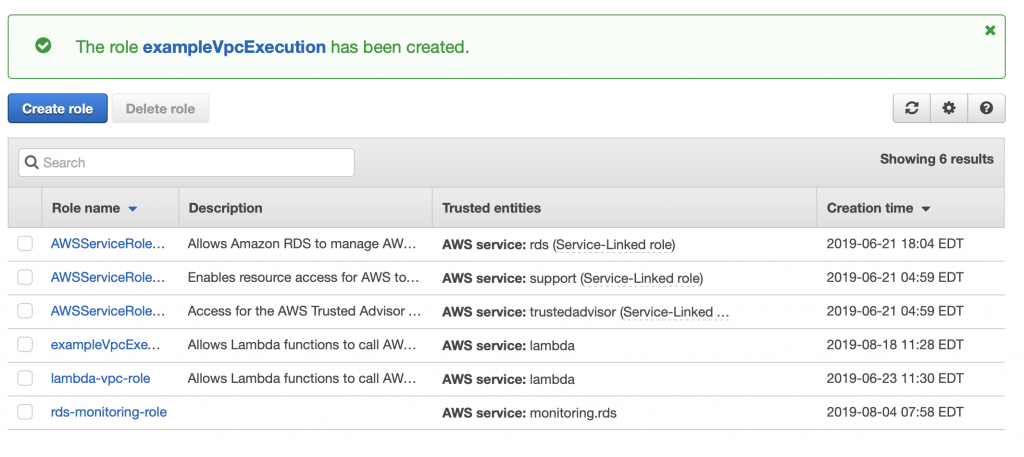
Now go back to the Lambda function configuration screen.  Move down to “Execution role” and pick out the role that you just created.
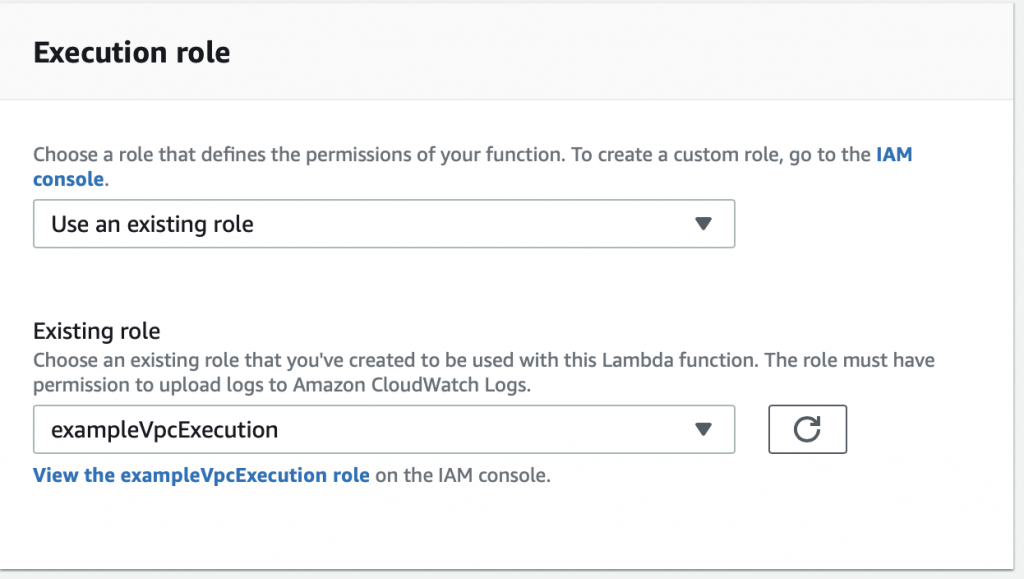
Now when I test things work…. now let’s fix up the function to actually do the work of inserting data.
Update the Lambda Function to Insert Data

You should recall from the article on AWS MQTT that when you update the IoT Device Shadow via MQTT you publish a JSON message like this to the topic “$aws/things/applecreek/shadow/update”

{
  "state": {
    "reported": {
      "temperature": 37.39998245239258,
      "depth": 0.036337487399578094,
      "thing": "applecreek"
    }
  }
}

Which will cause the AWS IoT to update you device shadow and then publish a message to “$aws/things/applecreek/shadow/update/accepted” like this:

{
  "state": {
    "reported": {
      "temperature": 37.39998245239258,
      "depth": 0.036337487399578094,
      "thing": "applecreek"
    }
  },
  "metadata": {
    "reported": {
      "temperature": {
        "timestamp": 1566144733
      },
      "depth": {
        "timestamp": 1566144733
      },
      "thing": {
        "timestamp": 1566144733
      }
    }
  },
  "version": 27323,
  "timestamp": 1566144733
}

In the next article Im going to show you how to hook up those messages to run Lambda function.  But, for now assume that the JSON that comes out of the “…/accepted” topic will be passed to your function as the “event”.

The program has the following sections:

  1. Setup the imports
  2. Define some Configuration Variables
  3. Make a logger
  4. Make a connection to the RDS database
  5. Find the name of the thing in the JSON message
  6. Search for the thingId in the table creekdata.things
  7. Find the state key/value
  8. Find the reported key/value
  9. Find the depth key/value
  10. Find the temperature key/value
  11. Find the timestamp key/value
  12. Convert the UTC timestamp to Eastern Time (I should have long ago designed this differently)
  13. Insert the new data point into the Database

Setup the Imports

The logging import is used to write data to the AWS logging console.

The pymysql is a library that knows how to attach to MySQL databases.

I made the decision years ago to store time in eastern standard time in my database.  That turns out to have been a bad decision and I should have used UTC.  Oh well.  To remedy this problem I use the “pytz” to convert between UTC (what AWS uses) and EST (what my system uses)

import sys
sys.path.append("./package")
import logging
import pymysql

from pytz import timezone, common_timezones
import pytz
from datetime import datetime

Define Some Configuration Variables

Rather than hardcode the Keys in the JSON message, I setup a number of global variables to hold their definition.

stateKey ="state"
reportedKey = "reported"
depthKey = "depth"
temperatureKey = "temperature"
timeKey = "time"
deviceKey = "thing"
timeStampKey = "timestamp"

Make a connection to the RDS Database

In order to write data to my RDS MySQL database I create a connection using “pymysql.connect”.  Notice that if this fails it will write into the cloud watch log.  If it succeeds then there will be a global variable called “conn” with the connection object.

rds_host  = "creekdata.cycvrc9tai6g.us-east-2.rds.amazonaws.com"
name = "database user"
password = "databasepassword"
db_name = "creekdata"

try:
    conn = pymysql.connect(rds_host, user=name, passwd=password, db=db_name, connect_timeout=5)
except:
    logger.error("ERROR: Unexpected error: Could not connect to MySQL instance.")
    sys.exit()
    

Make a logger

AWS gives you the ability to write to the AWS CloudWatch logging system.  In order to write there, you need to create a “logger”

logger = logging.getLogger()
logger.setLevel(logging.INFO)

Look for the stateKey and reportKey

The JSON message “should” have key called “state”.  The value of that key is another keymap with a value called “reported”

if stateKey in event:
        if reportedKey in event[stateKey]:

Find the Depth

Assuming that you have state/reported then you need to find the value of the depth

if depthKey in event[stateKey][reportedKey]:
                depthValue = event[stateKey][reportedKey][depthKey]

Find the Temperature

It was my intent to send the temperature every time I update the shadow state.  But I put in a provision for the temperature not being there and taking the value -99

if temperatureKey in event[stateKey][reportedKey]:
                temperatureValue = event[stateKey][reportedKey][temperatureKey]
            else:
                temperatureValue = -99

Look for a Timestamp

My current sensor system does not keep time, however, I may add that functionality at some point.  So, I put in the ability to have a timeStamp set by the sensor.  If there is no timestamp there, AWS happily makes one for you when you update the device shadow.  I look in

  • The reported state
  • The overall message
  • Or I barf
if timeStampKey in event[stateKey][reportedKey]:
                timeValue = datetime.fromtimestamp(event[stateKey][reportedKey][timeStampKey],tz=pytz.utc)
#                logger.info("Using state time")
            elif timeStampKey in event:
#                logger.info("using timestamp" + str(event[timeStampKey]))
                timeValue = datetime.fromtimestamp(event[timeStampKey],tz=pytz.utc)
            else:
                raise Exception("JSON Missing time date")

Find the name of the thing in the JSON message

My database has two tables.  The table called “creekdata” has columns of id, thingid, depth, temperature, created_at.  The thing id is key into another table called “things” which has the columns of thingid and name.  In other words, it has a map of a text name for things to a int value.  This lets me store multiple thing values in the same creekdata table… which turns out to be an overkill as I only have one sensor.

When I started working on this program I wanted the name of thing to be added automatically as part of the JSON message, but I couldn’t figure it out.  So, I added the thing name as a field which is put in by the sensor.

if deviceKey in event[stateKey][reportedKey]:
                deviceValue = event[stateKey][reportedKey][deviceKey]
            else:
                logger.error("JSON Event missing " + deviceKey)
                raise Exception("JSON Event missing " + deviceKey)

Search for the thingId in the table creekdata.things

I wrote a function which takes the name of a thing and returns the thingId.

def getThingId(deviceName):
    with conn.cursor() as cur:
        cur.execute("select thingid from creekdata.things where name=%s", deviceName)
    results = cur.fetchall()
#    logger.info("Row = " + str(len(results)))
    if len(results) > 0:
#        logger.info("thingid = "+ str(results[0][0]))
        return results[0][0]
    else:
        raise Exception("Device Name Not Found " + deviceName)

Convert the UTC timestamp to Eastern Time

As I pointed out earlier, I should have switched the whole system to store UTC.  But no.  So I use the pytz function to switch my UTC value to EST.

  tz1 = pytz.timezone('US/Eastern')
    xc = timeValue.astimezone(tz1)

Insert the New Data Point into the Database

Now we know everything, so insert it into the database.

with conn.cursor() as cur:
        cur.execute("INSERT into creekdata.creekdata (created_at,depth, thingid,temperature) values (%s,%s,%s,%s)",(xc.strftime("%Y-%m-%d %H:%M:%S"),depthValue,thingIdValue,temperatureValue));
    conn.commit()

The Final Program

Here is the whole program in one place.

import json
import sys
import logging
import os

sys.path.append("./package")
import pymysql

from pytz import timezone, common_timezones
import pytz
from datetime import datetime

stateKey ="state"
reportedKey = "reported"
depthKey = "depth"
temperatureKey = "temperature"
timeKey = "time"
deviceKey = "thing"
timeStampKey = "timestamp"

#rds settings
rds_host  = "put your endpoint here.us-east-2.rds.amazonaws.com"
name = "mysecretuser"
password = "mysecretpassword"
db_name = "creekdata"

logger = logging.getLogger()
logger.setLevel(logging.INFO)

try:
    conn = pymysql.connect(rds_host, user=name, passwd=password, db=db_name, connect_timeout=5)
except:
    logger.error("ERROR: Unexpected error: Could not connect to MySQL instance.")
    sys.exit()
    

def lambda_handler(event,context):
    logger.info('## EVENT')
    logger.info(event)
    insertVal = ""
    if stateKey in event:
        if reportedKey in event[stateKey]:
            if depthKey in event[stateKey][reportedKey]:
                depthValue = event[stateKey][reportedKey][depthKey]
            if temperatureKey in event[stateKey][reportedKey]:
                temperatureValue = event[stateKey][reportedKey][temperatureKey]
            else:
                temperatureValue = -99
            if timeStampKey in event[stateKey][reportedKey]:
                timeValue = datetime.fromtimestamp(event[stateKey][reportedKey][timeStampKey],tz=pytz.utc)
#                logger.info("Using state time")
            elif timeStampKey in event:
#                logger.info("using timestamp" + str(event[timeStampKey]))
                timeValue = datetime.fromtimestamp(event[timeStampKey],tz=pytz.utc)
            else:
                raise Exception("JSON Missing time date")
                
            if deviceKey in event[stateKey][reportedKey]:
                deviceValue = event[stateKey][reportedKey][deviceKey]
            else:
                logger.error("JSON Event missing " + deviceKey)
                raise Exception("JSON Event missing " + deviceKey)
        else:
            raise Exception("JSON Event missing " + reportedKey)
    else:
        raise Exception("JSON Event missing " + stateKey)

    thingIdValue = getThingId(deviceValue)
    tz1 = pytz.timezone('US/Eastern')
    xc = timeValue.astimezone(tz1)

    with conn.cursor() as cur:
        cur.execute("INSERT into creekdata.creekdata (created_at,depth, thingid,temperature) values (%s,%s,%s,%s)",(xc.strftime("%Y-%m-%d %H:%M:%S"),depthValue,thingIdValue,temperatureValue));
    conn.commit()
        
    return "return value"  # Echo back the first key value

def getThingId(deviceName):
    with conn.cursor() as cur:
        cur.execute("select thingid from creekdata.things where name=%s", deviceName)
    results = cur.fetchall()
#    logger.info("Row = " + str(len(results)))
    if len(results) > 0:
#        logger.info("thingid = "+ str(results[0][0]))
        return results[0][0]
    else:
        raise Exception("Device Name Not Found " + deviceName)
The Creek 2.0: AWS Relational Database Server (RDS) – MySQL

Summary

In the previous articles I showed you the overall Creek 2.0 Architecture (1-8).  Then I explained how AWS MQTT (5) works, and I showed you how to write a Python program to update the device shadow (4).  In this article, I will create an AWS Relational Database Server (RDS) that runs MySQL which will be used to store the data.

You might ask yourself why would I explain (8) before I explained (6) & (7)?  The answer is that I need a place to send the data before the send the data functions will make any sense.

First, a definition, RDS – Relational Database Server – is Amazons name for a service that give you a database server, in your VPC, running an instance of MySQL, Aurora, DynamoDb, or Postgres.  In their words, RDS “…provides cost-efficient and resizable capacity while automating time-consuming administration tasks such as hardware provisioning, database setup, patching and backups.”   The AWS definition is largely true.  It does not however abdicate your DataBase Administrator (DBA) responsibilities.

For my application I need MySQL, so for this article I will walk you through setting up a MySQL database using AWS RDS.  The specific topics are:

  1. Create a Database Using the Amazon Defaults
  2. Create MySQL WorkBench Connection
  3. Examining the Security
  4. Rethinking the Security & Subnet Groups
  5. Configure Security Groups
  6. Create the Database I Really Want
  7. MySQL WorkBench EC2 Tunneling over SSL

Create a Database Using the Amazon Defaults

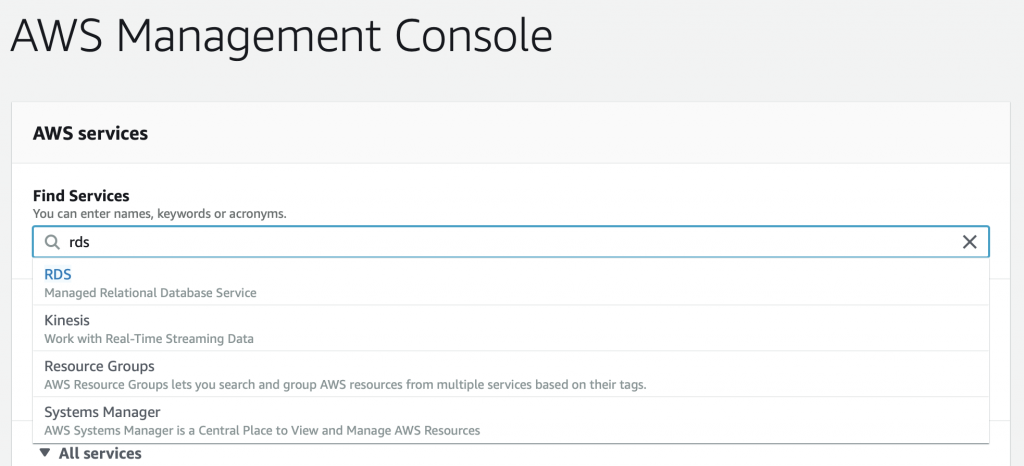
It is really easy to create a MySQL database using the default Amazon settings.  The setting will be absolutely fine, except that the Database will be attached to a Public Subnet rather than a private one.   This is probably mostly OK as the subnet settings that AWS creates by default are probably safe enough?  It is certainly easy, so let’s start there.  Go to your AWS management console.  Then search for RDS.

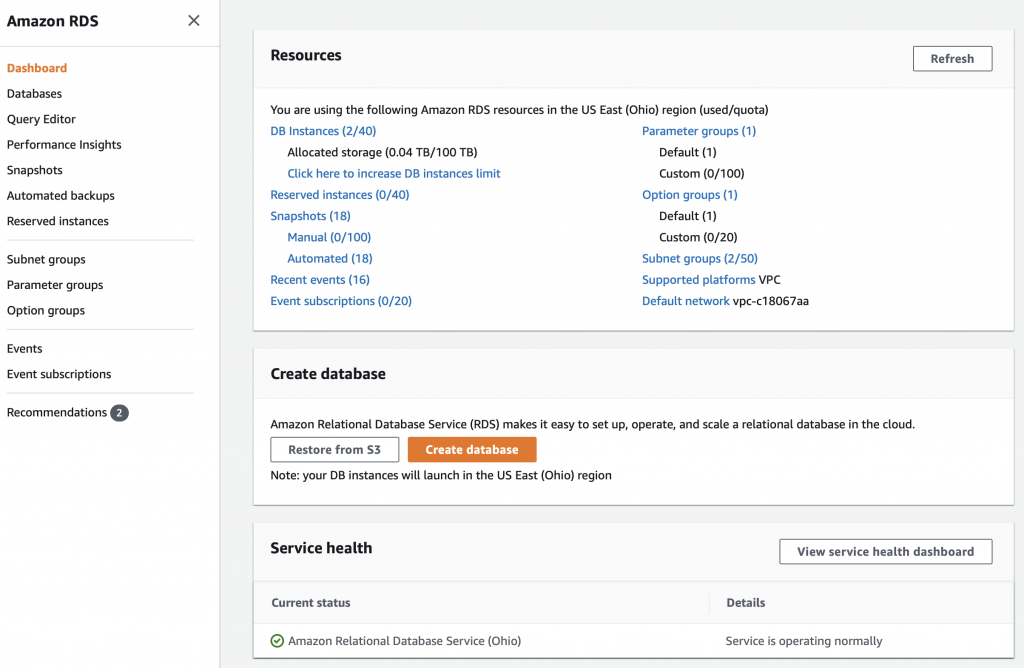
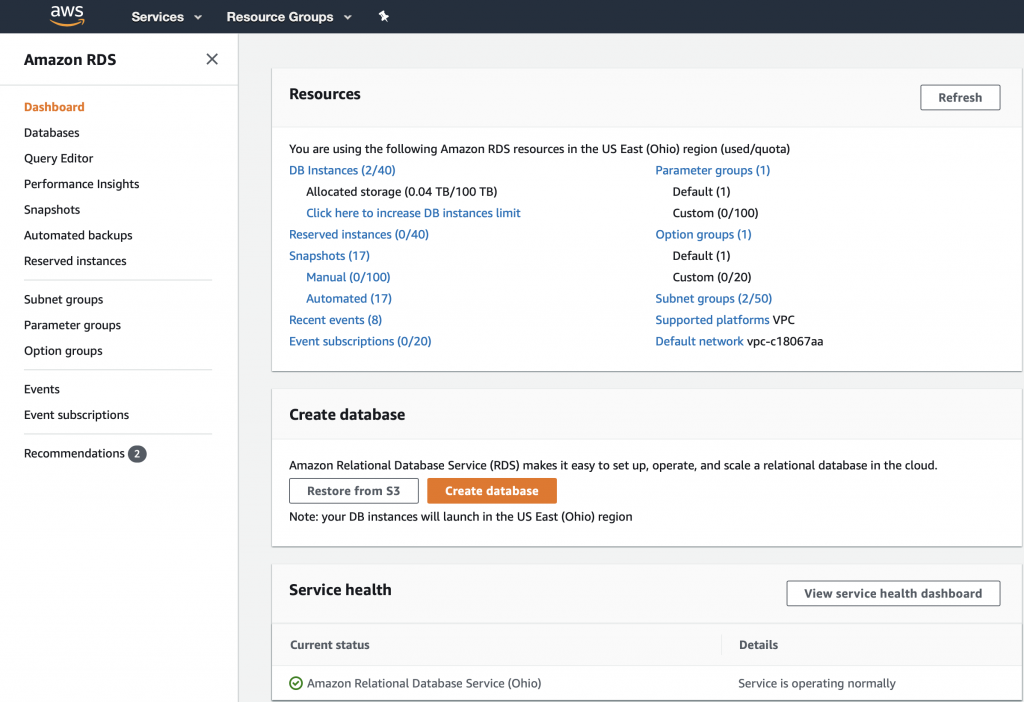
You will arrive a screen that should look something like this one.  I say should because 1) they like to change things around and 2) I already have some stuff going in my RDS setup. To create a database click  on “Create database”


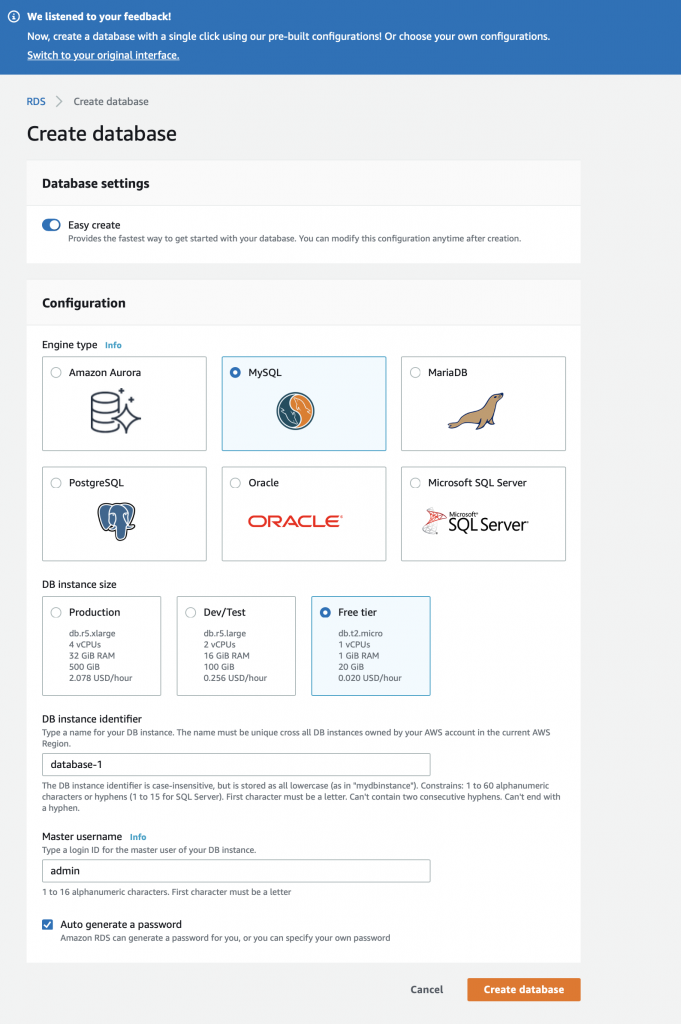
When you get to the create database screen it will give you some options.  Notice at the top of my screen shot they are already offering me a new user interface.  For the first database select:

  • Easy Create
  • MySQL
  • Free Tier
  • DB instance identifier (I leave the default database-1)
  • Master username = admin
  • Autogenerate password

Then press “Create database”

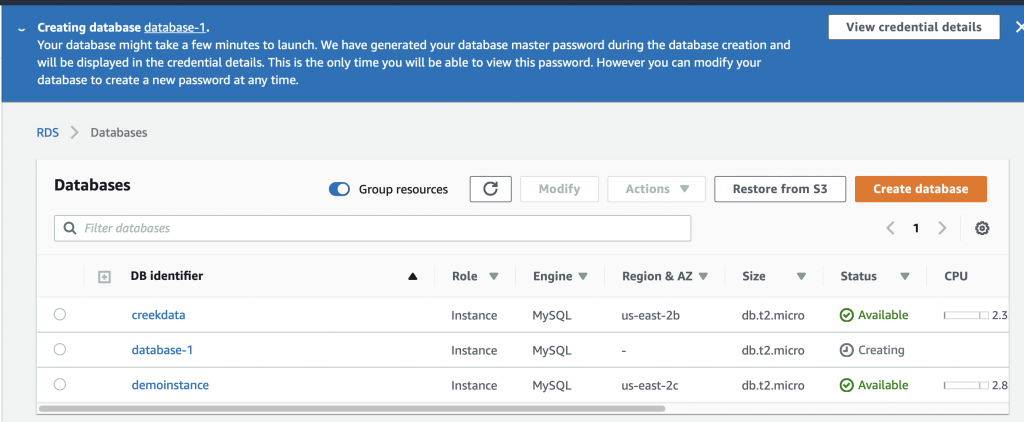
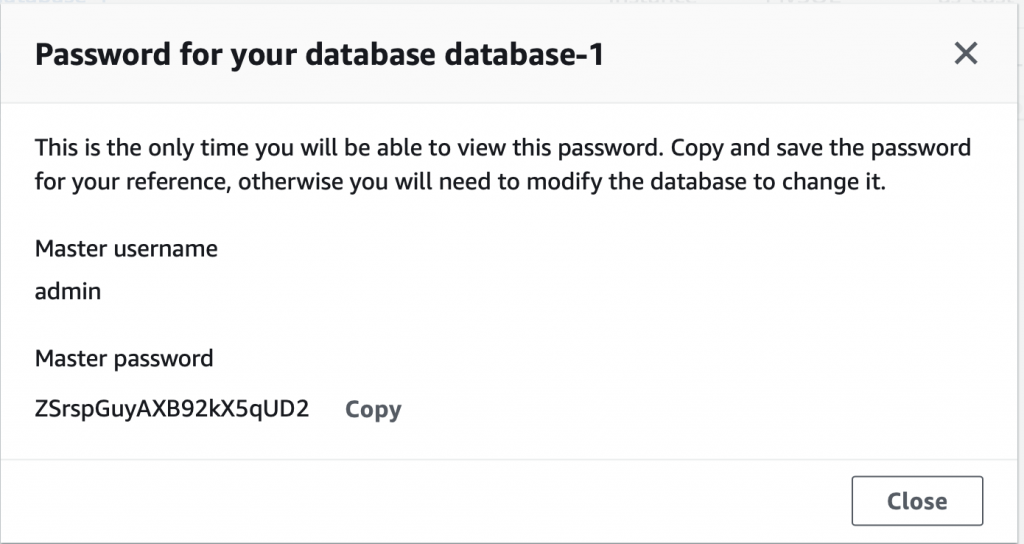
Creating a database takes about 5 minutes.  In the screen shot below you can see that it is “Creating” and that I am already running two other databases.  Also you can see at the top of the screen it says “View credential details”.  This is where you find out the password that was automatically created for you.  If you leave this screen without the password your database becomes inaccessible and you will need to delete it.

When you click the details screen you will get something like this:

Once the database is created your screen will look something like this:

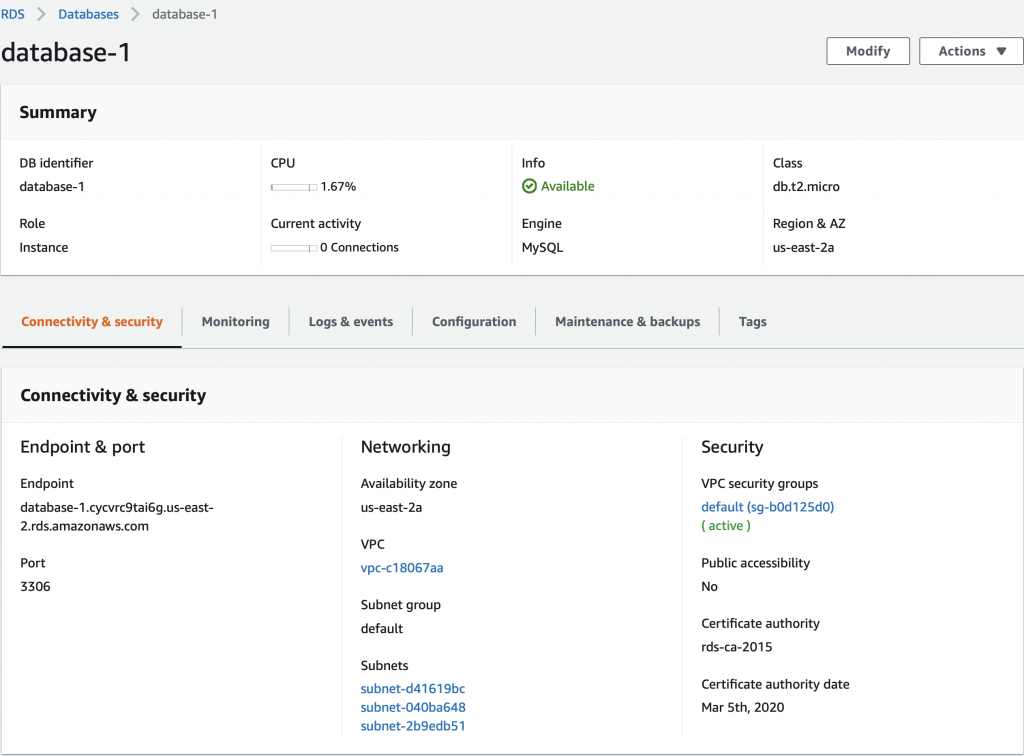
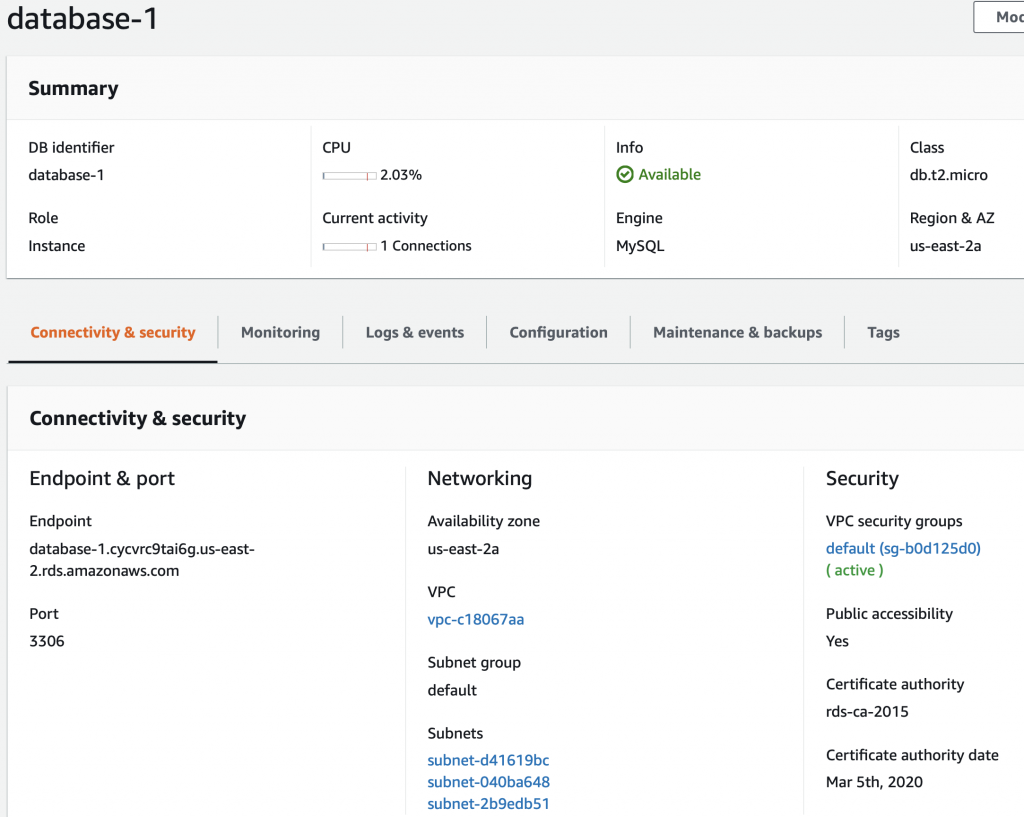
When you click on database-1 (the one we just created) it will show you details about the database.  This screen has a bunch of useful information including the endpoint a.k.a the DNS name of your database.

Create MySQL WorkBench Connection

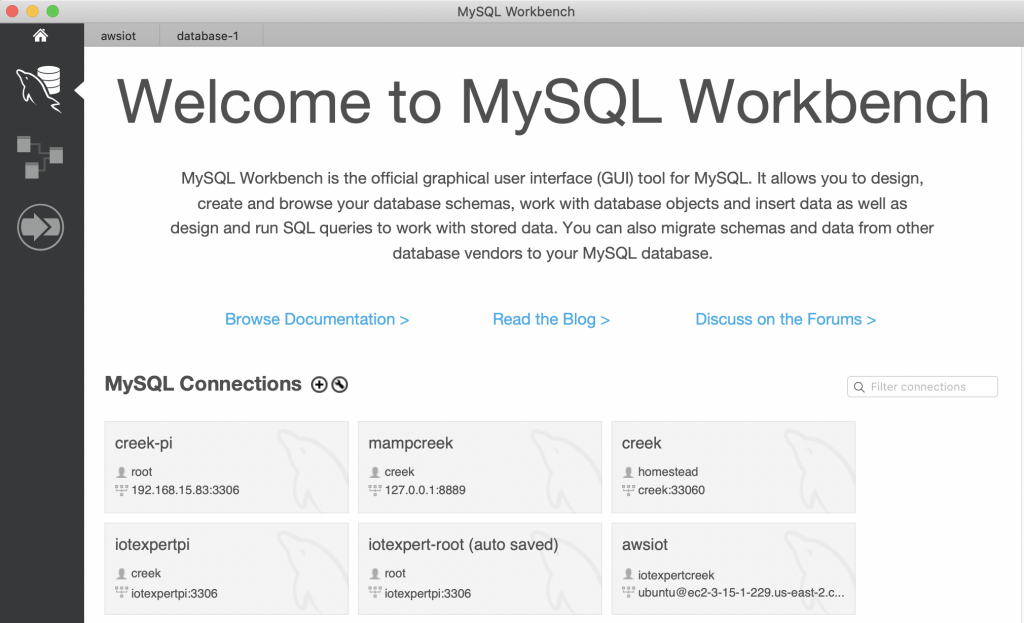
I am not a real database administrator so I like to use the MySQL Workbench GUI to access my database.  To make a new connection, press the little plus next to MySQL Connections.

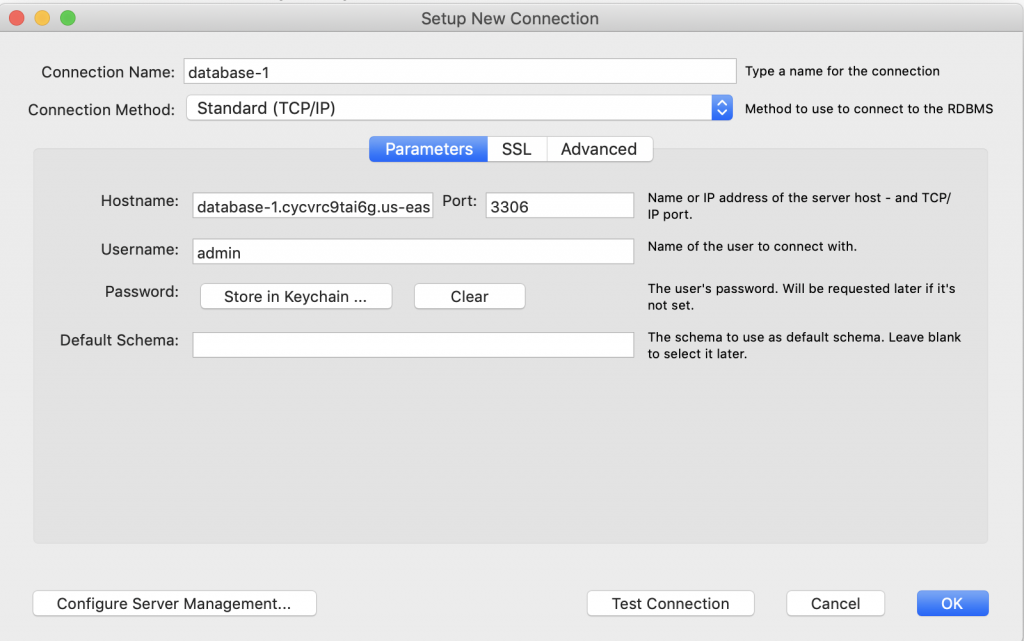
On this screen you need to provide the hostname, which in Amazon terms is the endpoint.  You also need to give the Username (which in my case was default admin) and the crazy generated password.

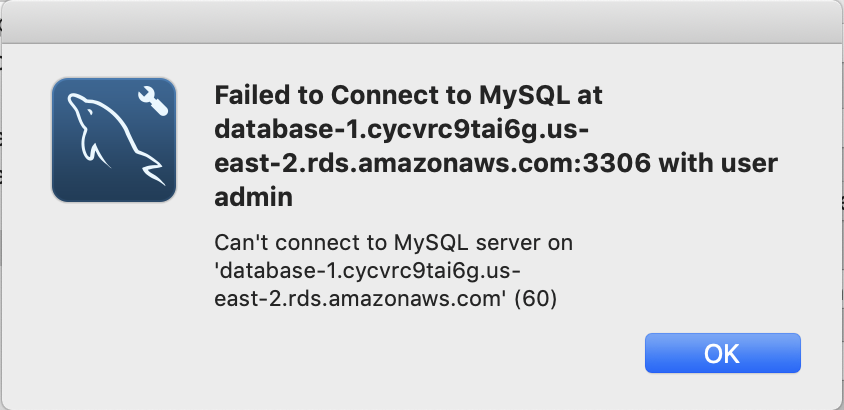
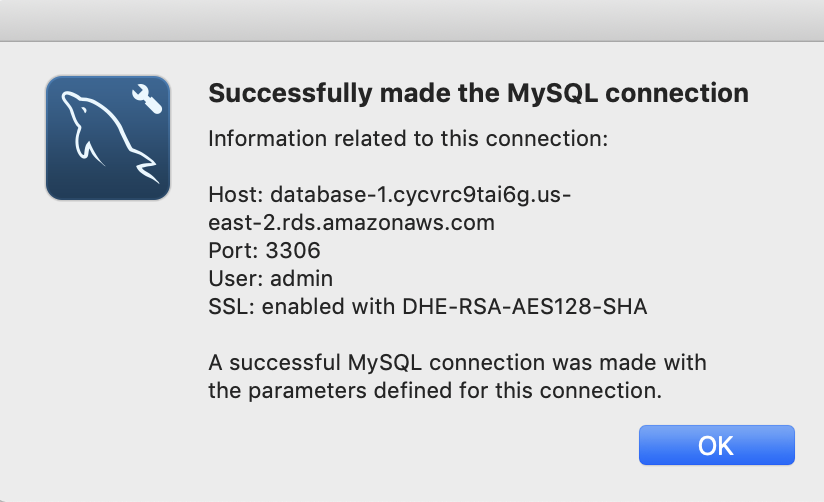
When I press the “Test Connection” I get this lovely message.

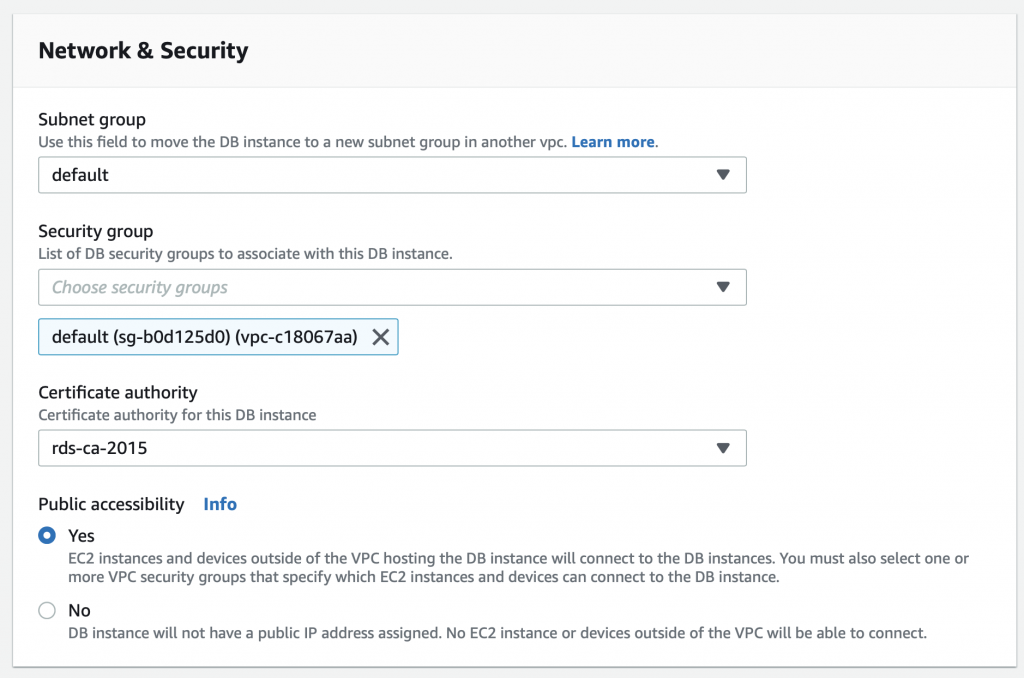
The problem is that my database is not “Publicly available”  To fix this click on “Modify”

Then scroll down to “Network and Security” and select “Public accessibility” and pick yes.

Then scroll down some more and pick “Continue”

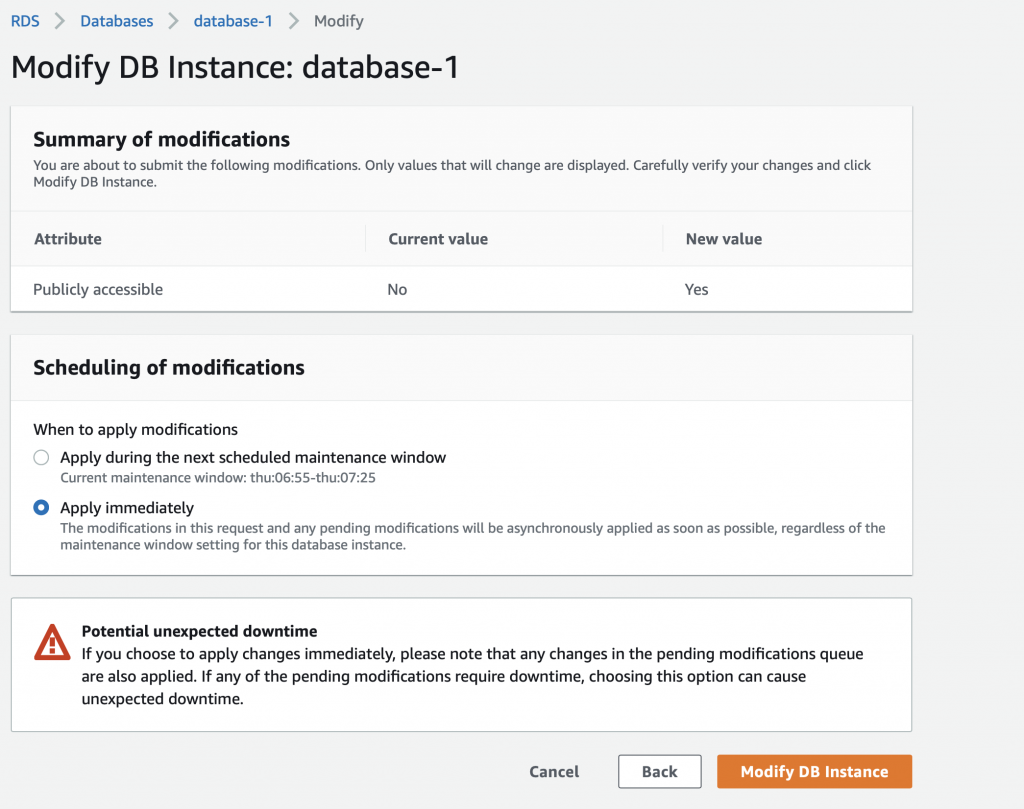
It will then ask you when?  Tell it NOW!!! right NOW!!! I can’t WAIT!!!  But seriously, it doesn’t matter because we don’t have anything in the database and no connections.

On my database this takes about a  minute… so be patient. I wasn’t and the connection didn’t work and I went looking to figure out why.  I finally realized that it was because it took a while to make the change.  Now when I test the connection it says:

And when I open the connection it works.

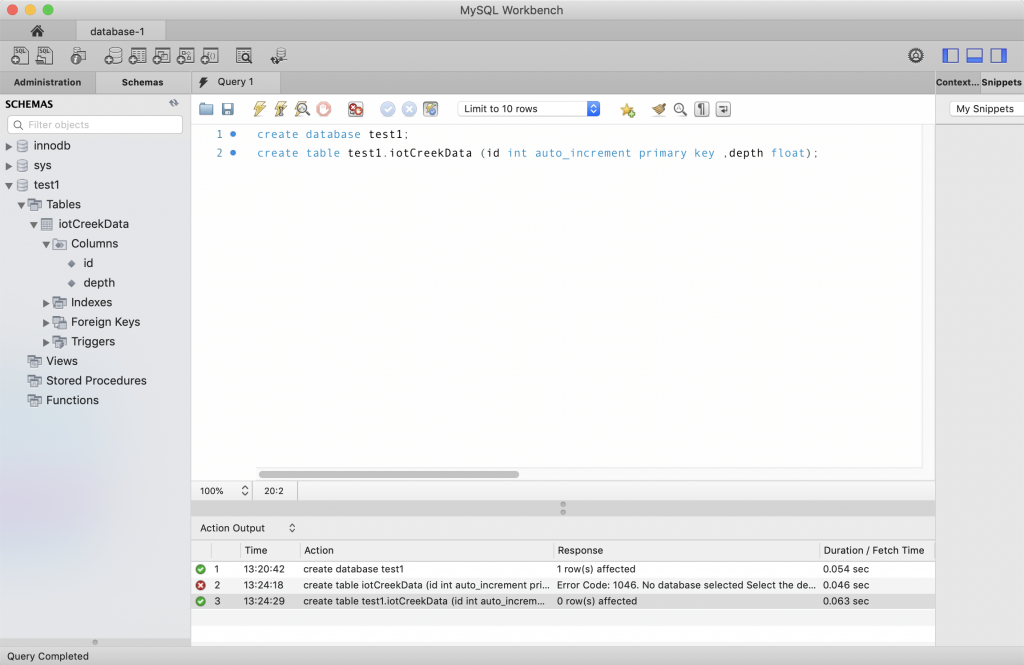
Now I can make database and a table.

Examining the Security

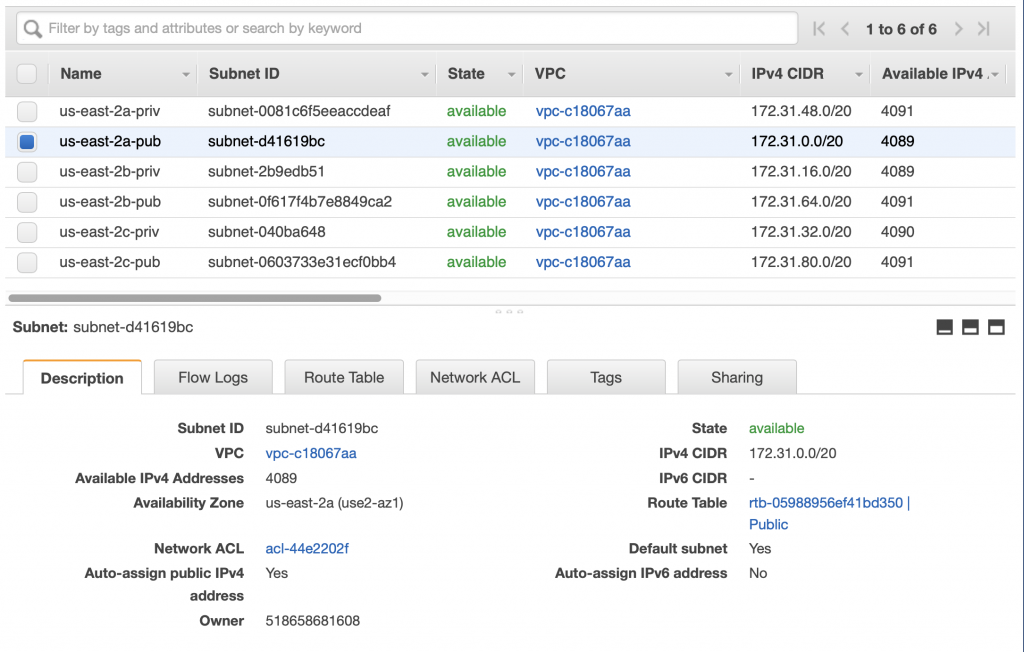
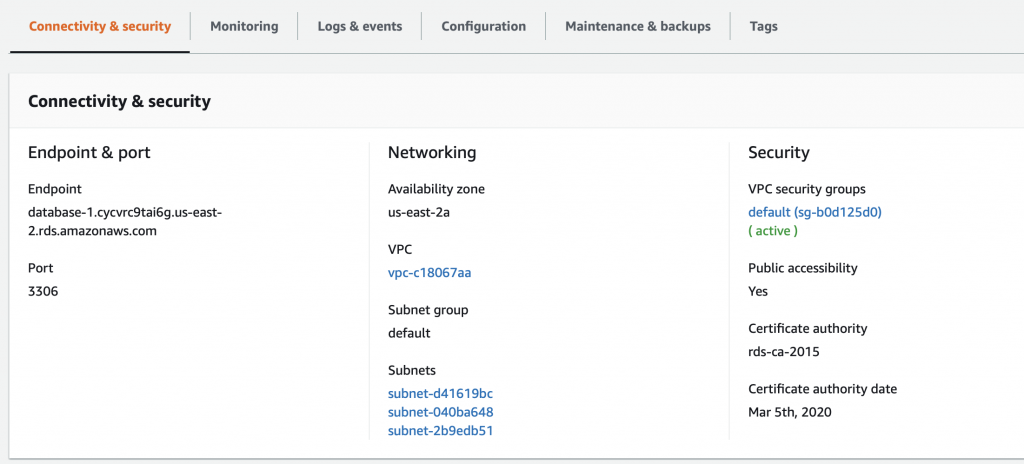
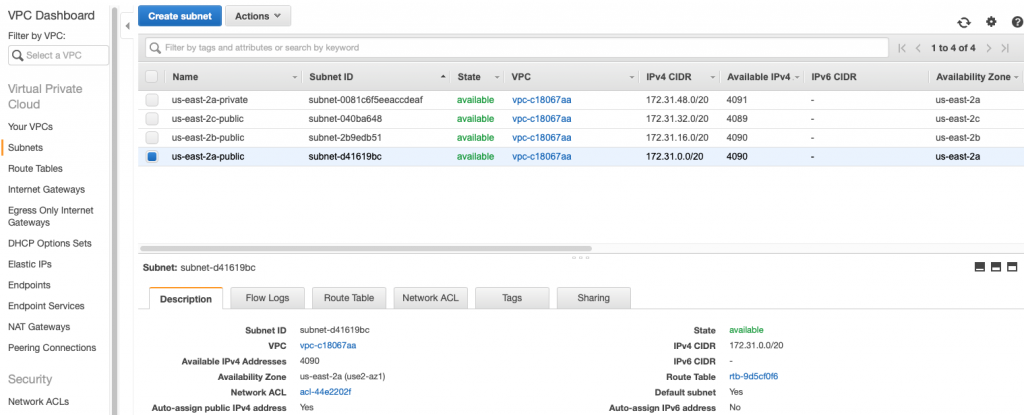
A couple of things to notice about this database.  First, this database is setup to run on us-east-2a.  And that the database is in the “Default” subnet group which is either subnet-d41619bc, subnet-040ba648 or subnet-2b9edb51 (three subnets in the three availability zones in us-east-2).  For some reason which I can’t figure, they don’t display which subnet instead they make you figure it out by combining region and you knowledge of the subnets.

But wait is that subnet public or private?  And which one is it?  If you go to the AWS console for the VPCs and then click on the subnet tab you will find this configuration (at least in my VPC).  I did this work for the article I did on VPCs where I setup one private and one public subnet for each of the availability zone in the us-east-2.  From the screen above you can see that my RDS is setup in us-east-2a which means that it is on subnet-d41619bc.

Notice that I gave that network the name us-east-2a-pub because it is a PUBLIC network.  Which you can see when you click on it.  Notice that the Route Table is Public.

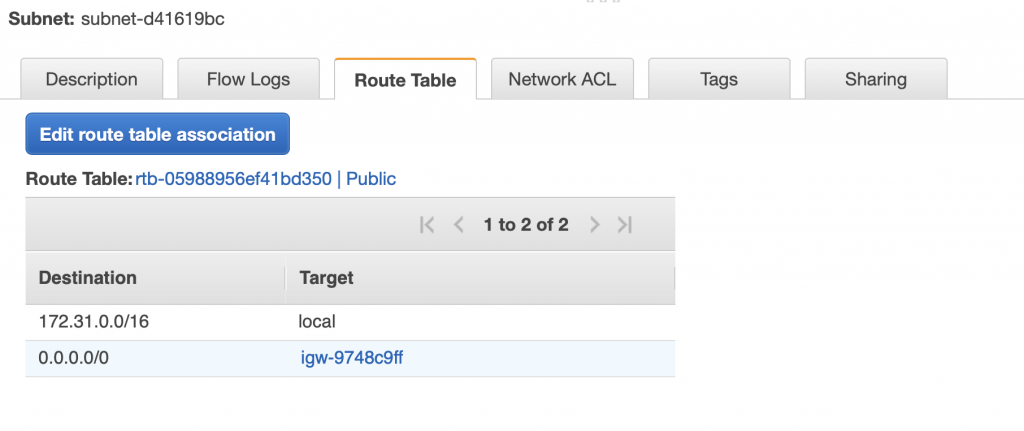
When you click on “Route Table” you see that it has 0.0.0.0/0 sent to the Internet gateway named igw-9748c9ff

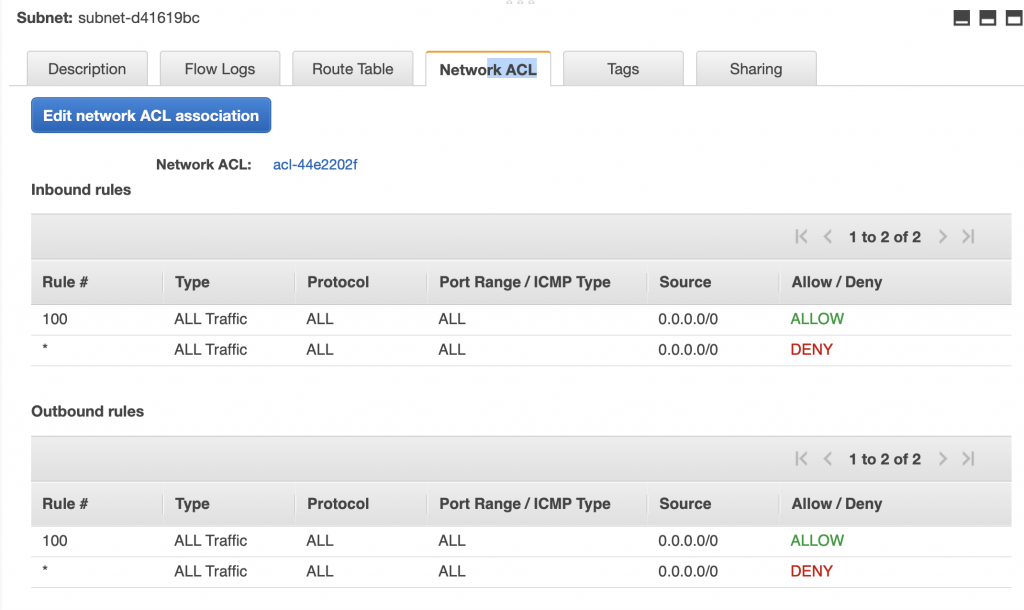
And that the Network ACL allows all traffic to and from the subnet.

Rethinking the Security & Subnet Groups

Having a MySQL database server directly connected to the public internet may not actually be such a good idea.  Whatever application you develop for sure wants to be able to connect to it, but do you really want the rest of the world hacking at it?  Probably not.  If the database server is attached to a private subnet that only servers that are inside of your VPC are allowed to attach to it.

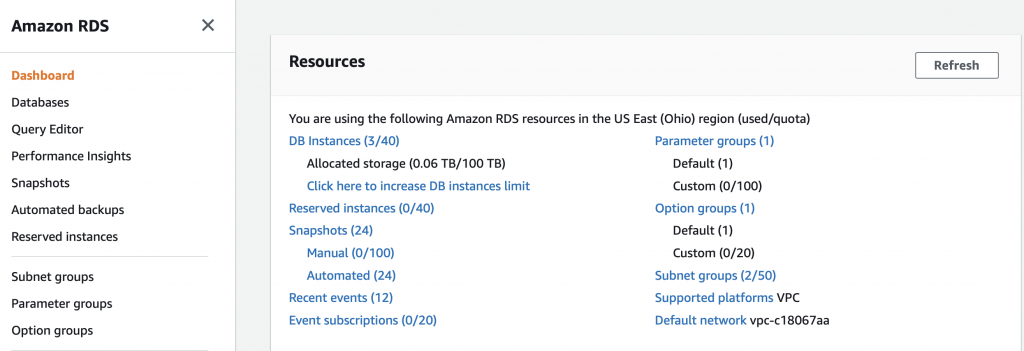
How do you move a RDS from a public to a private subnet?  Well, unfortunately, there is no good way to do that (there is a way but just not very good) and you actually needed to get it into the correct subnet when you created the database.  But you might ask yourself, there was no place on any of those screens to setup the subnet.  And that is true.  BUT you can tell it which “subnet group” to attach to.  A subnet group is literally just a list of subnets with a name.  On the RDS console on the far right there is a link to subnet groups.  In my class the link says “Subnet Groups (2/50)”.  It sure seems like this tab should be on the VPC screen and I can’t think of any reason they wouldn’t have put it there.  But there it is.  When you click on the “Subnet Groups…”

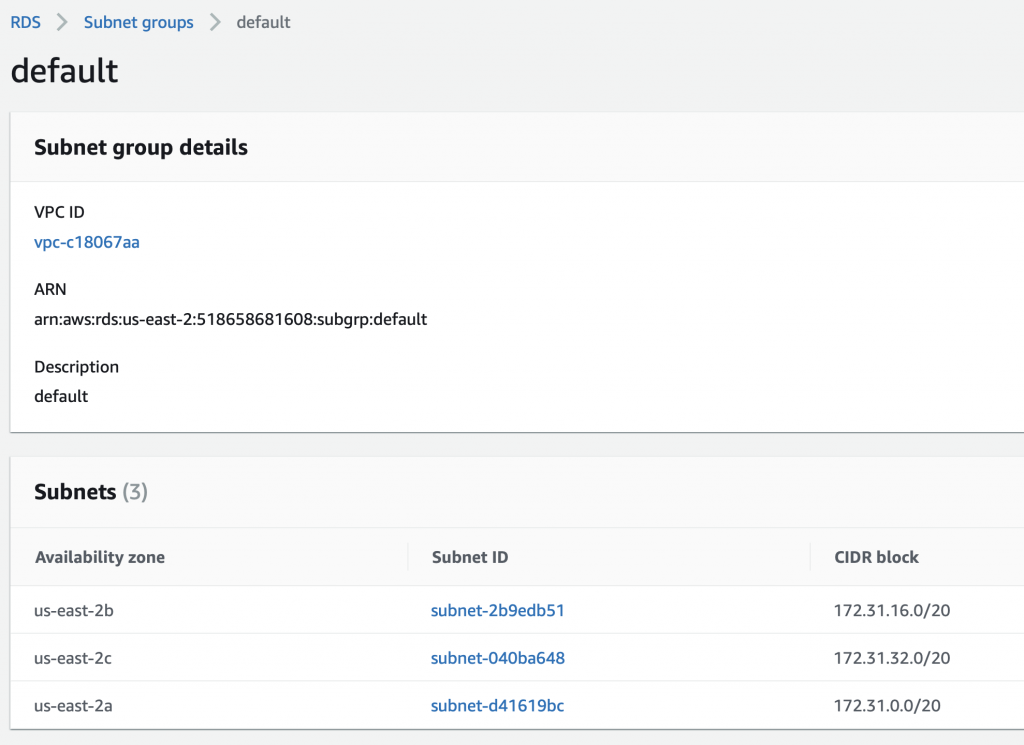
You see that there are two subnet groups.  One called “default” and one called “test1” (which I created while I was making all of these screen shots).  If you click on default …

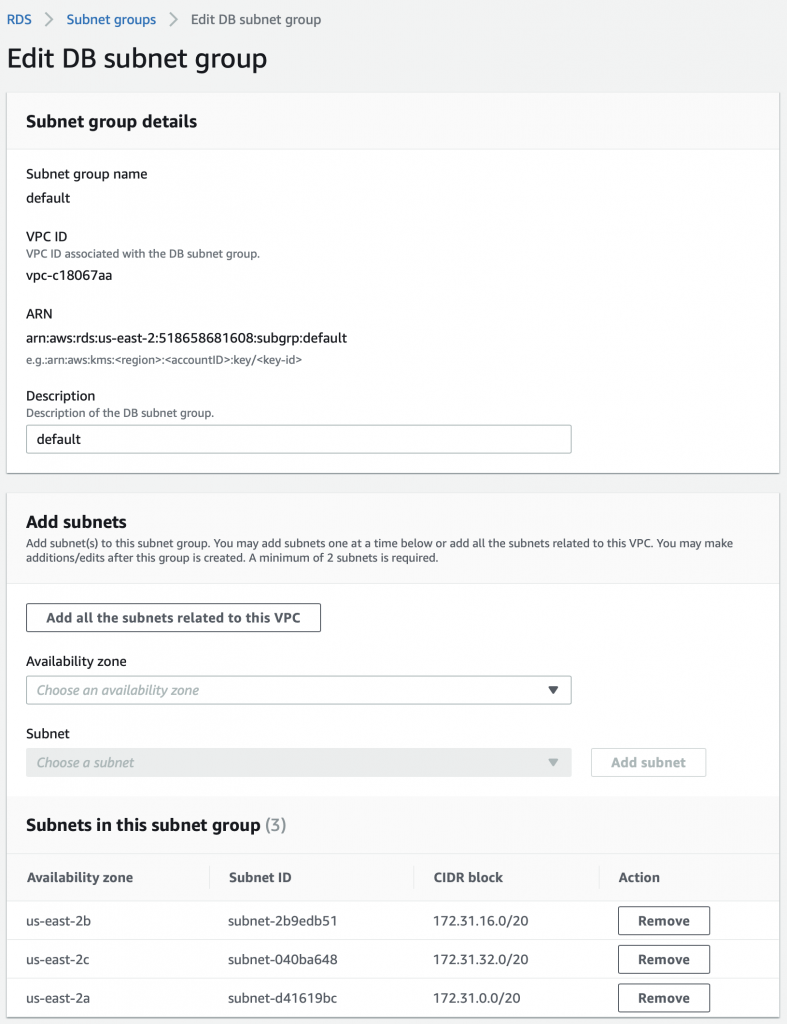
You will see that this group contains 3 subnets.  In fact this group was created automatically for you and contains ALL of the subnets in your VPC that were automatically created for you when the VPC was created.  Since that time I made some of them private which is the source of confusion.

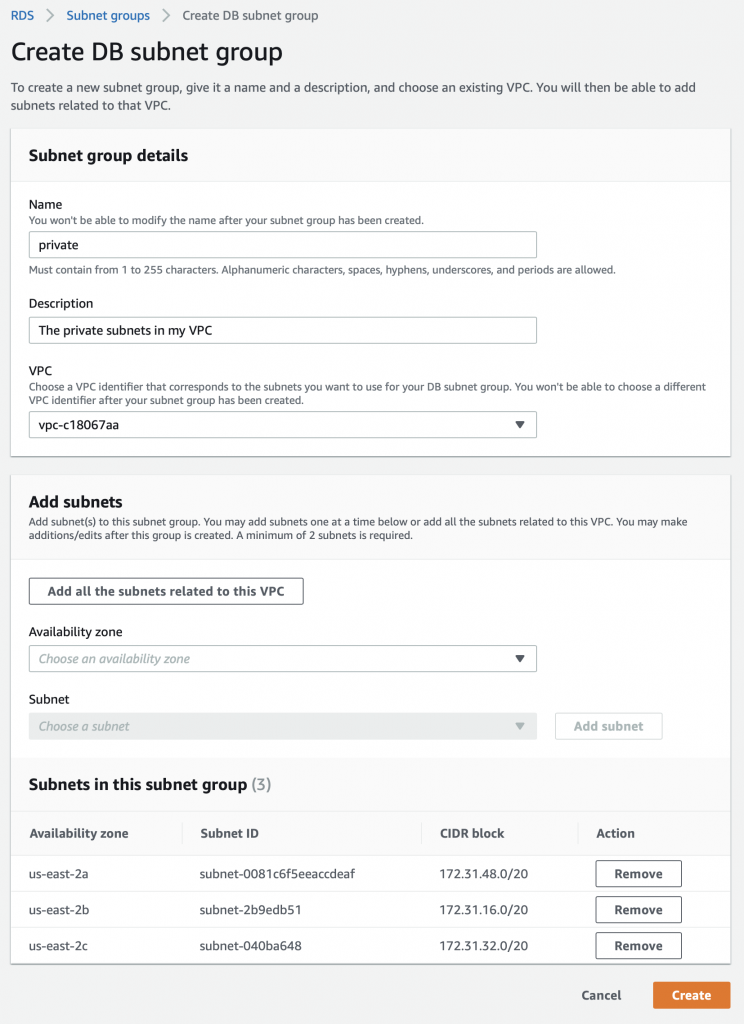
In order to create a new subnet group you click on the button “Create DB Subnet Group”

Then set things up:

  • Named the group “private”
  • Made a short description
  • Clicked “Add all of the subnets in the group”
  • Then I removed the public ones.
  • Then press create

Alternatively, you could just add the private ones by selecting the availability zone, then the private subnets.

Configure Security Groups

The next thing that is goofy in security is that when I click on the VPC security groups I can see the security configuration for that subnet.

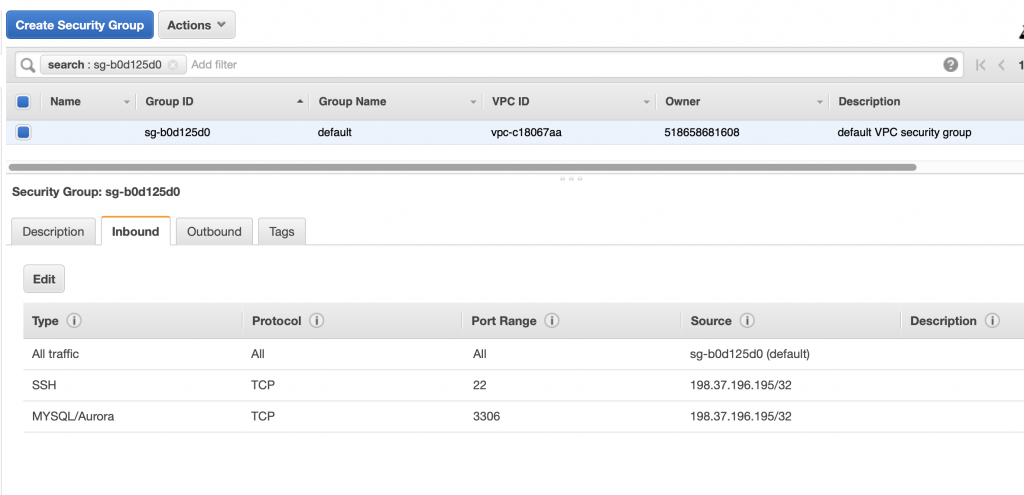
When I click on that security group you can see that the Amazon helped me by adding an Inbound rule to the security group to allow connections from 198.37.196.195 (which is the current IP address at my house) on port 3306.  In other words it poked a hole in the firewall that was limited to MySQL connections from my house… which I suppose is cool until my DHCP address changes.  Oh well.

Create the Database I Really Want

OK lets create the database that we really want.  First, I will delete the database that I don’t want because there is not really any way to move it to another subnet.  Well, that actually isn’t true.  Apparently you can create a new VPC, transfer the RDS to the new VPC, then transfer it back to the original VPC, then delete the temporary VPC.  But that isn’t what I’m doing.

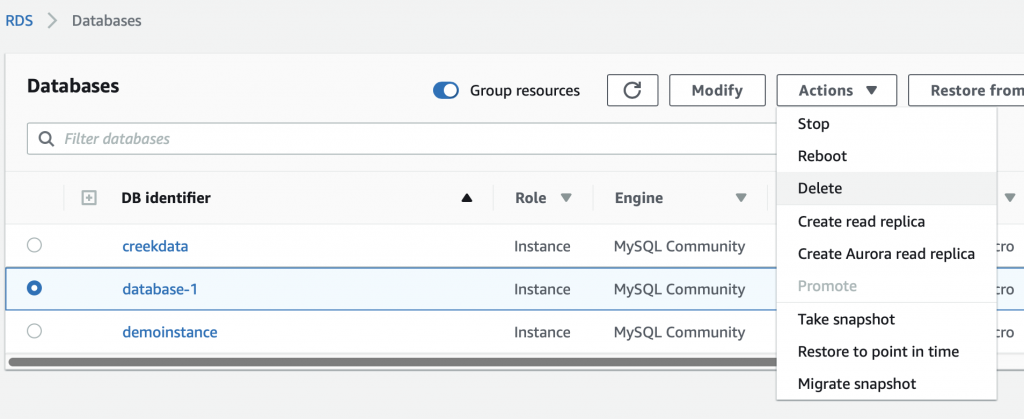
If you select the database, then select actions->delete.

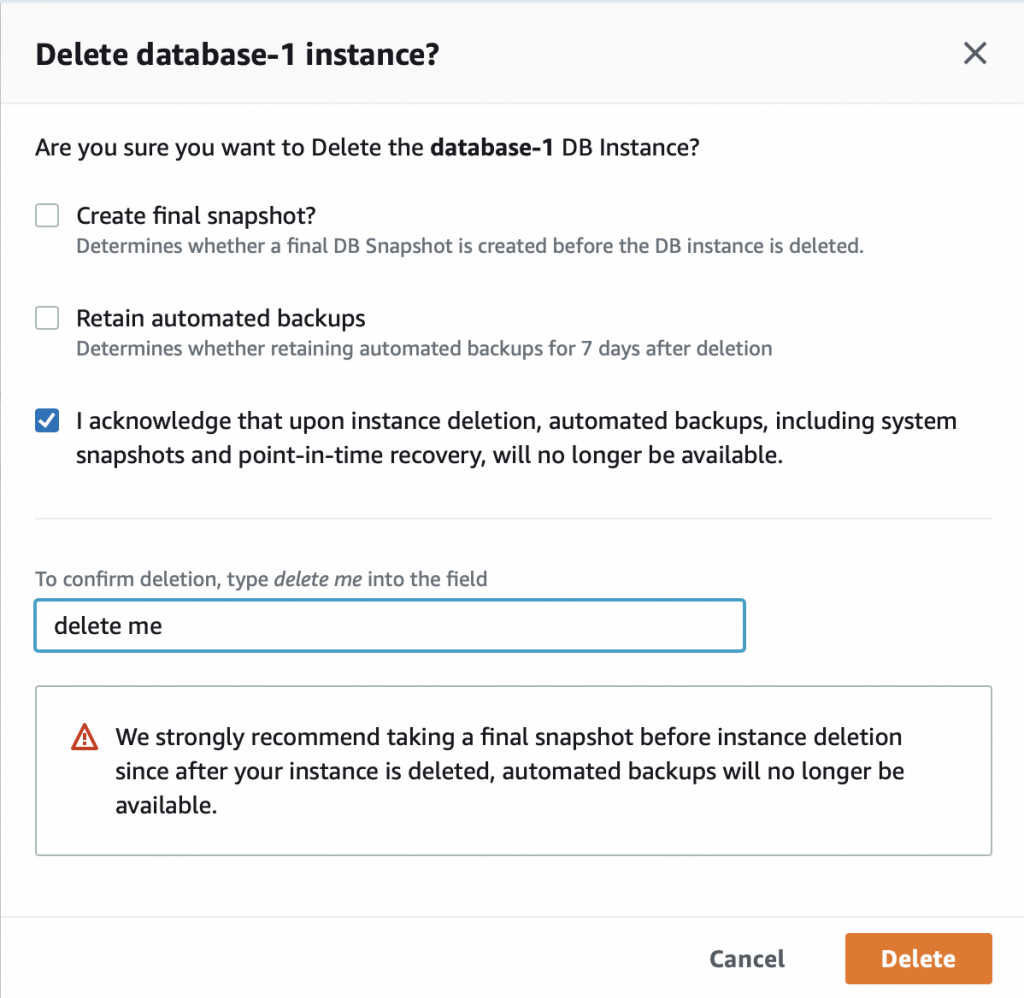
It will ask you if you are SURE!!! Because there is no data in the database I turn off the final snapshot.  I acknowledge that Im really sure… and then press “delete me”

Then it takes a bit of time to delete.

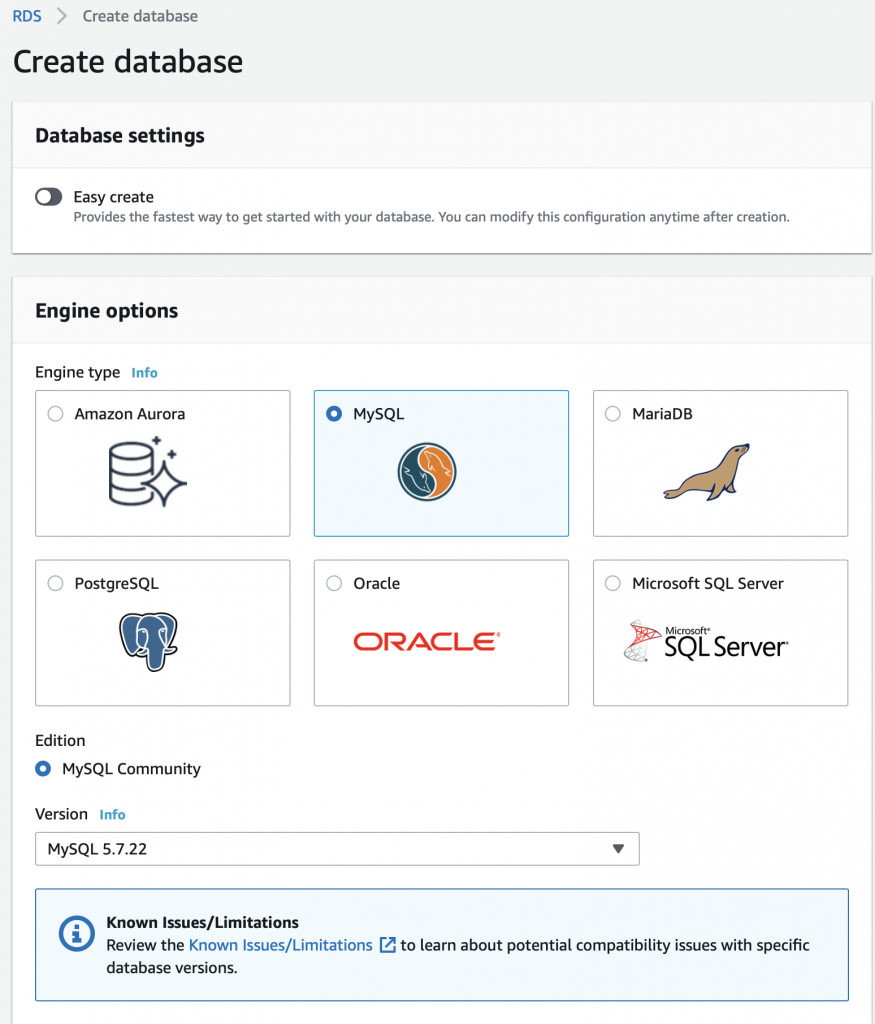
Now I press Create database. Turn off easy create (so that I get access to the option to place the the new database in the correct subnet group.

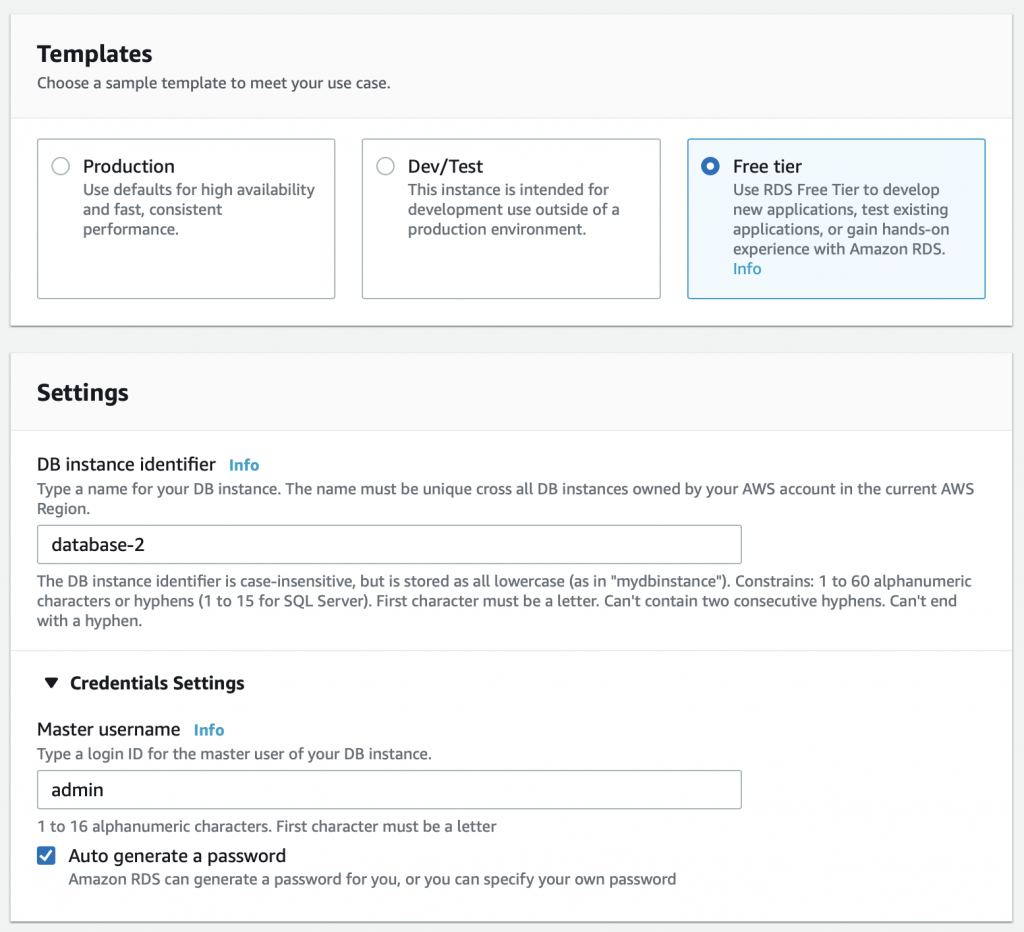
Free tier is plenty good for this setup.  And I don’t really care what the name of the database is.  As before I’ll let it generate the password.

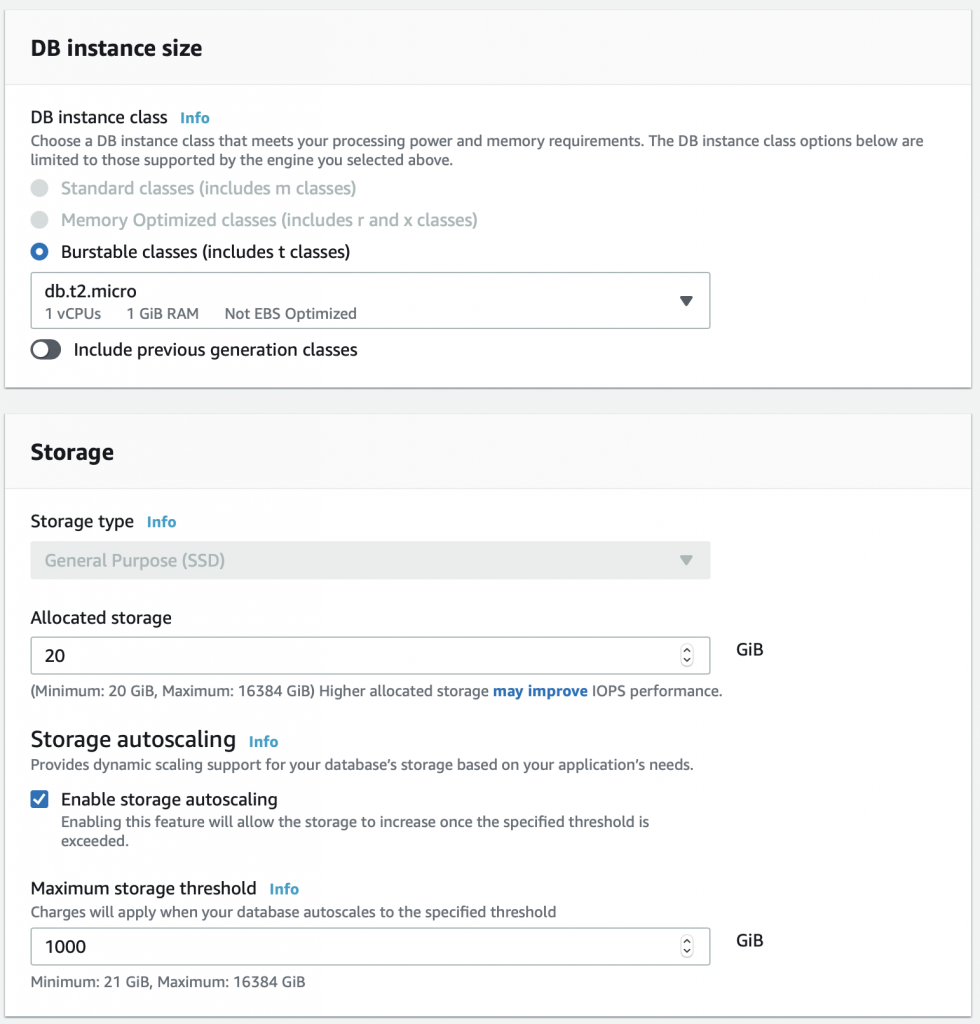
No choices on the instance size.

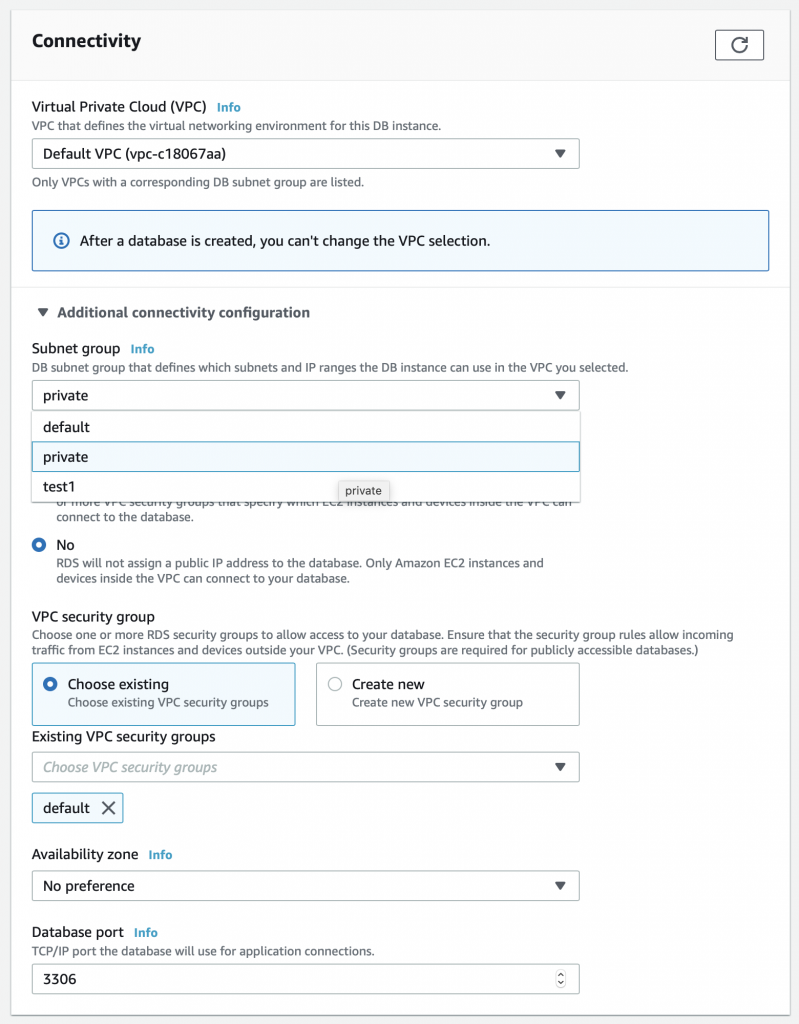
Finally in the connectivity section there is something interesting.  You need to expand the “additional connectivity configuration” to see these options.  Specifically, I can pick out the subnet group for this RDS instance.  Recall from above I created the private subnet group.  Pick it.

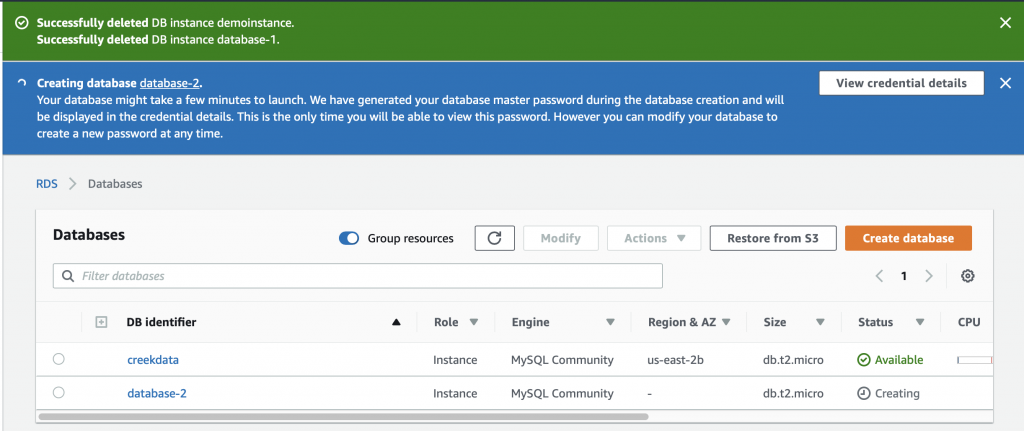
When I press create, I get this screen … sweet success.

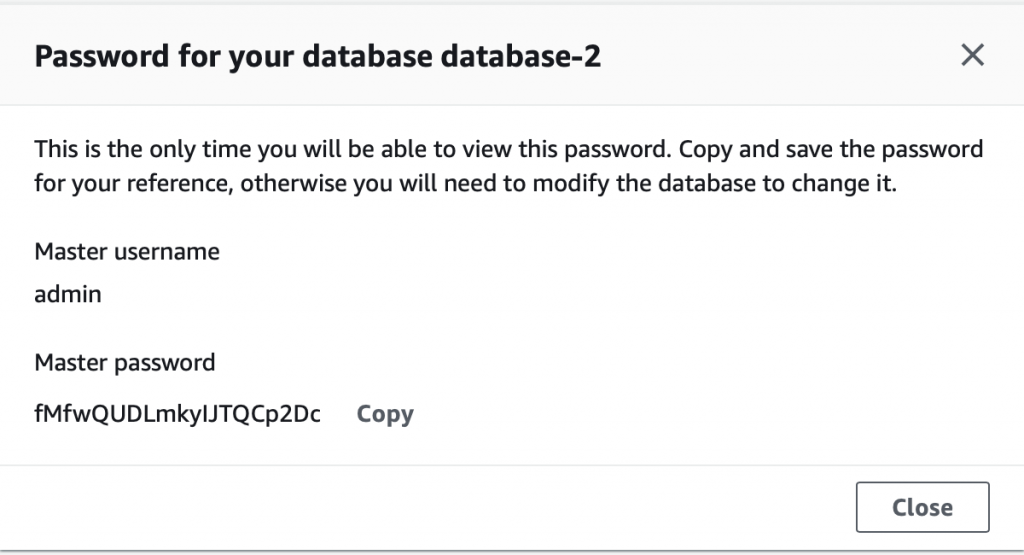
And once again it creates credentials for me.

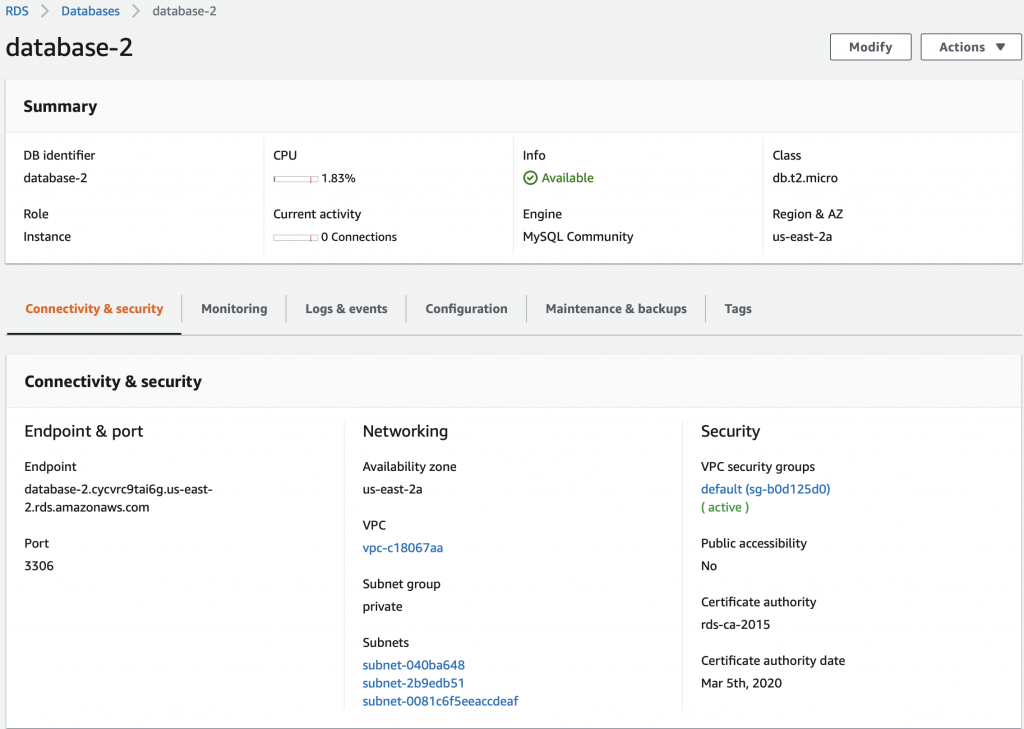
Now I have “database-2” which is running in “us-east-2a”

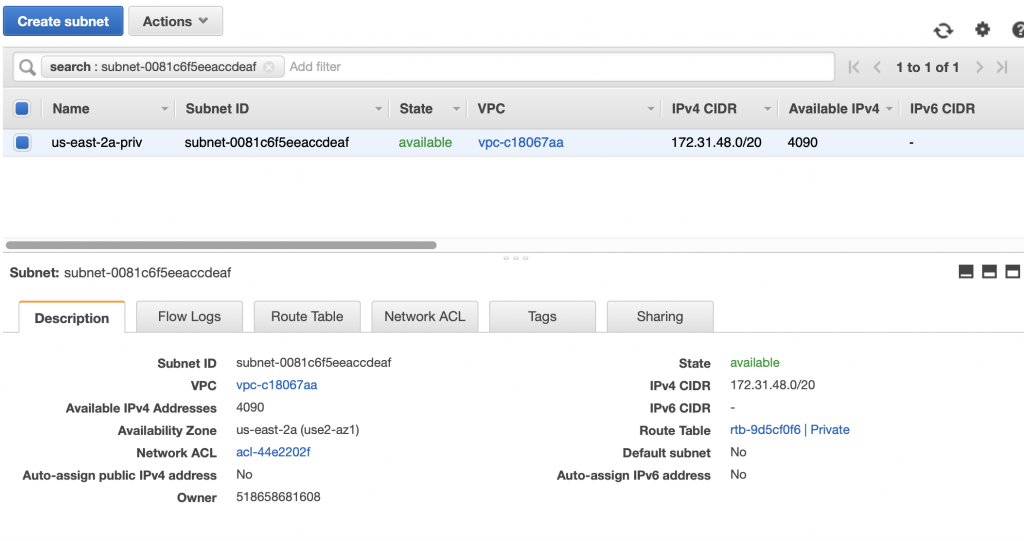
Click on database-2 and you can see that it is in the “private” subnet group.  If you look higher in this article you will find out that it MUST be running on subnet-0081c6f5eeaccdeaf.

When I click on that subnet I find that it is a private subnet in us-east-2a.  Notice that the route table is marked as “Private”

MySQL WorkBench EC2 Tunneling over SSL

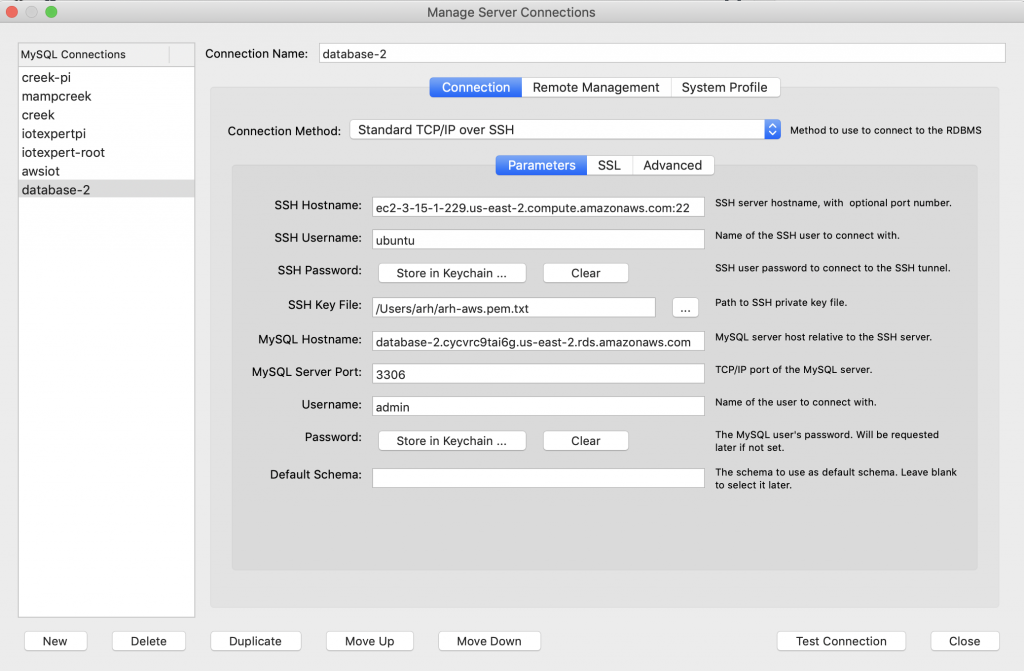
All that security is cool and everything.  But, How do I talk to the database?  Well, the answer to that question is that the RDS server is running in my VPC and any computer that is attached to that VPC can talk to the database server.   To make all of this work, I run an EC2 server in my VPC.  You can only attach to this server if you have the RSA keys.  But that still doesn’t answer the question how do I connect from my computer.   The answer is you need to do MySQL Tunneling over SSL.  To set this up in MySQL Workbench, first create a new connection.

  • Pick the connection method as “Standard TCP/IP over SSH”
  • Set the SSH Hostname to be your EC2 Instance
  • Set the User (I have the default ubuntu)
  • Make a link to your keyfile
  • Give the DNS name of your RDS Server
  • The user name (remember from above it is admin)

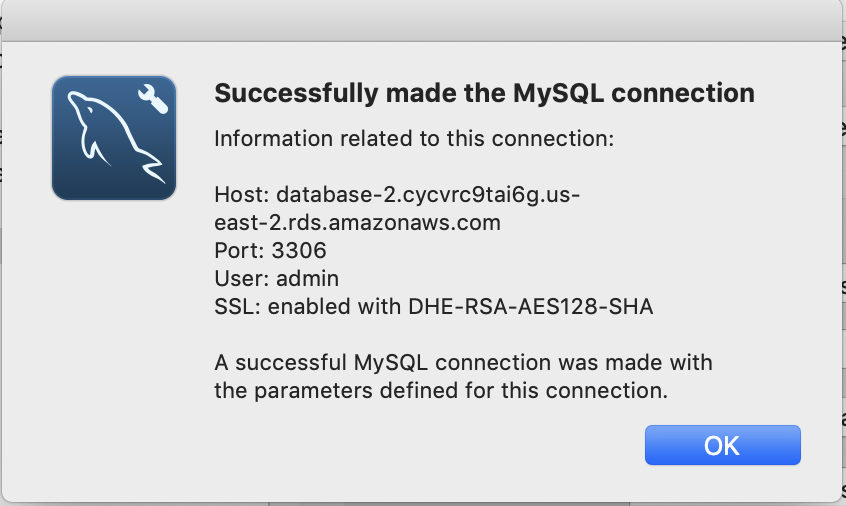
Now when I test the connection… sweet success.

And now I can talk to the MySQL server (and do whatever SQL stuff I want)

In the next article I will create a lambda function to send data onto the RDS database.

Amazon AWS Virtual Private Cloud (VPC)

Summary

In order to interact with AWS you need some basic understanding of how the Amazon Virtual Private Cloud (VPC) fits together.  I generally find that writing things down is a huge help in cementing my understanding of a topic.  For me, that is the point of this article, making sure that I understand how the AWS VPC fits together.  I will preface all of this by saying that I am hardly an AWS networking expert so your mileage may vary but I hope that it helps you understand. For some reason, I mostly dug around inside of the AWS console to figure it out before I realized that there is a huge amount of documentation and tutorials out there.  At the end of this article I will link to the documentation etc. that I thought was useful.

The sections of this article are:

  • Overview of AWS VPC Architecture
  • Region
  • VPC
  • Availability Zone
  • Subnet
  • Internet Gateway
  • Routing Table
  • Network ACLs
  • Security Group
  • Subnet group
  • A Stern Warning
  • Documentation and References

Overview of AWS VPC Architecture

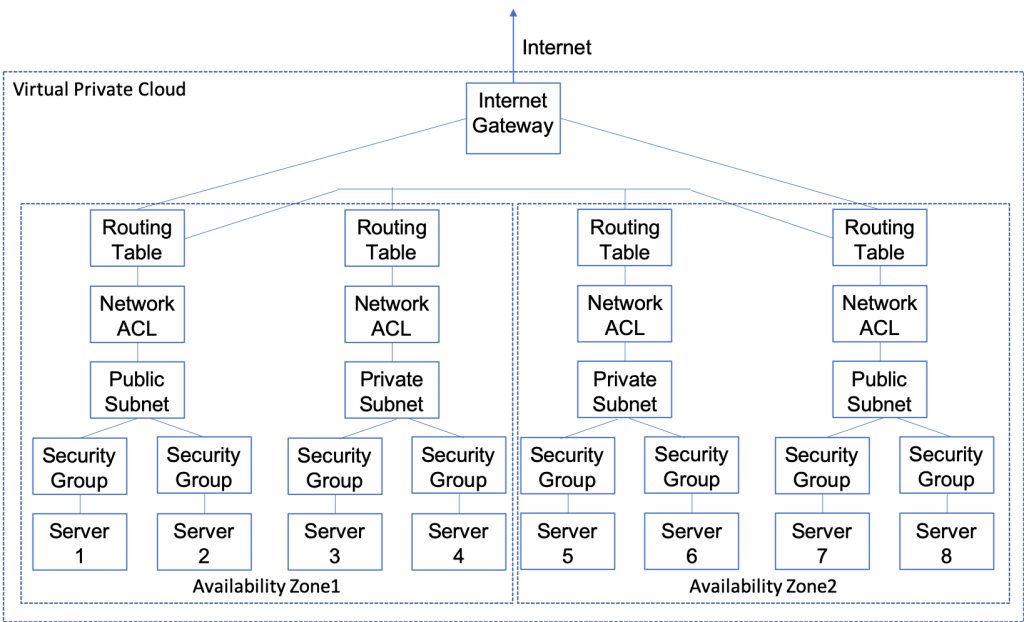
Amazon Web Services (AWS) is divided into 16 Regions (for now).  In any Region, you can create a Virtual Private Cloud (VPC) essentially a private network for you to attach AWS services to e.g. EC2 or RDS.  In each Region there are several Availability Zones, which you can think of as completely independent, physically separate, redundant computer rooms.  Although these Availability Zones are independent, they are also closely linked from a network standpoint.  A subnet is just a IP address range of a related group of servers that must fit completely in one unique Availability Zone.  In your VPC you should have at least one subnet per Availability Zone .   Each subnet is connected to your VPC by a routing table which can be shared by one or more subnets.  In other words, your subnets are connected together via routers and you control the routing tables. Your VPC can be connected to the public internet via up to one Internet Gateway.   In the routing table, you optionally specify a route to the public internet, which creates a public subnet.  If there is no route to the internet then the subnet is considered a private subnet.  Each subnet has an optional Network Access Control List (ACL) which allows you to secure that subnet by IP address and IP Port number.  A security group is an instance (server) level of access control – just like a ACL but on a server by server level.  It is called security group because you can apply the same list of rules to multiple servers.  Missing from the diagram is a subnet group.  A subnet group is a just a named list of subnets.  Subnet groups are used by some of the AWS systems e.g. RDS to choose which subnets to attach to.  I will talk in more details about them in the RDS article.

The picture below is a LOGICAL diagram to show how data flows inside of the VPC. You can see that I have two availability zones, each with a public and a private subnet.   Each subnet has it’s own routing table and network access control list.  And there is one Internet gateway which is routed to the two public subnets.  There are 8 servers which are attached two each of the subnets.  Each server has a security group.  The main point of all of this is that for devices to talk all of these things need to be configured correctly.

  • Internet gateway
  • Routing tables
  • Network ACLs
  • Security Groups

I guess the good news is that when you create an AWS account it default configures all of this stuff to a semi-sensible starting point.

Region

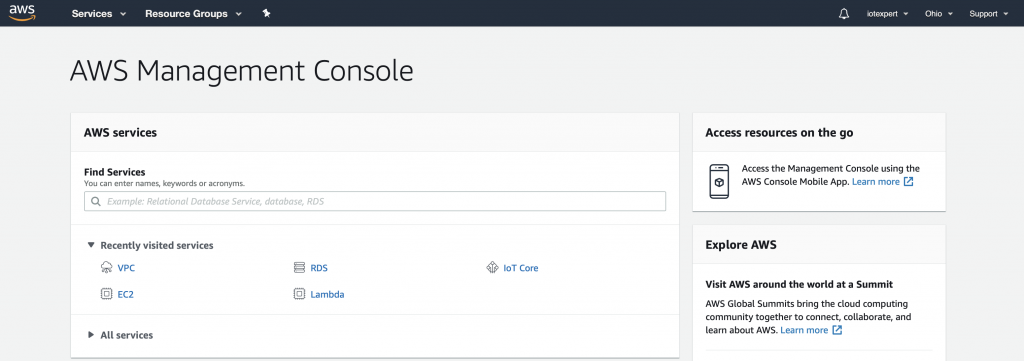
When you create your AWS account Amazon will select a default region for you.  When you are logged into the console you can see your region in the upper right.  In this case my region is Ohio.

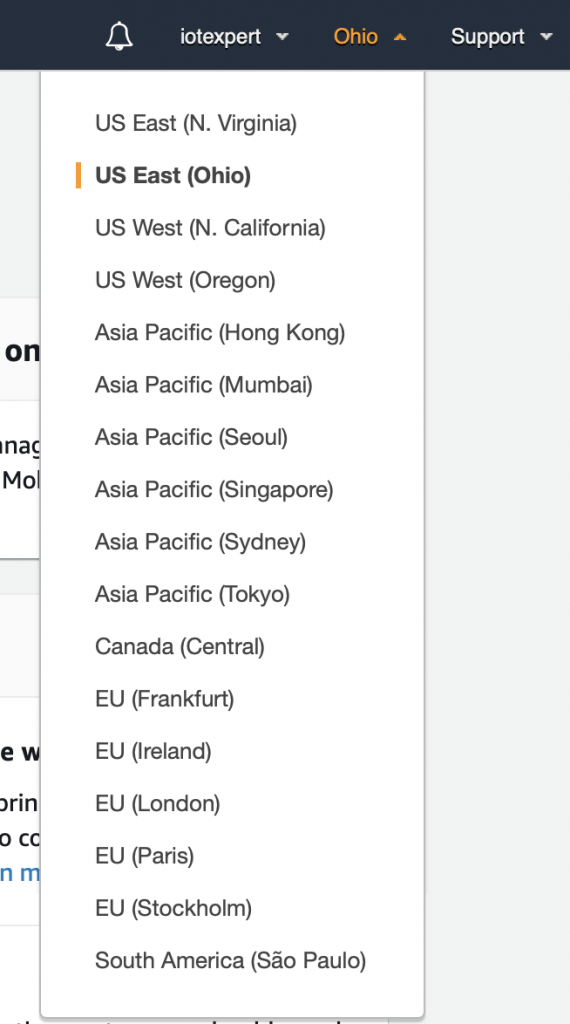
When you click on the region you can see all of the available regions.  Currently, there are 16 of them.

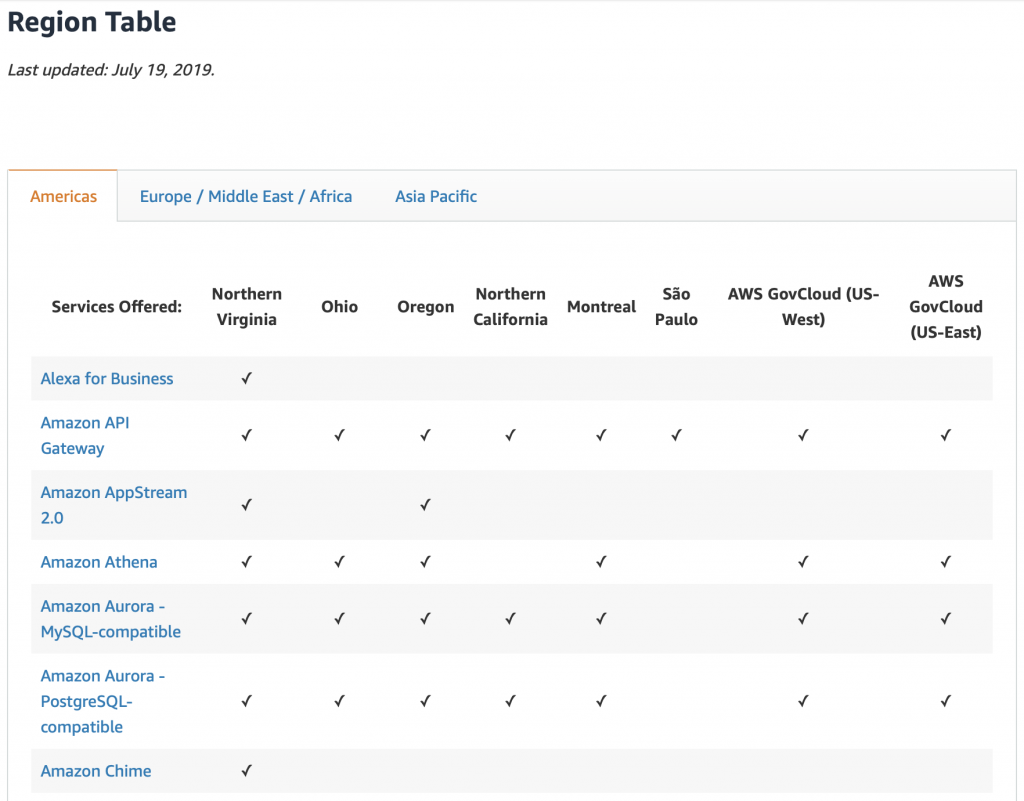
Each region has different services available.  You can see the whole list here.  But this is a snapshot of the top of that page.

Virtual Private Cloud (VPC)

The Amazon marketing material has a nice description of the VPC. “Amazon Virtual Private Cloud (Amazon VPC) lets you provision a logically isolated section of the AWS Cloud where you can launch AWS resources in a virtual network that you define. You have complete control over your virtual networking environment, including selection of your own IP address range, creation of subnets, and configuration of route tables and network gateways. You can use both IPv4 and IPv6 in your VPC for secure and easy access to resources and applications.”

In any one region you can have up to 5 separate VPCs (at least without special $$s to Amazon).  Each VPC has a control console that lets you edit, update, and manage the configuration of your VPC.  You can get to it from the AWS management console.  Search for VPC.

When you get there it should look something like the picture below.  Notice down the left side of the screen are the different sections to control the various attributes of your VPC.  In the picture you can see that I have 1 active VPC and it is in Ohio.  My VPC has 4 subnets, 2 routing tables, 1 internet gateway, 1 network ACL, 3 security groups etc.

In the console when you click on “Your VPCs” you will see a screen that looks like the one below.  When you signed up, Amazon automatically created a VPC for you in the region that you selected. Which you probably didn’t realize – or at least I didn’t realize at the time.  The VPC console gives you information about your VPC including

  • CIDR IPV4 Networking information (in CIDR Blocks)
  • DHCP Options
  • Routing Table (i.e. the default routing table)
  • Network ACLs

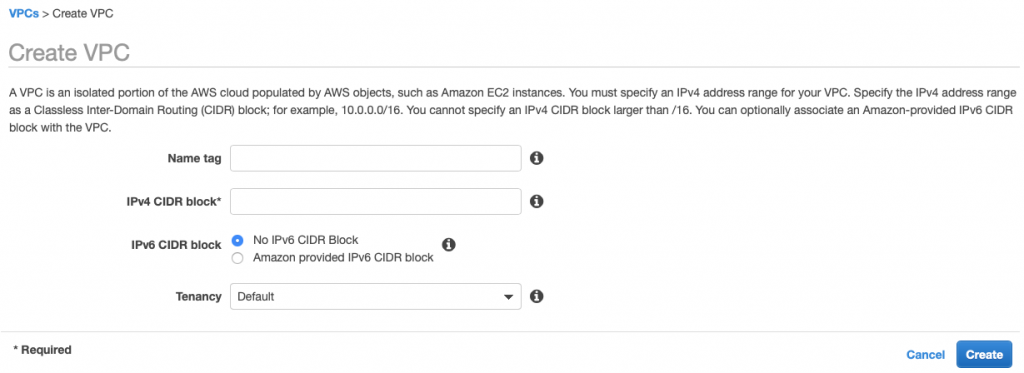
If you want to create a new VPC the only information you really need is what network do you want to use.  When the original VPC was created by Amazon, the default picks are a private network range, 172.31.0.0/16.  I know that you can also create network in the 10.0.0.0. Your network must have 16-bits of network address.

If you decide to create your own VPC you will basically only need the IPv4 CIDR (aka network) for your VPC.

Availability Zone

The AWS documentation says that  “… Availability Zones are the core of our infrastructure architecture and they form the foundation of AWS’s and customers’ reliability and operations. Availability Zones are designed for physical redundancy and provide resilience, enabling uninterrupted performance, even in the event of power outages, Internet downtime, floods, and other natural disasters.”

Each Region has several availability zone that are closely connected but isolated.  I am using the Ohio Region (aka us-east-2) which has three availability zones:

  • us-east-2a
  • us-east-2b
  • us-east-2c

There is no sub-menu for Availability Zones.  The way you control the Availability Zones is by creating subnets in the intended Availability Zone and then assigning resources to the intended subnet.  In order to control your subnets click on “Subnets”…

Subnet

… which will put you on a subnet screen that looks like this:

Notice that I have four subnets.  Three of them were created automatically for me by Amazon (the ones with the short Subnet IDs).  The “name” of the subnet is assigned by you, or in this case, were assigned by me.  When you hover over the name of the subnet it will put a little pencil icon on the name.  When you click it, you will be able to type a new name for the subnet.  The names don’t mean anything in the system.  They are for your use only when you are assigning resources etc.

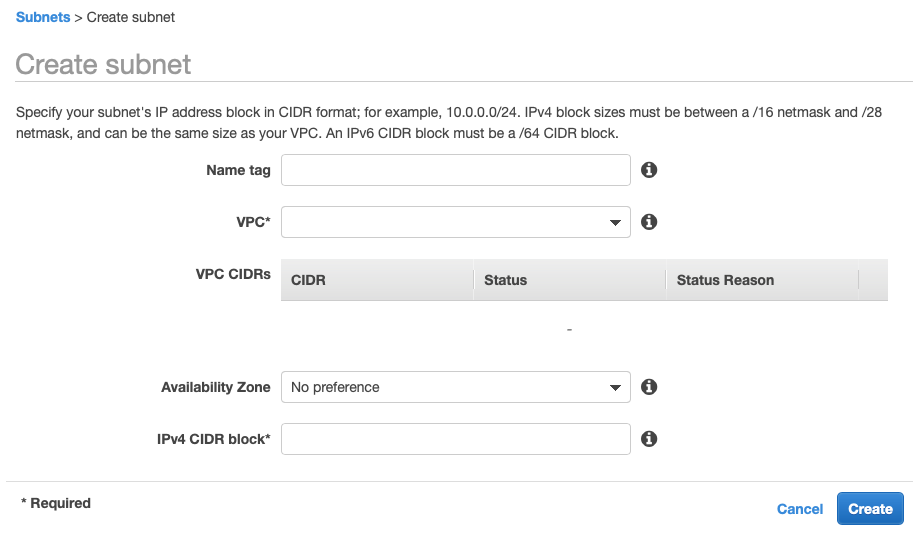
When you create a subnet you will need to specify the network CIDR range.  Notice that all of mine are 20-bit network addresses starting with 172.31.0.0 and going up from there.  To add a new subnet click on “Create Subnet” where you will brought to a screen like this.  The two really interesting things on this screen are your ability to specify the network CIDR, and the Availability Zone.  A subnet must reside completely in one Availability Zone.

Internet Gateway

You can think of the internet gateway as a device that is attached to your VPC network.  Each of the subnets are allowed to route packets to the Internet Gateway.  When you configure the routing tables for your subnets, you will specify the internet gateway as the destination for packets that you want to go out onto the network e.g. 0.0.0.0/0 (meaning any device).  In terms of configuration, there isn’t much, just tags which are used only for your searching purposes.  The last thing of note with the internet gateway is that there can be only one attached to your VPC.

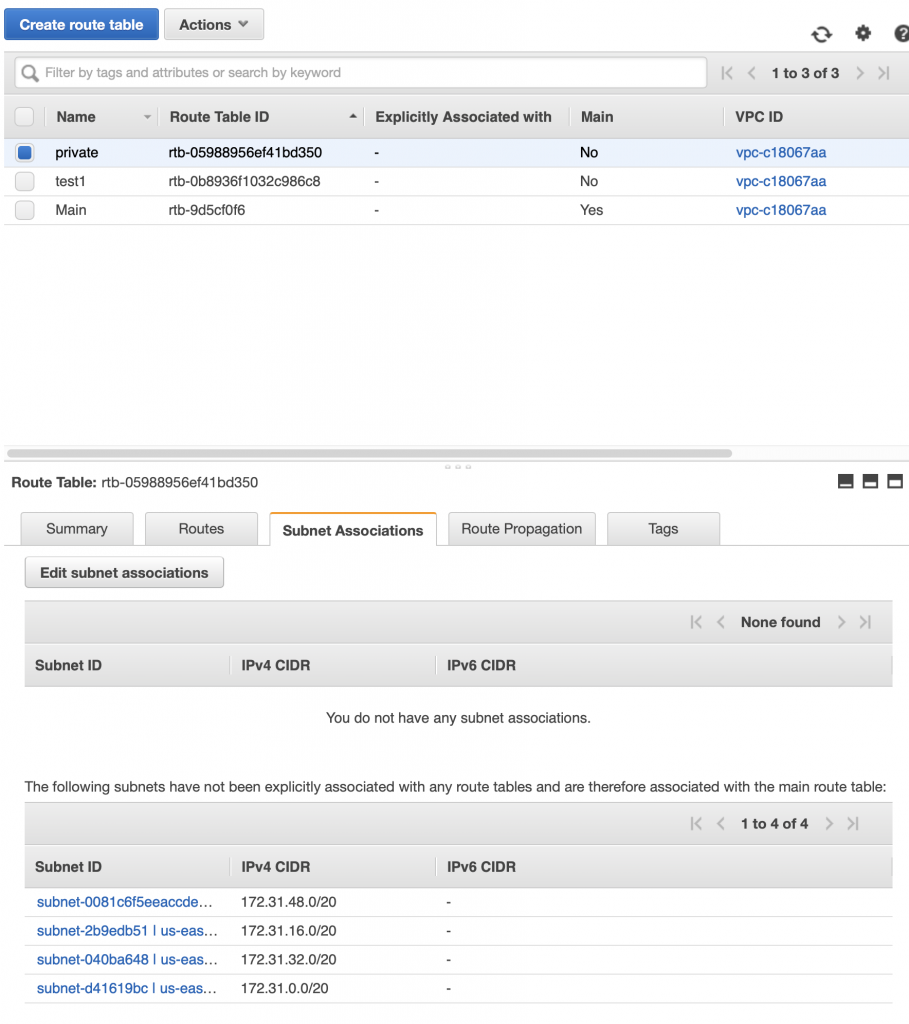
Routing Table

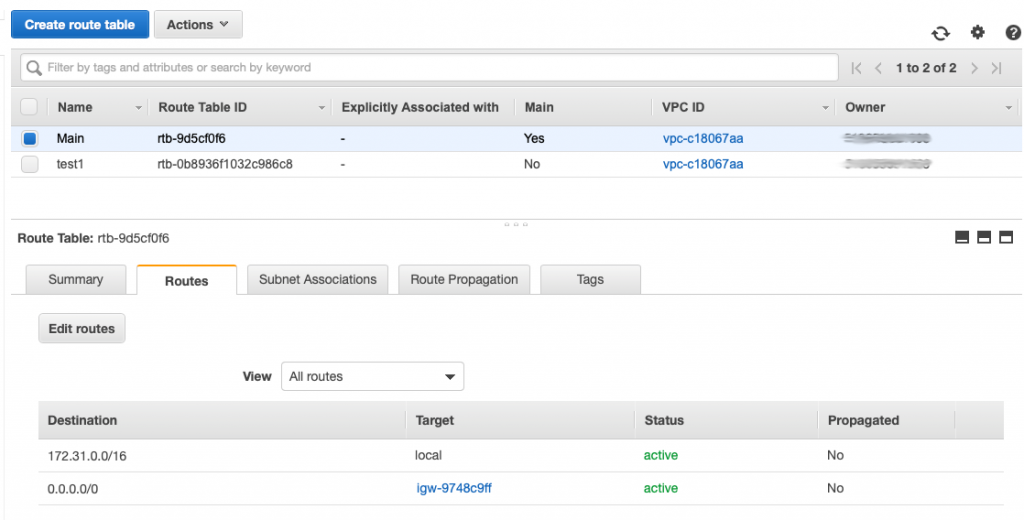
When you click on Routing Table, you will see a page like this one.  You can see in the picture that I have two routing tables.  The first one is called “Main” and is amazingly enough called the “Main” routing table, imagine that.  You can see the routes at the bottom of the picture.  The first one say that all of the 172.31.0.0/16 routes are local.  The second route says that any packets going to 0.0.0.0/0 (meaning any device on the network) should be sent to the internet gateway.

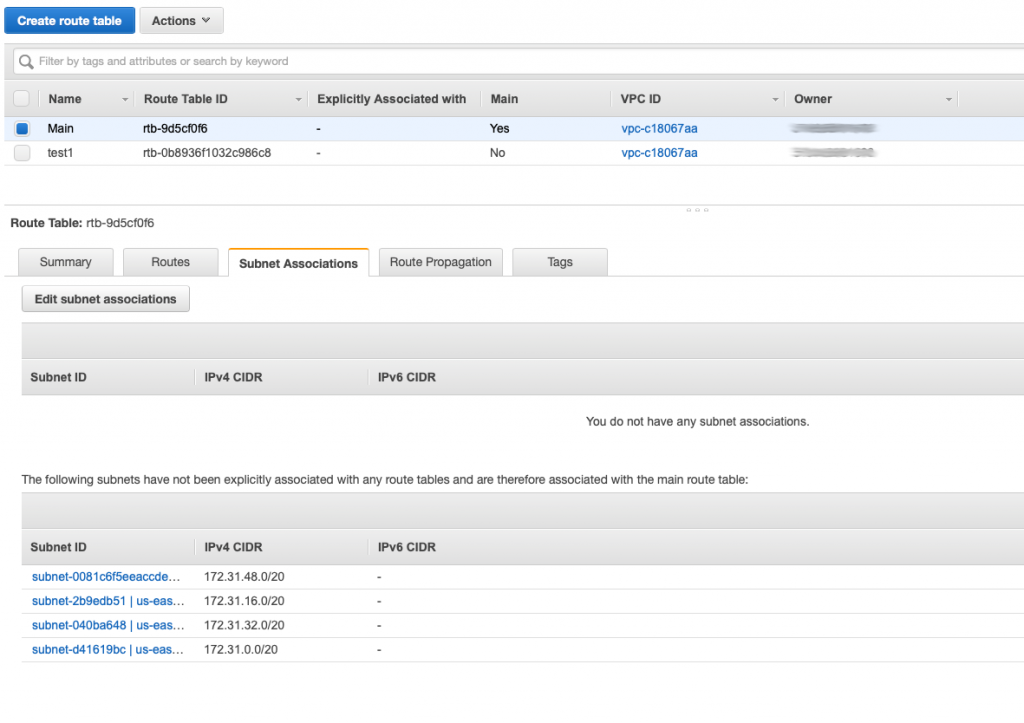
This routing table probably should have been called the default routing table as it is by default attached to all of the subnets in your network.  When you click on the “Subnet associations” you can see that it is by default attached to all of the subnets in my network.  When a subnet is not explicitly attached to a network by you then it adopts the Main routing table.

By definition any subnet that is attached to a routing table that has a route to the internet gateway is called “Public” and any subnet that doesn’t have a route to the internet is called “Private”.  Why would you want a private network?  Simple, imagine that a database server should only be accessed by servers that are in your VPC and should not be accessible by devices on the public internet.

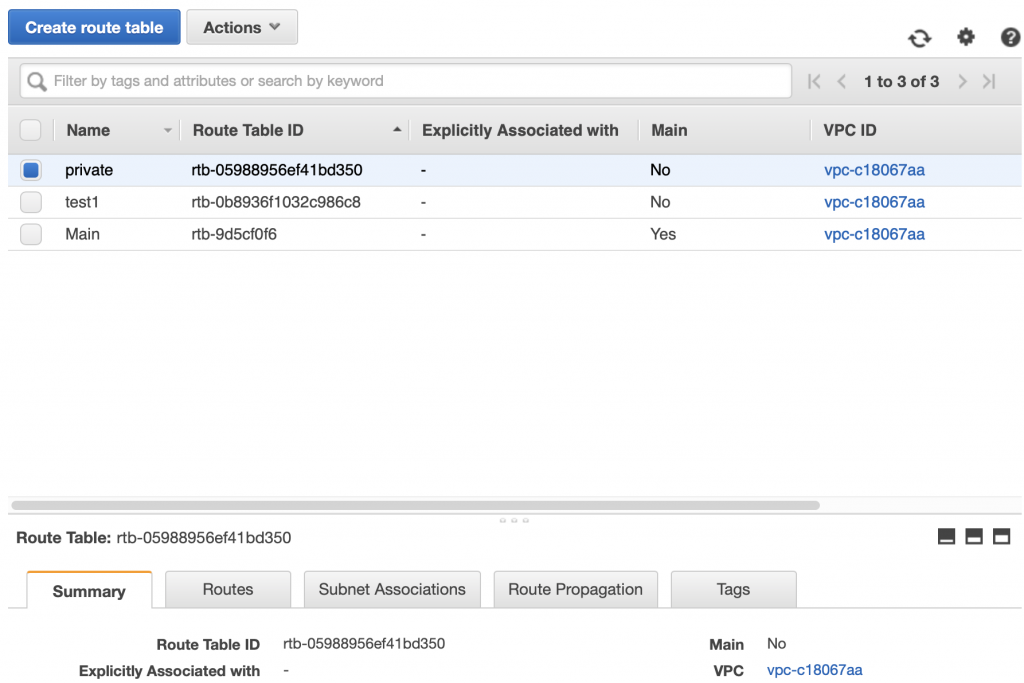
If I wanted to create a “private” routing table I would first click create and then give the new table a name.  In this case “private”

After I click “Create” I will have the net routing table.  You can see it in the picture below.

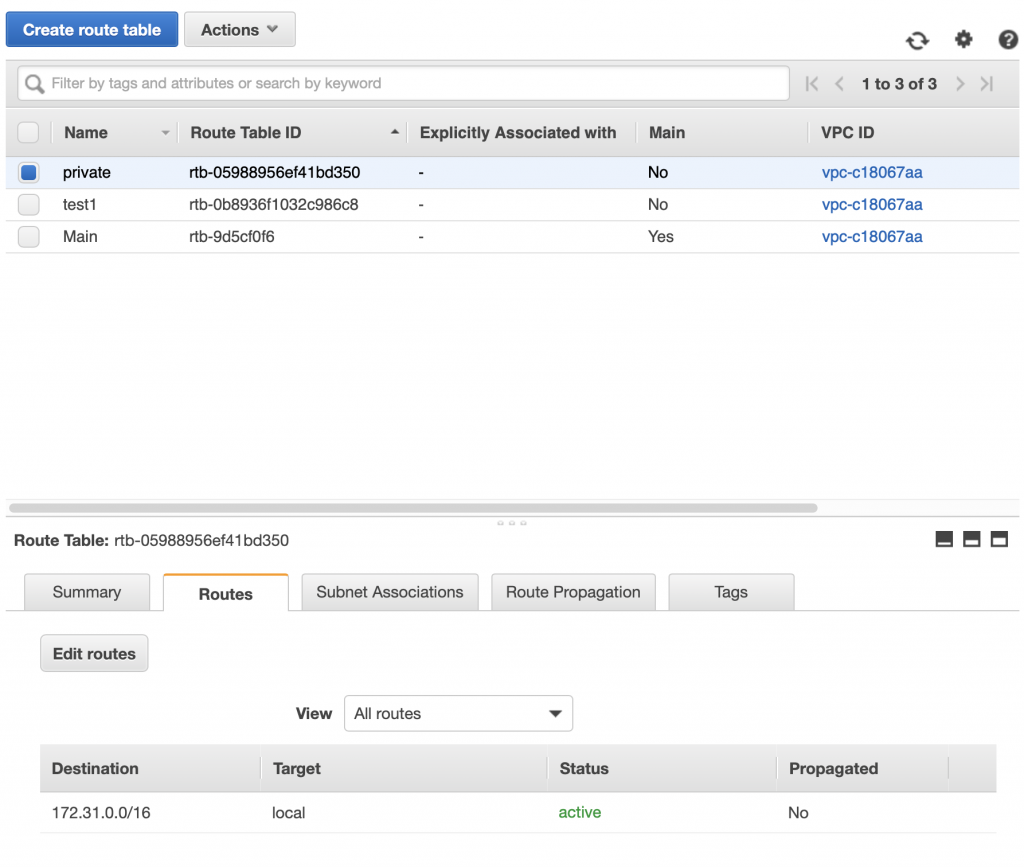
When you click on the routes, you can see that be default it creates a “local” only route.  Giving this subnet access to only the local subnets.

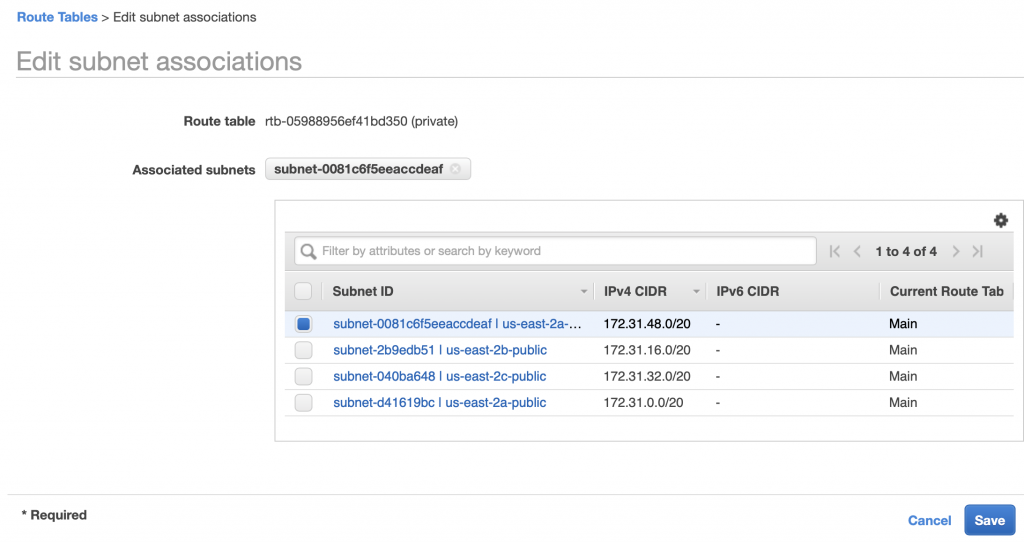
By default a subnet is not associated with any routing table.  Which means that by default it uses the “Main” routing table. If you want to associate the subnet with a specific routing table then you click on the “Subnet Associates” tab then “Edit subnet associations”


Now you can select a subnet to associate with the routing table, then “Save”

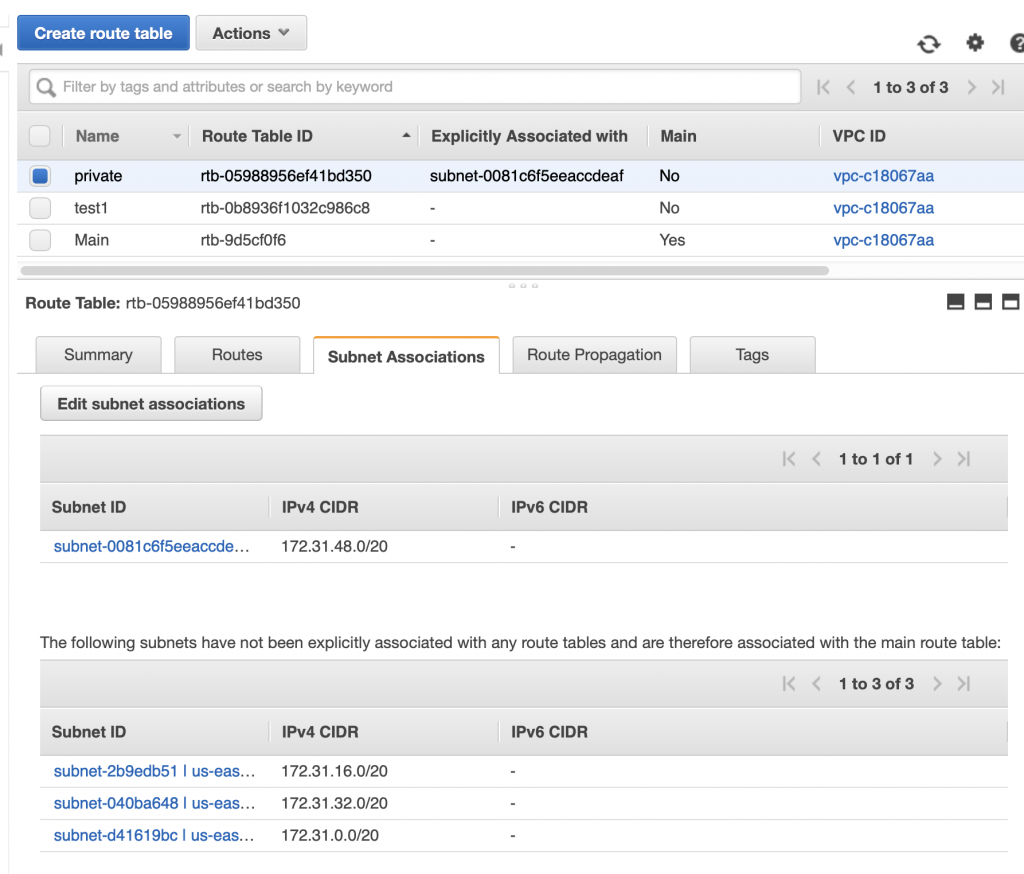
When it comes back to the main routing table page you can see that “private” is now associated with subnet “subnet-0081…”.  To bad that the interface doesn’t show the name of the subnet instead of the subnet id.

Network ACLs

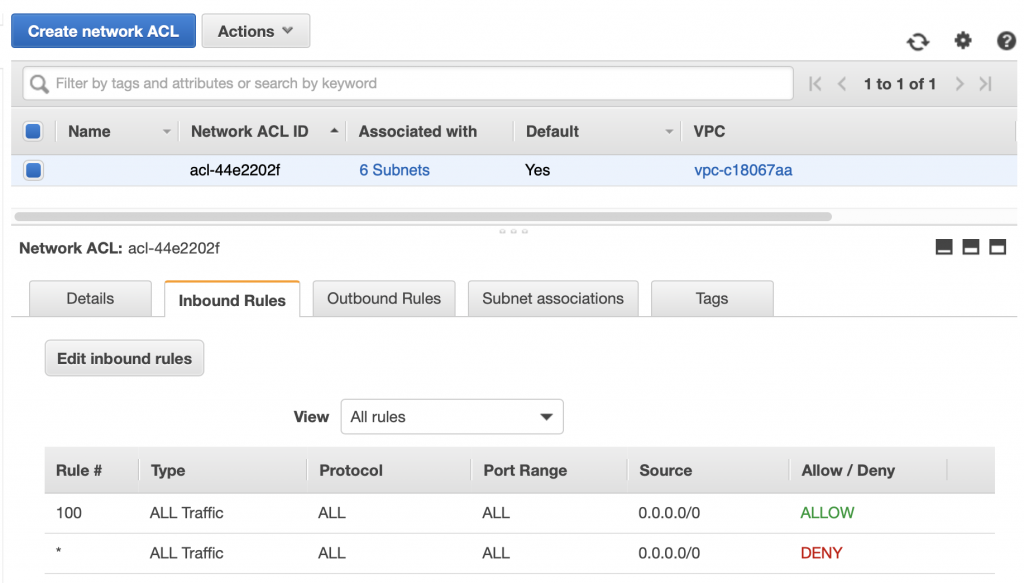
After the routing table, which limits outgoing traffic on a subnet, the next layer of security is the Network Access Control List (ACL or NACL).  The ACL is just a list of IP addresses/Port pairs that are legal (allowed) or illegal (deny).  You can think of the ACL as a firewall for the subnet.  When a packet is inbound or outbound from a subnet, the ACL rules are evaluated one by one, starting with the lowest number, and going until a rule is matched.  The final rule is a “deny” meaning, if there isn’t a match then the packet is by default a deny. Some features of the ACL include:

  • NACLs are optional
  • NACLs are applied to 0 or more subnets (you can use the same NACL for more than one subnet)
  • There is a default NACL which is by default associated with every subnet
  • You can control access with BOTH routing tables and/or NACLs and/or Security Groups
  • There are separate inbound rules and outbound rules

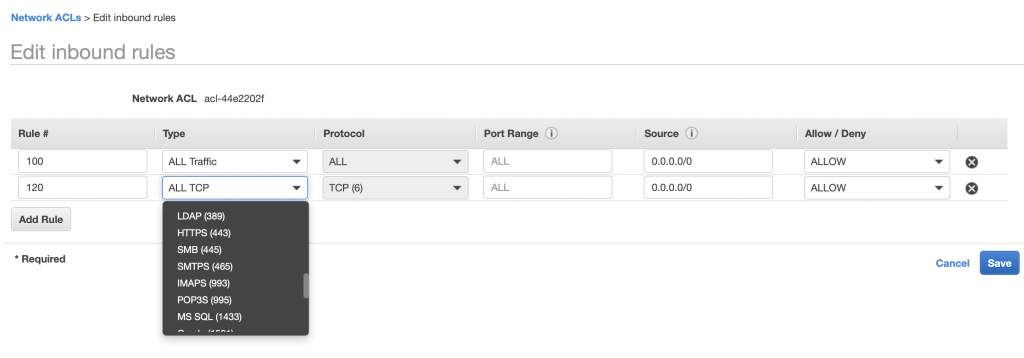
The default has ALLOW for everything on Inbound and Outbound … here is what it looks like in the control panel.

You can add/edit/change the rules by clicking on Edit Inbound Rules.

You need to specify a:

  • Rule # which much be less than 32768 and is used to specify the execution order (lowest–>highest)
  • The Rule #s should increase and you leave gaps so you can come back and add more
  • The Type – there is a big list of Types (which will automatically fill out the port) or you can completely specify it
  • The Source address

It is tempting to make these rules very promiscuous.  Don’t do it.  You should make them as constrained as possible.

Security Group

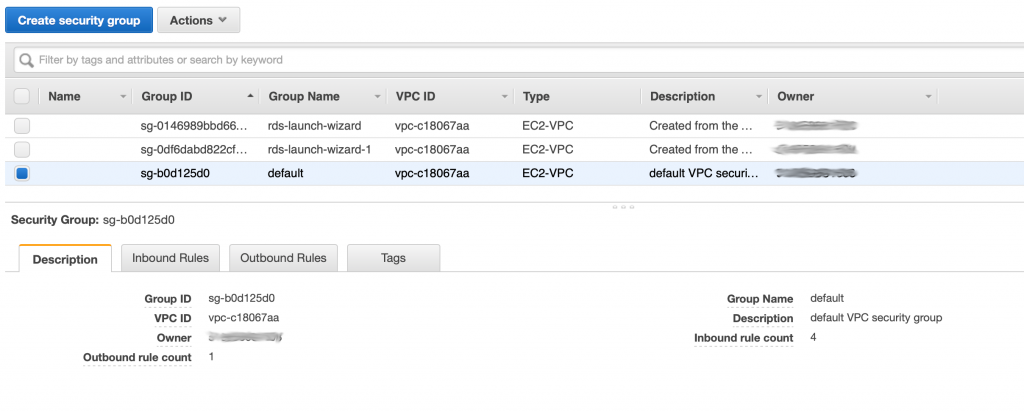
The last level of security in the AWS VPC architecture is the Security Group.  A security group is an instance level firewall.  Meaning you can write inbound and outbound port level rules that apply to a SPECIFIC server instance in your system.  A security group can be applied to more than one server, meaning it can be generic to a function.  For example you might make a security group for MySQL servers that restricts all incoming connections to port 3306.  Every server instance in your VPC belongs to a security group by default when you create it.

The security groups has a a console in the VPC console.  In the picture below you can see that I have three security groups.  The interesting thing is that the first two security groups were created automatically by the Relational Database Server system when I made two MySQL databases.

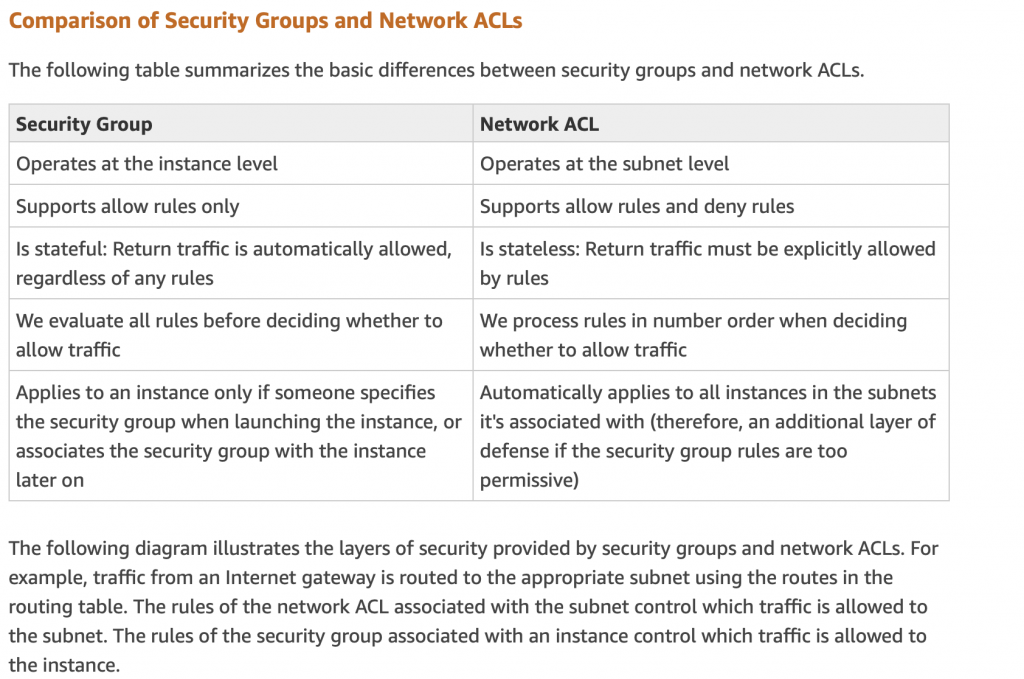
When I looked at all of this originally I wondered what is the difference between Security Group and NACL.  Amazon answers this question nicely in their documentation:

Subnet Group

A subnet group is just a list of subnets from one up to the total list of subnets in your VPC.   The subnet group is NOT listed as an attribute of the VPC on the console.  However, it is used by the the Relational Database Server (RDS) setup screens.  When you create a new RDS MySQL database it will ask you which subnet group to assign the server to.  RDS will then pick one of the subnets and attach your server.  You need to think about the subnet groups in advance or you will end up with an RDS instance on the wrong subnet.

There is a default subnet group which has all of the subnets in your VPC at the time of creation.  It does NOT add subnets to your “default” subnet group when you add new subnets.

To edit the Subnet Groups you need to go to the Amazon RDS dashboard.  Then you click “Subnet groups”.  You can see in the picture below that I currently have 2 subnet groups.

On the subnet group screen you can edit or create subnet groups.

On the Edit screen you can Add or Remove subnets (or potentially filter the list to regions)

A Stern Warning

Although it seems like a terrible idea to put a section called “A Stern Warning” at the very end of a discussion, I did this because without understanding everything else the warning doesn’t make sense.

It is almost impossible to move servers between subnets once they are created.  That means YOU HAD BETTER PLAN YOUR SUBNETS BEFORE YOU CREATE SERVERS or you will find yourself roasting in HELL. 

I got lulled into a sense of security because Amazon did such a good job setting things up by default.  But, when I decided to have Public/Private subnets I already had servers turned on in subnets.  This made getting everything unwound a real pain in the ass.  On the internet there is quite a bit of conversation about how to move RDS MySQL servers and EC2 instances.  All of the options suck so it is better to design it right from the outset.  Imagine that.

Documentation and References

The Creek 2.0: Read Sensor Data Send to AWS IoT via MQTT

Summary

In this article I will show you how to use Python to read from the I2C bus and then send the data to the AWS IoT Cloud via MQTT.  This will include the steps to install the two required libraries.  I will follow these steps:

  • Install the SMBUS Python Library
  • Create pyGetData.py to test the I2C
  • Install the AWS IoT Python Library
  • Create  pyGetData.py to send data to AWS IoT
  • Add the pyGetData.py to runI2C (which is run every 2 minutes)
  • Verify that everything is functioning

Install the SMBUS Python Library & Test

In order to have a Python program talk to the Raspberry Pi I2C you need to have the “python3-smbus” library installed.  To do this run “sudo apt-get install python3-smbus”

pi@iotexpertpi:~ $ sudo apt-get install python3-smbus
Reading package lists... Done
Building dependency tree       
Reading state information... Done
The following NEW packages will be installed:
  python3-smbus
0 upgraded, 1 newly installed, 0 to remove and 426 not upgraded.
Need to get 0 B/9,508 B of archives.
After this operation, 58.4 kB of additional disk space will be used.
Selecting previously unselected package python3-smbus.
(Reading database ... 136023 files and directories currently installed.)
Preparing to unpack .../python3-smbus_3.1.1+svn-2_armhf.deb ...
Unpacking python3-smbus (3.1.1+svn-2) ...
Setting up python3-smbus (3.1.1+svn-2) ...
pi@iotexpertpi:~ $ 

I like to make sure that everything is working with the I2C bus.  There is a program called “i2cdetect” which can probe all of the I2C addresses on the bus.  It was already installed on my Raspberry Pi, but you can install it with “sudo apt-get install i2c-tools”.  There are two I2C busses in the system and the PSoC 4 is attached to bus “1”.  When I run “i2cdetect -y 1” I can see that address ox08 ACKs.

pi@iotexpertpi:~/pyGetData $ i2cdetect -y 1
     0  1  2  3  4  5  6  7  8  9  a  b  c  d  e  f
00:          -- -- -- -- -- 08 -- -- -- -- -- -- -- 
10: -- -- -- -- -- -- -- -- -- -- -- -- -- -- -- -- 
20: -- -- -- -- -- -- -- -- -- -- -- -- -- -- -- -- 
30: -- -- -- -- -- -- -- -- -- -- -- -- -- -- -- -- 
40: -- -- -- -- -- -- -- -- -- -- -- -- -- -- -- -- 
50: -- -- -- -- -- -- -- -- -- -- -- -- -- -- -- -- 
60: -- -- -- -- -- -- -- -- -- -- -- -- -- -- -- -- 
70: -- -- -- -- -- -- -- --                         
pi@iotexpertpi:~/pyGetData $ 

You might recall from an earlier article that I setup the register map of the PSoC4 as follows:

typedef  struct DataPacket {
    uint16 pressureCounts;
    int16 centiTemp; // temp in degree C / 100
    float depth;
    float temperature;
} __attribute__((packed)) DataPacket;

If I use the i2ctools to read some data from the PSoC4 like this:

pi@iotexpertpi:~/pyGetData $ i2cget -y 1 8 0 w
0x0196
pi@iotexpertpi:~/pyGetData $

I get 0x196 which is 406 in decimal.  In my ADC I have it setup as 12-bits into 0-2.048v which means that it is 0.5mv per count in other words the ADC is reading .204v which is about .204V/51.1 ohm = 4mA also knowns as 0 PSI.  OK that makes sense.

Now I create a program called testI2C.py.

import smbus

######################################################
#Read the data from the PSoC 4
######################################################
bus = smbus.SMBus(1)
address = 0x08

# The data structure in the PSOC 4 is:
# uint16_t pressureCount ; the adc-counts being read on the pressure sensor
# int16_t centiTemp ; the temperaure in 10ths of a degree C
# float depth ; four bytes float representing the depth in Feet
# float temperature ; four byte float representing the temperature in degrees C

numBytesInStruct = 12
block = bus.read_i2c_block_data(address, 0, numBytesInStruct)
print(block)

What I will do next is run the program to see what data it gets back from the Raspberry Pi.  Then I will use the i2ctools to get the same data and compare to make sure that things are working.

pi@iotexpertpi:~/pyGetData $ python3 testI2C.py 
[150, 1, 236, 14, 0, 0, 0, 0, 204, 204, 24, 66]
pi@iotexpertpi:~/pyGetData $ i2cget -y 1 8 0 w
0x0196
pi@iotexpertpi:~/pyGetData $ 

Hang on 150,1 isn’t 0x0196.  Well yes it is because the data is in decimal and is little endian.  When you switch it to hex and display it the same way you get 0x0196 same answer.  Good.

The next problem is that a list of bytes isn’t really that useful and you need to convert it to an array of bytes using the function “bytearray”.  A bytearray also isn’t that helpful, but, Python has a library called “struct” which can convert arrays of bytes into their equivalent values.  Think converting a packed  C-struct of bytes into the different fields.  You have to describe the struct using this ridiculous text format.

The first part of the code is as before.  The only really new things are:

  • On line 20 I convert and array of bytes into a bytearray
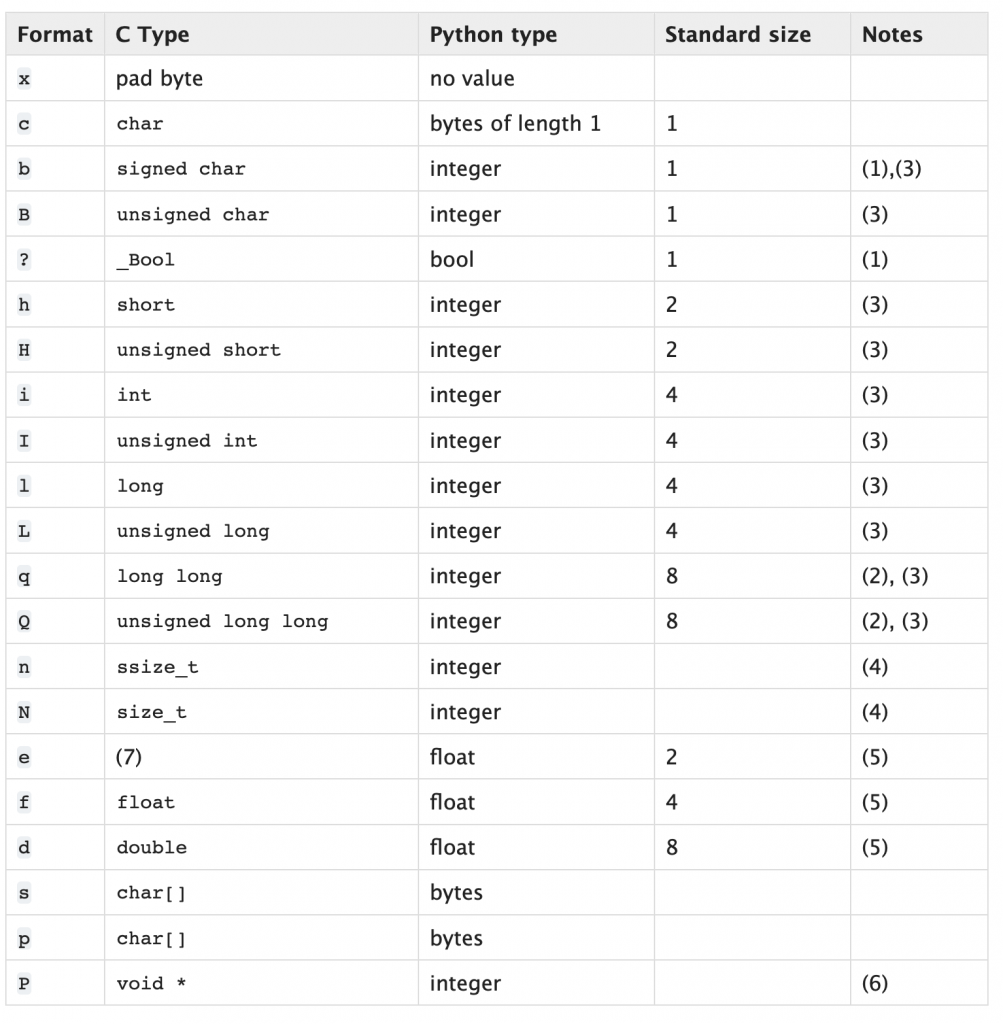
  • On line 26 I unpack the byte array using the format string.  You can see in the table above “h” is a signed 16-bit int.  “H” is a unsigned 16-bit int. “f” is a four byte float.

The unpack method turns the bytes into a tuple.  Here is the whole code.

import struct
import smbus

######################################################
#Read the data from the PSoC 4
######################################################
bus = smbus.SMBus(1)
address = 0x08

# The data structure in the PSOC 4 is:
# uint16_t pressureCount ; the adc-counts being read on the pressure sensor
# int16_t centiTemp ; the temperaure in 10ths of a degree C
# float depth ; four bytes float representing the depth in Feet
# float temperature ; four byte float representing the temperature in degrees C

numBytesInStruct = 12
block = bus.read_i2c_block_data(address, 0, numBytesInStruct)
print(block)
# convert list of bytes returned from sensor into array of bytes
mybytes = bytearray(block)
# convert the byte array into
# H=Unsigned 16-bit int
# h=Signed 16-bit int
# f=Float 
# this function will return a tuple with pressureCount,centiTemp,depth,temperature
vals = struct.unpack_from('Hhff',mybytes,0)
# prints the tuple
print(vals)

When I run the program I get the raw data.  Then the unpacked data.  Notice the 406 which is the same value from the ADC as earlier.

pi@iotexpertpi:~/pyGetData $ python3 testI2C.py
[150, 1, 76, 14, 0, 0, 0, 0, 214, 71, 18, 66]
(406, 3660, 0.0, 36.570152282714844)
pi@iotexpertpi:~/pyGetData $ 

Install the AWS IoT Python Library

Now I want to send the data to AWS IoT using MQTT.  All the time I have been using Python I have been questioning my sanity as Python is an ugly ugly language.  However, one beautiful thing about Python is the huge library of code to do interesting things.  Amazon is no exception, they have built a Python library based on the Eclipse Paho library.  You can read about the library in the documentation.

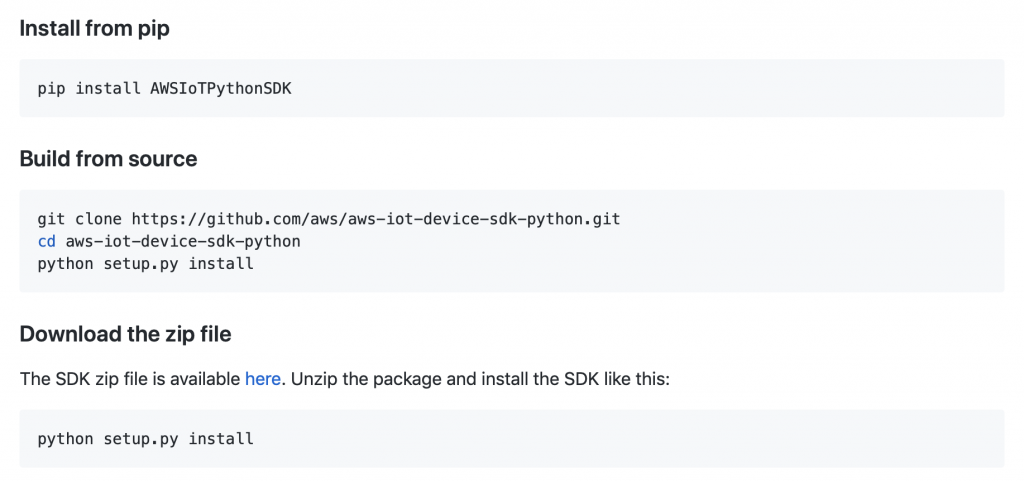
To get this going I install using “sudo pip3…”

pi@iotexpertpi:~ $ sudo pip3 install AWSIoTPythonSDK
Downloading/unpacking AWSIoTPythonSDK
  Downloading AWSIoTPythonSDK-1.4.7.tar.gz (79kB): 79kB downloaded
  Running setup.py (path:/tmp/pip-build-ajpr2imp/AWSIoTPythonSDK/setup.py) egg_info for package AWSIoTPythonSDK
    
Installing collected packages: AWSIoTPythonSDK
  Running setup.py install for AWSIoTPythonSDK
    
Successfully installed AWSIoTPythonSDK
Cleaning up...
pi@iotexpertpi:~ $ 

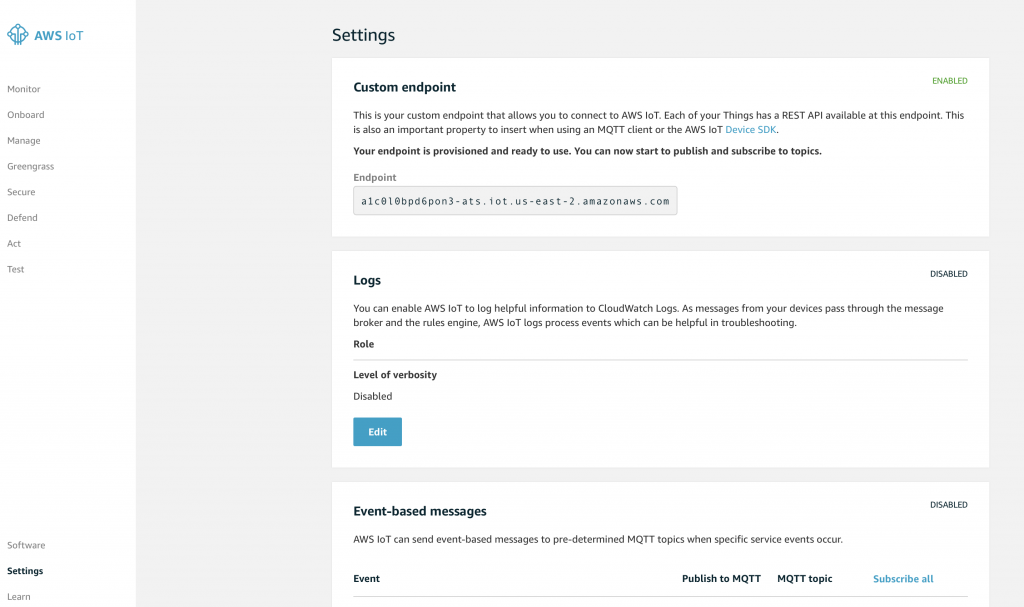
To use the library to connect to AWS you need to know your “endpoint”.  The endpoint is just the DNS name of the virtual server that Amazon setup for you.  This can be found on the AWS IoT management console.  You should click on the “Settings” on the left.  Then you will see the name at the top of the screen in the “Custom endpoint”

The next thing that you need is

  • Your Thing Certificate (I hope you downloaded them when you had the chance)
  • Your Thing Private Key
  • The Amazon Root CA which you can get on this page You should choose “Amazon Root CA 1”

The program is really simple.  On lines 7-13 I just setup variables with all of the configuration information.  Then I create a JSON message by concatenating all of the stuff together that I read from the PSoC 4.  Lines 18-20 setup an MQTT endpoint with your credentials.  Line 22 opens the MQTT connection.  And finally line 21 Publishes the message.

from AWSIoTPythonSDK.MQTTLib import AWSIoTMQTTClient

######################################################
# Send Data to AWS
######################################################

host = "a1c0l0bpd6pon3-ats.iot.us-east-2.amazonaws.com"
rootCAPath = "../aws-keys/AmazonRootCA1.pem"
certificatePath = "../aws-keys/a083ad1cff-certificate.pem.crt"
privateKeyPath = "../aws-keys/a083ad1cff-private.pem.key"
port = 8883
clientId = "applecreek"
topic = "$aws/things/Test1/shadow/update"

# Shadow JSON Message formware
messageJson = '{"state":{"reported":{"temperature":' + str(vals[3]) +',"depth": ' + str(vals[2]) + ',"thing":"applecreek"}}}'

myAWSIoTMQTTClient = AWSIoTMQTTClient(clientId)
myAWSIoTMQTTClient.configureEndpoint(host, port)
myAWSIoTMQTTClient.configureCredentials(rootCAPath, privateKeyPath, certificatePath)

myAWSIoTMQTTClient.connect()
myAWSIoTMQTTClient.publish(topic, messageJson, 1)

Now that I have the Python program, I want to plumb it into the rest of my stuff.  On my RPI I run “crontab -l” to figure out what my collect data program is.  That turns out to be “runI2C” which appears to run every two minutes.

0,2,4,6,8,10,12,14,16,18,20,22,24,26,28,30,32,34,36,38,40,42,44,46,48,50,52,54,56,58 * * * * /home/pi/getCreek/runi2c

I edit the runI2C shell script and add on my python program.

#!/bin/sh
cd ~pi/getCreek
sudo java -cp build/jar/getCreek.jar:classes:./lib/* CreekServer GetData
cd ~pi/pyGetData
python3 pyGetData.py

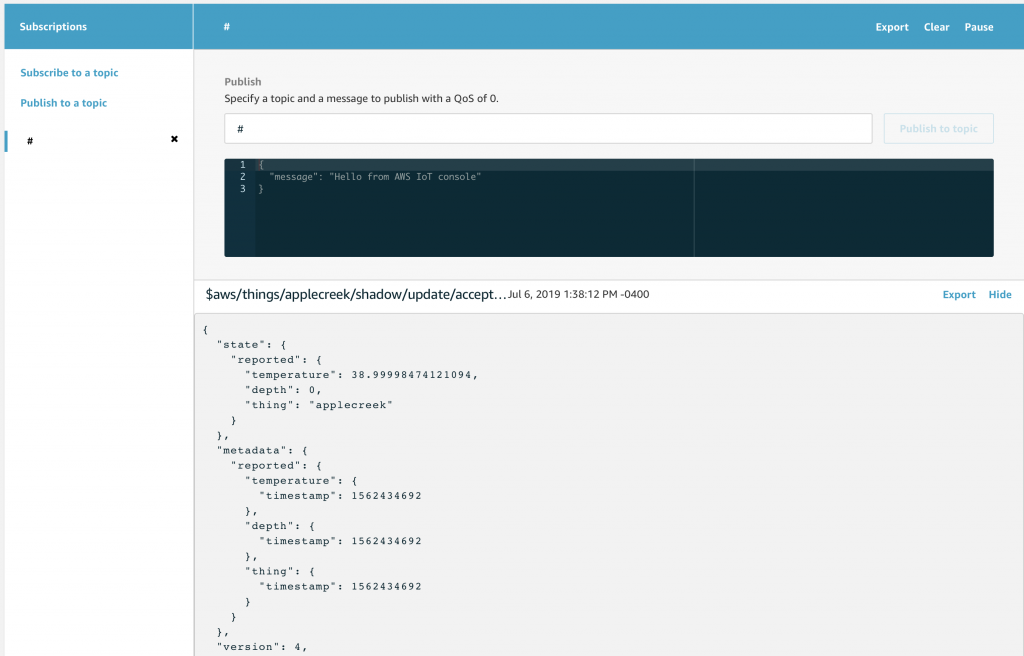
Finally we are ready for the moment of truth.  Log into the console and start the test client.  Subscribe to “#” and after a bit of time I see that my publish happened and it was accepted into the Device Shadow of my Thing.

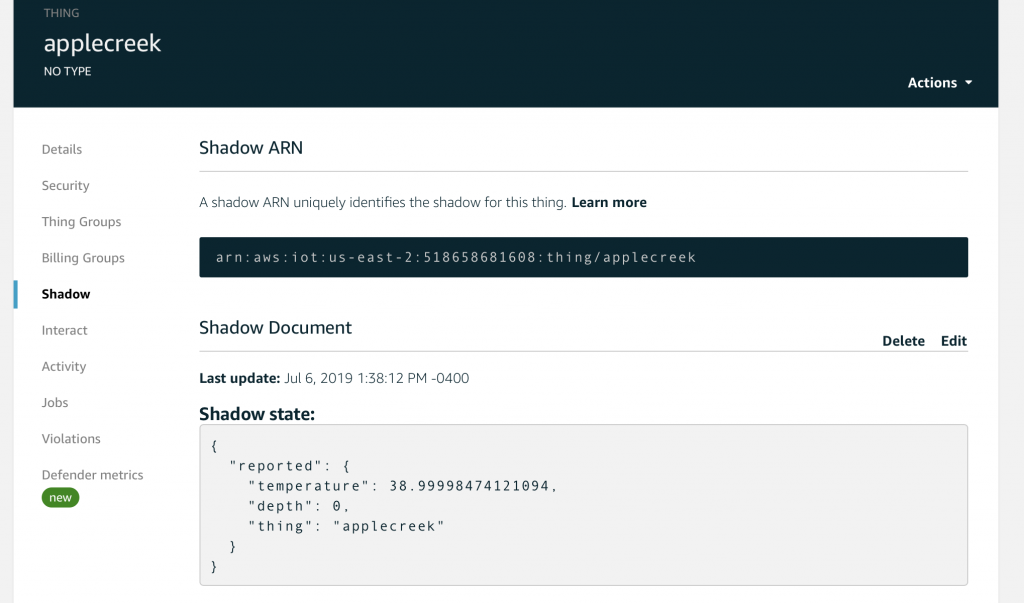
Here is the device shadow

Here is the whole program

import struct
import sys
import smbus
from AWSIoTPythonSDK.MQTTLib import AWSIoTMQTTClient

######################################################
#Read the data from the PSoC 4
######################################################
bus = smbus.SMBus(1)
address = 0x08

# The data structure in the PSOC 4 is:
# uint16_t pressureCount ; the adc-counts being read on the pressure sensor
# int16_t centiTemp ; the temperaure in 10ths of a degree C
# float depth ; four bytes float representing the depth in Feet
# float temperature ; four byte float representing the temperature in degrees C

numBytesInStruct = 12
block = bus.read_i2c_block_data(address, 0, numBytesInStruct)

# convert list of bytes returned from sensor into array of bytes
mybytes = bytearray(block)
# convert the byte array into
# H=Unsigned 16-bit int
# h=Signed 16-bit int
# f=Float 
# this function will return a tuple with pressureCount,centiTemp,depth,temperature
vals = struct.unpack_from('Hhff',mybytes,0)
# prints the tuple
print(vals)

######################################################
# Send Data to AWS
######################################################

host = "a1c0l0bpd6pon3-ats.iot.us-east-2.amazonaws.com"
rootCAPath = "../aws-keys/AmazonRootCA1.pem"
certificatePath = "../aws-keys/a083ad1cff-certificate.pem.crt"
privateKeyPath = "../aws-keys/a083ad1cff-private.pem.key"
port = 8883
clientId = "applecreek"
topic = "$aws/things/applecreek/shadow/update"

# Shadow JSON Message formware
messageJson = '{"state":{"reported":{"temperature":' + str(vals[3]) +',"depth": ' + str(vals[2]) + ',"thing":"applecreek"}}}'

myAWSIoTMQTTClient = AWSIoTMQTTClient(clientId)
myAWSIoTMQTTClient.configureEndpoint(host, port)
myAWSIoTMQTTClient.configureCredentials(rootCAPath, privateKeyPath, certificatePath)

myAWSIoTMQTTClient.connect()
myAWSIoTMQTTClient.publish(topic, messageJson, 1)


The Creek 2.0: AWS IoT MQTT Message Broker

Summary

In this article I will explain the fundamentals of the Amazon Web Service IoT Device Cloud.  I will show you how to:

  • Create a “Thing” in the AWS IoT Core
  • Create and attach secret keys in the form of a X.509 Certificate
  • Create and attach an access Policy to the Certificate
  • Publish and Subscribe use a Message Queuing Telemetry Transport (MQTT) Message Broker (that Amazon creates for you)
  • Use MQTT to update the cached “state” of your device, also called the Device Shadow

There are 5 fundamental concepts that you need in order to understand the AWS IoT system, specifically, Thing, Certificate, Policy, MQTT and Device Shadow.

A Thing is Amazon’s word for some device out in the world that attaches to the AWS IoT cloud.  In my case, Thing means the Elkhorn Creek in Georgetown, Kentucky.  But, it could be a garage door, dishwasher or whatever other ridiculous thing you want to connect to the internet.  The AWS IoT Cloud allows you to create a Thing, setup and manage security, receive data from it, send data to it, and keep track of its state.  In my case the state is the water level of the Creek and the temperature in my barn.

A Certificate is an X.509 document that has a signed public key of the Thing.  When you use the Amazon IoT Console to create a Thing,  you can also create a Certificate for the Thing, the private key that goes with the public key in the Certificate, as well as a copy of the public key that is embedded in the Certificate.  In order to create a TLS connection to AWS IoT you will need to use the Certificate as Amazon AWS does “double sided” TLS connections.  In other words you must verify Amazon and Amazon must verify you.  You will also need your private key in order to decrypt data that Amazon sends to you encrypted with your public key.  Amazon uses the Certificate to uniquely identify a specific Thing.

A Policy is a JSON document that is attached to a Certificate that specifies what “IoT Actions” your Thing is allowed to take and to which resources that it is allowed to take the action upon.  Actions include Connect, Subscribe, Publish etc.  All resources in the world of Amazon have an ARN (Amazon Resource Name), so in the Policy you specify what actions can happen to what ARNs.

MQTT stands for Message Queuing Telemetry Transport and is an IoT protocol for a Thing to Publish messages to a Message Broker Topic.  A Message Broker is TCP/IP server that is running in the AWS IoT Cloud that Amazon creates for you and automatically turns on.  A Topic is just a name which you create that serves as a way to identify message channels.  In addition to Publishing messages to a Topic, a client can also Subscribe to a Topic.  In other words a Thing can Publish to any topic and any Thing can Subscribe to any Topic.  This you can create a many too many relationship for Publishing/Subscribing to message.  There are some topics which have special meaning in the world of AWS IoT and are used for updating and monitoring Thing state stored which is stored in the Device Shadow.

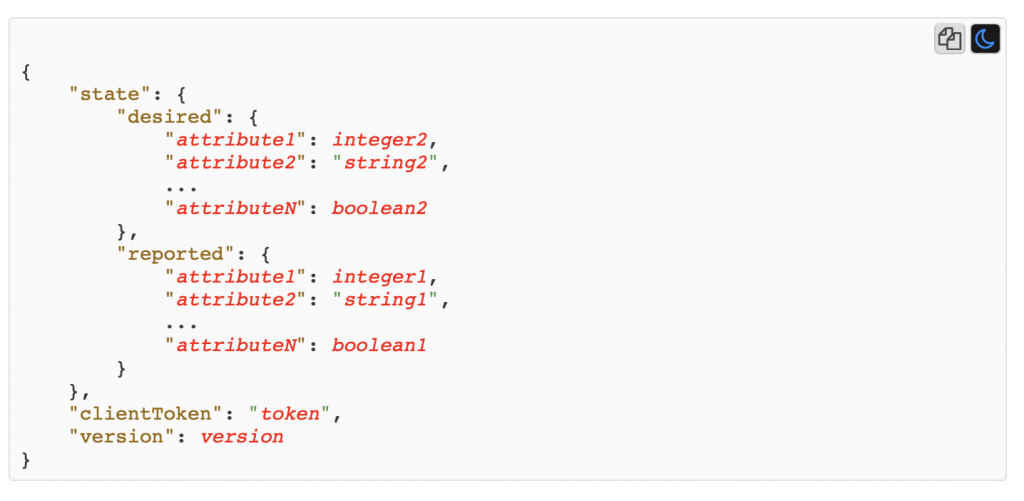
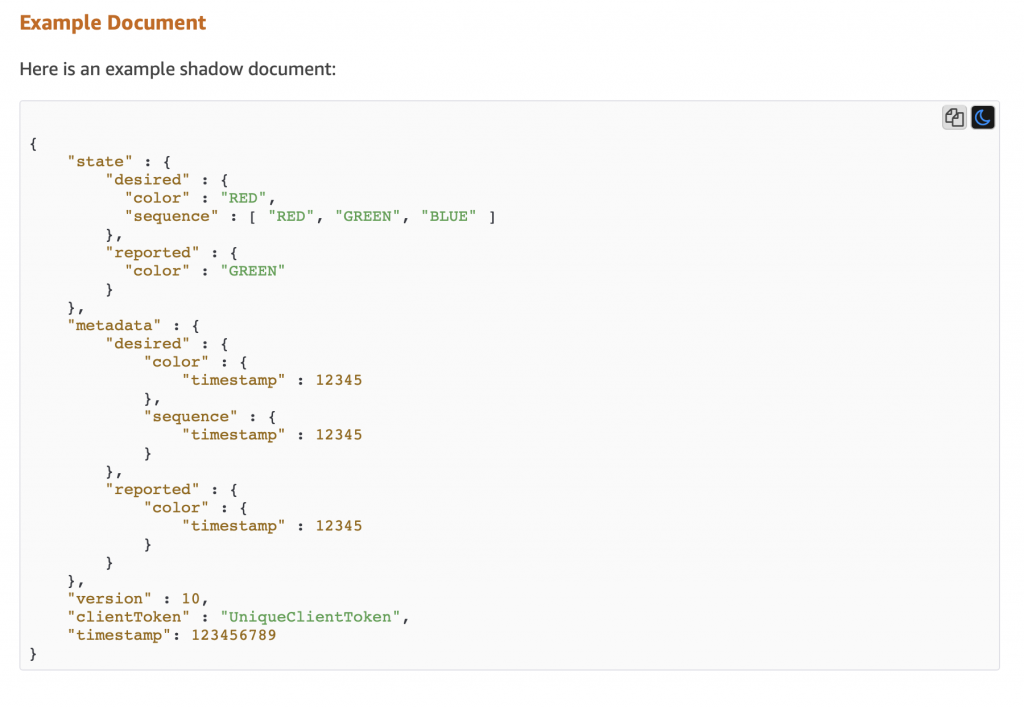
A Device Shadow is just a JSON document that is cached in the AWS IoT Cloud and is used to represent the Desired and Reported state of a Thing.  This allows other devices in the AWS IoT Cloud to communicate with a Thing even if it is not currently connected.  The JSON Device Shadow is just a JSON key value map which is defined by YOUR application.  Amazon doesn’t care what keys or values you use.  In my case the keys are “temperature” and “depth”.  When my Thing finds new values for the state of those two variables it will send updates to the Device Shadow via MQTT.

Amazon has pretty good documentation of how all of this fits together here.  One thing to note is that Amazon changes the screens on this system all of the damn time.  In my experience the changes are not major, but my screen shots may or may not reflect the current state of AWS.  Actually, there will almost certainly be some differences, but I can’t help that.  Please email bezos@amazon.com if don’t like it.

Here are the steps I will follow in this Article to show you this whole thing:

  • Create an AWS IoT Account
  • AWS IoT Core Console Tour
  • Create a Thing & Certificate
  • Create a Policy and Attach it to the Certificate
  • Explain MQTT & Show the Test Client
  • Explain the Device Shadow
  • Update the Shadow Using the Test Client

Create an AWS IoT Account

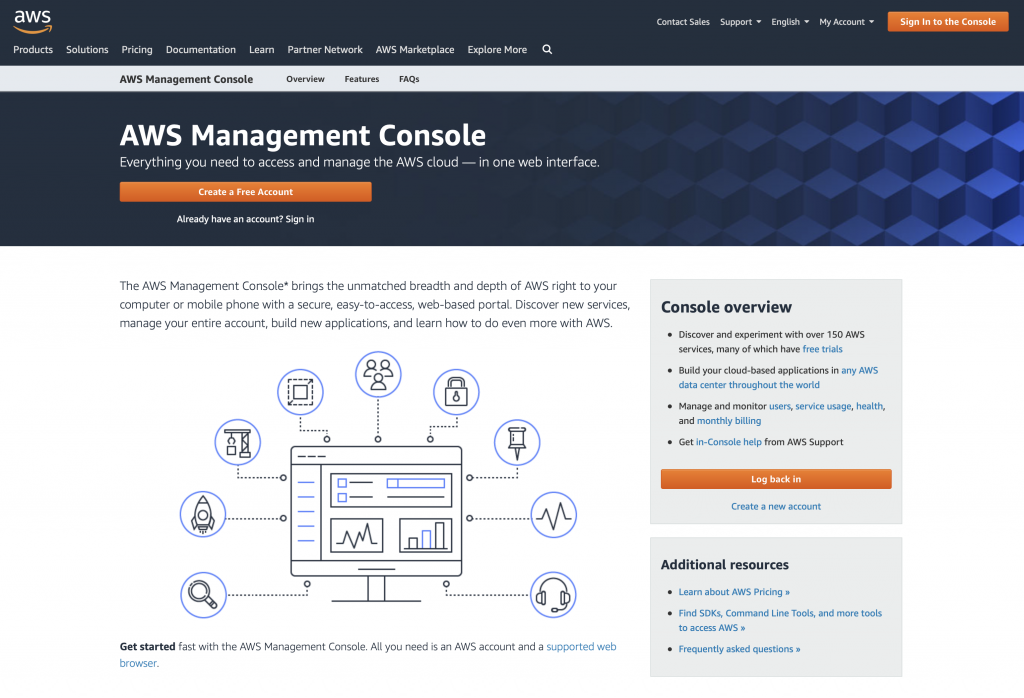
In order to use all of this, you will need to create an AWS IoT Account.  You can do that at https://console.aws.amazon.com.  Obviously Amazon makes all of their profit from AWS, however, for small amounts of usage, it is essentially free to use.  You will need to provide a credit card when you set this up, but for every thing that I have done, I have used <$10.  So no big deal.

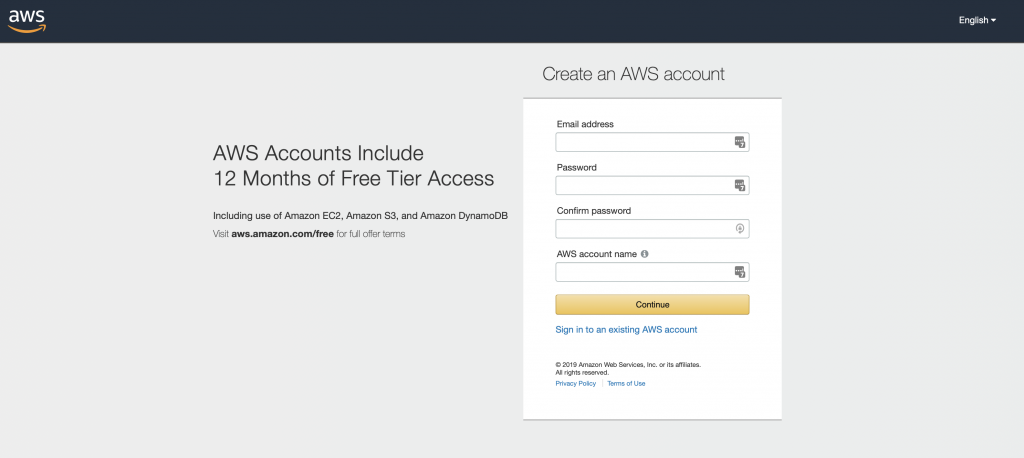
When you click on Create a new account it will bring you to this screen.  This will be a different account (even if it has the same password as your Amazon commercial account).

Once you have an account you will end up on a Screen that looks like this.  You can see that I have recently been using all of the services that I am talking about.  Imagine that.  For this lesson we will focus on IoT Core, but in the future lessons Ill talk about other services.  You can get to IoT Core by typing IoT Core into the search box and the clicking it.

There is actually a bunch of good documentation (which you can see near the bottom of the screen) including tutorials (obviously none of them are as good as this one)

AWS IoT Core Console Tour

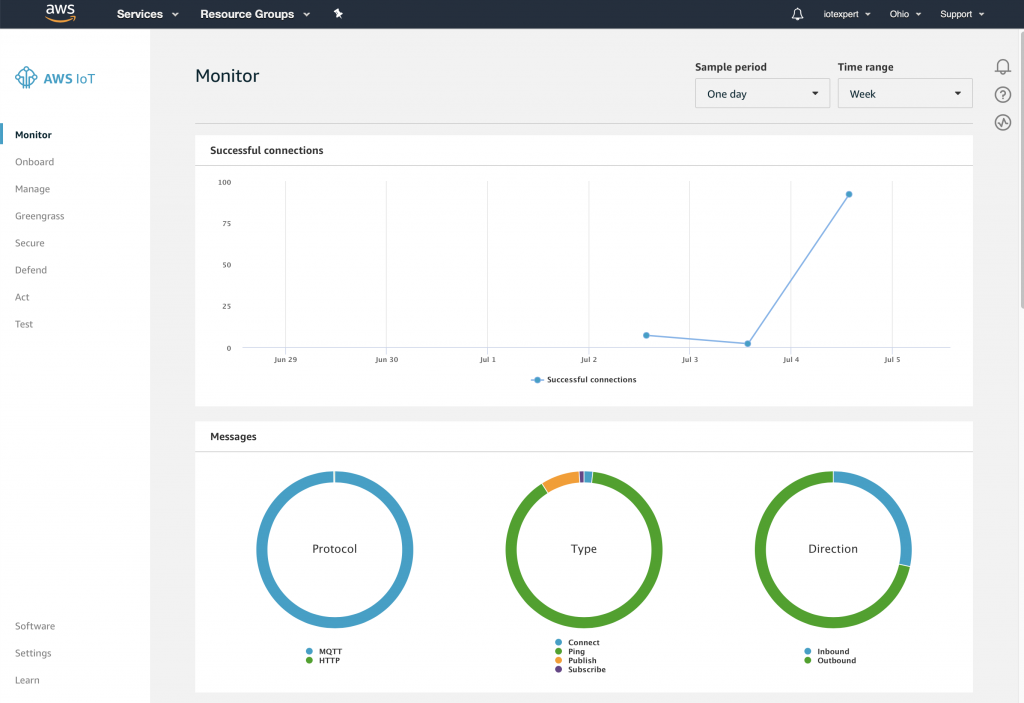
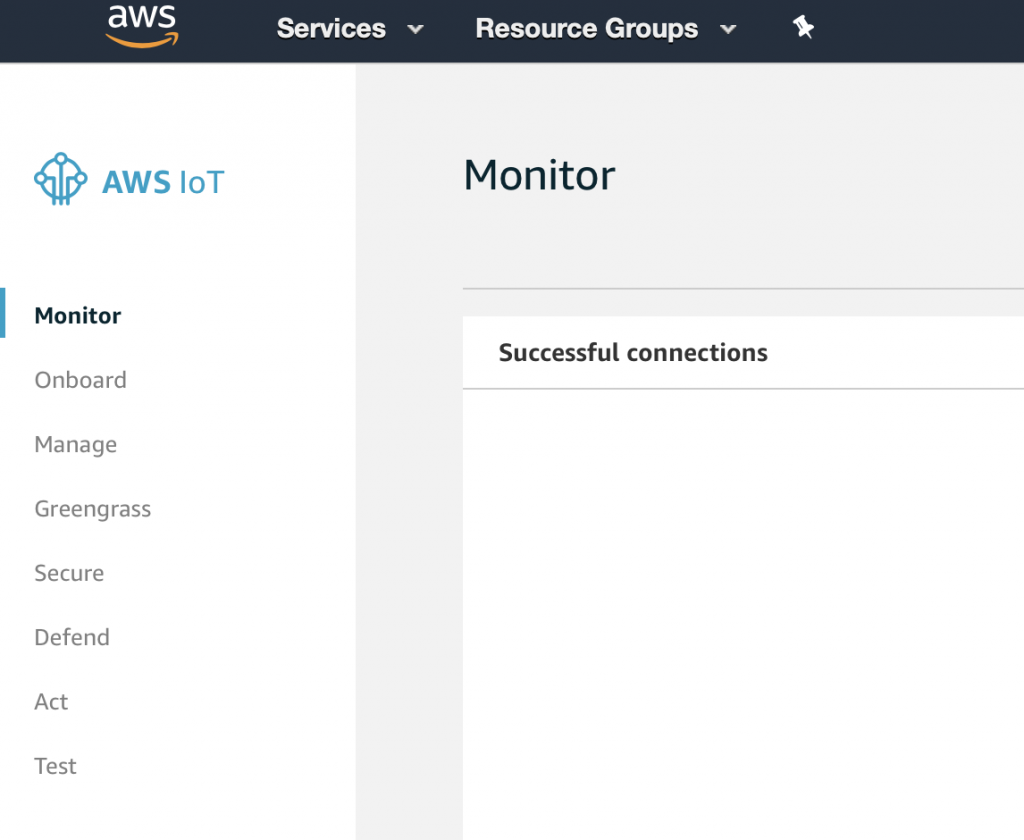
Once you click on IoT Core, you will end up on a screen like this one.  It shows how much activity is going on in my account (basically not very much).  On the left side of the screen are all of the functions that we will use in this tutorial.

Monitor shows the screen shown above and gives you top level statistics about what is going on in your Cloud.

Onboard is a set of new tools to help you attach devices to your AWS IoT Cloud (I have not used any of them)

Manage allows you to create, delete, modify all of your Things (we will do quite a bit of this)

Greegrass is a tool that allows you to have a local “server” that all of your things attach to.  I have not used it as of yet, but will in the future.

The Secure menu give you access to all of your Certificates and Policies.

Defend gives you access to tools to monitor and defend your IoT network as the Russians, Chinese and CIA are all trying to get into your network.

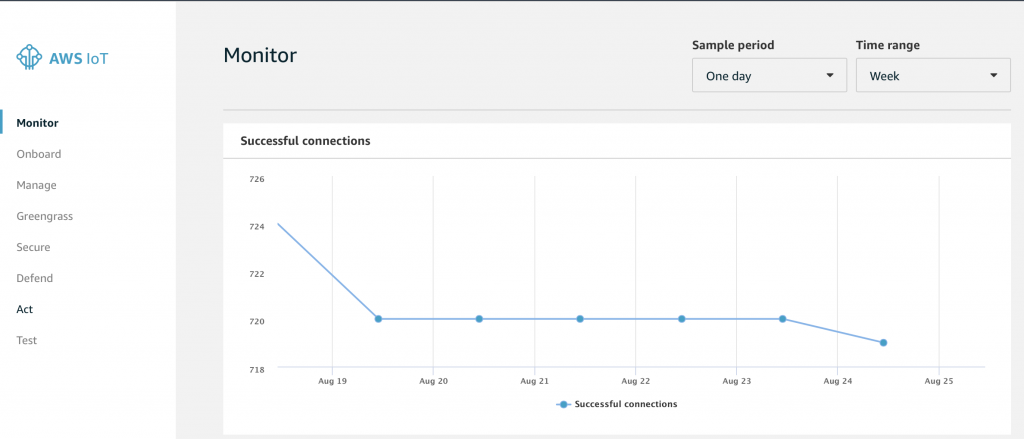
The Act screen allows you to create Rules to do stuff based on things happening in the world of your MQTT Message Broker.  In a future article I will show you how to Act on an MQTT message to run an Amazon Lambda Function.

Test starts up a REALLY cool web based MQTT test tool that will allow you to Publish and Subscribe to messages that are flying around on your MQTT broker.

Create a Thing & Certificates

Amazon has some pretty decent documentation which shows you how to create and manage things which you can find here.

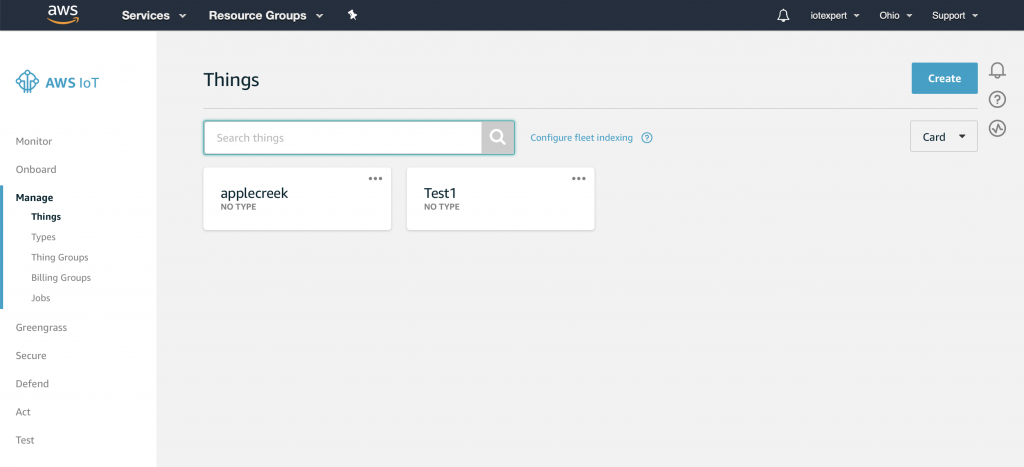
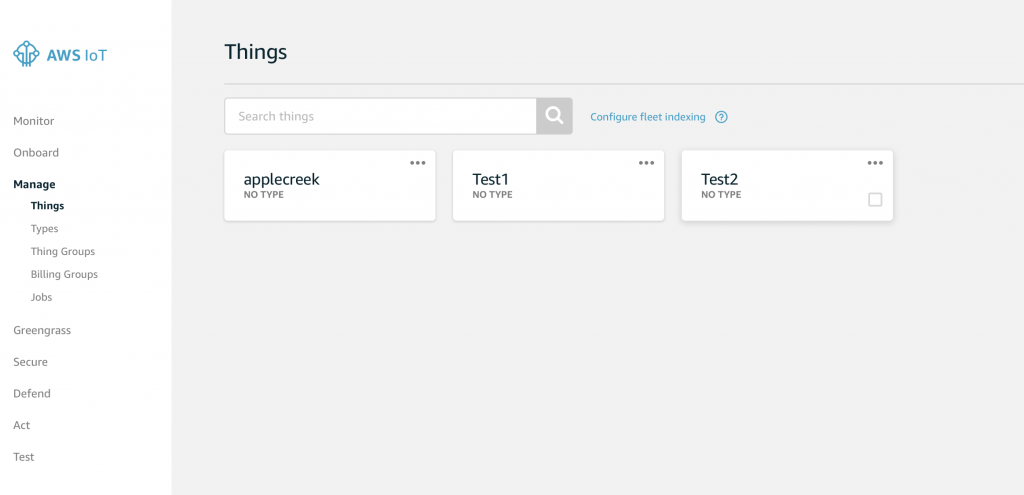
Finally, we are ready to actually do something.  Specifically we will create a “Thing” to represent the water level in the Elkhorn Creek.  Click on Manage -> Things.  You can see in the picture below that I already have two devices in my Thing cloud, applecreek and Test1.  Press “Create” to start the process of creating  new Thing.

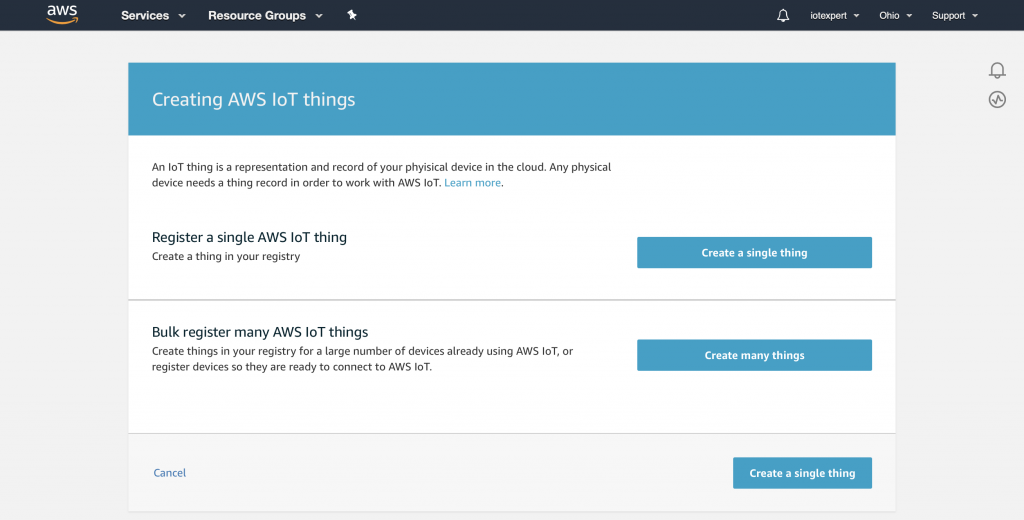
Obviously, Amazon designed this whole system to be able to handle boatloads of Things, so they provide the ability to create many things, both in the GUI as well as with the command line.  But to learn the process we will create a single thing using the web gui.  Press “Create a single thing”

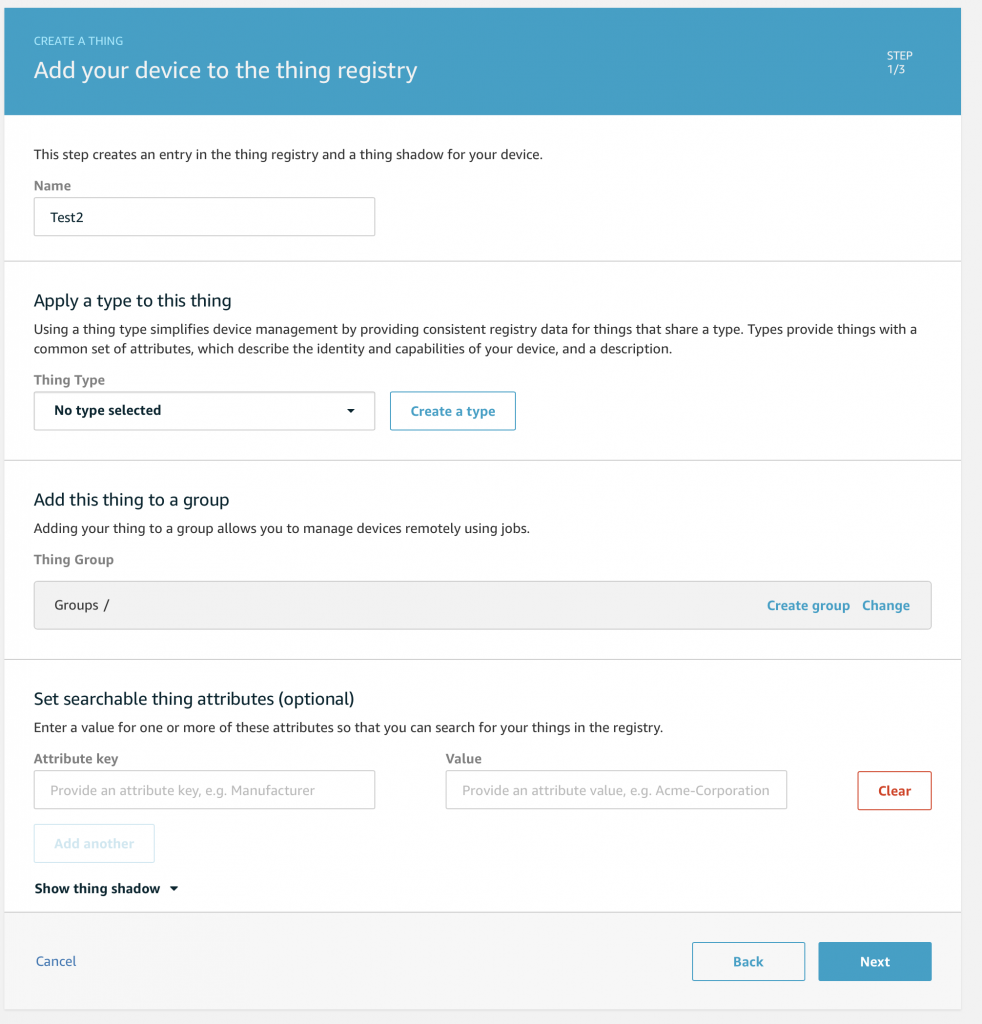
Give you Thing a name (yes there are tons of bad jokes which could be done here).  I will call my example Thing “Test2”.  Then press “Next”

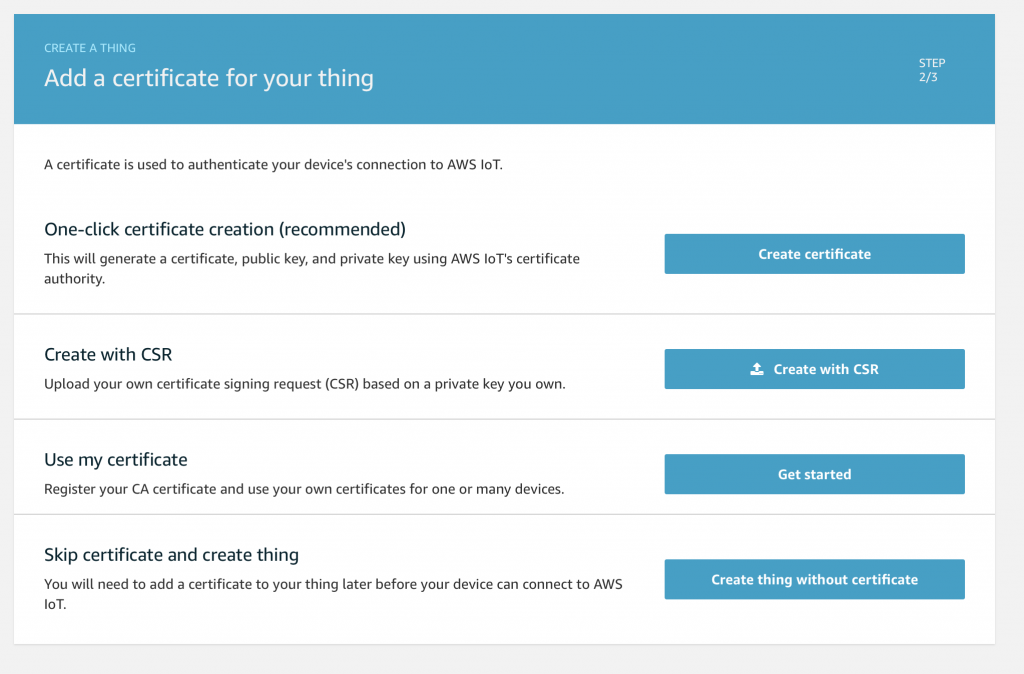
In order for you Thing to connect to the network it needs to have a Certificate attached to it.  The certificate documentation is here.  It is possible to use your own certificates or have Amazon sign your certificates.  However, we will do the simple thing and let Amazon create the Certificate for us.  Press “Create certificate”

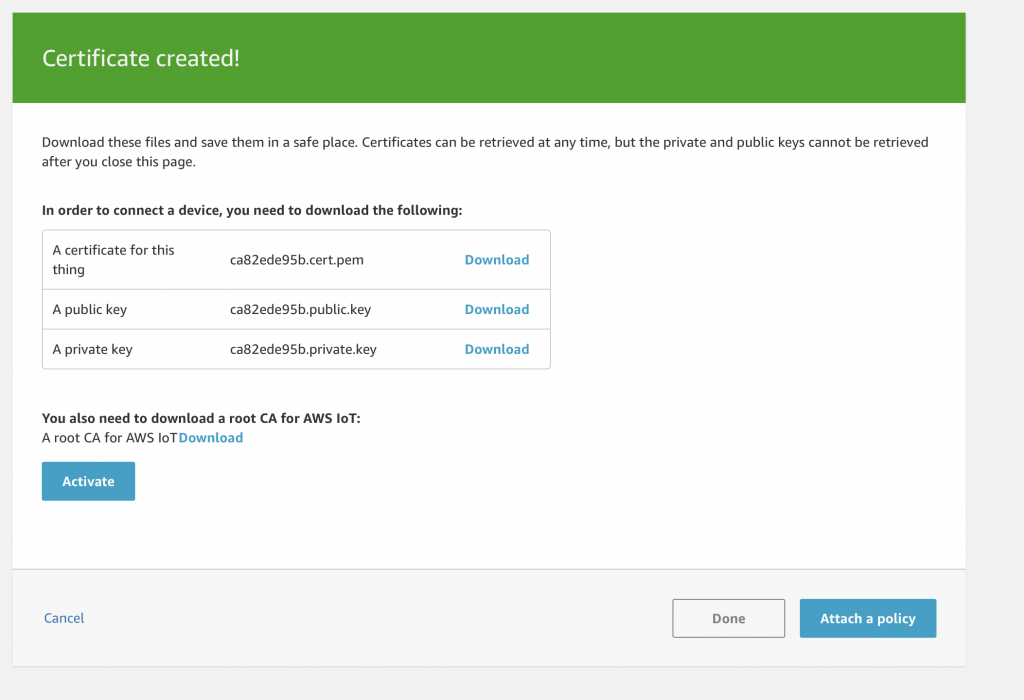
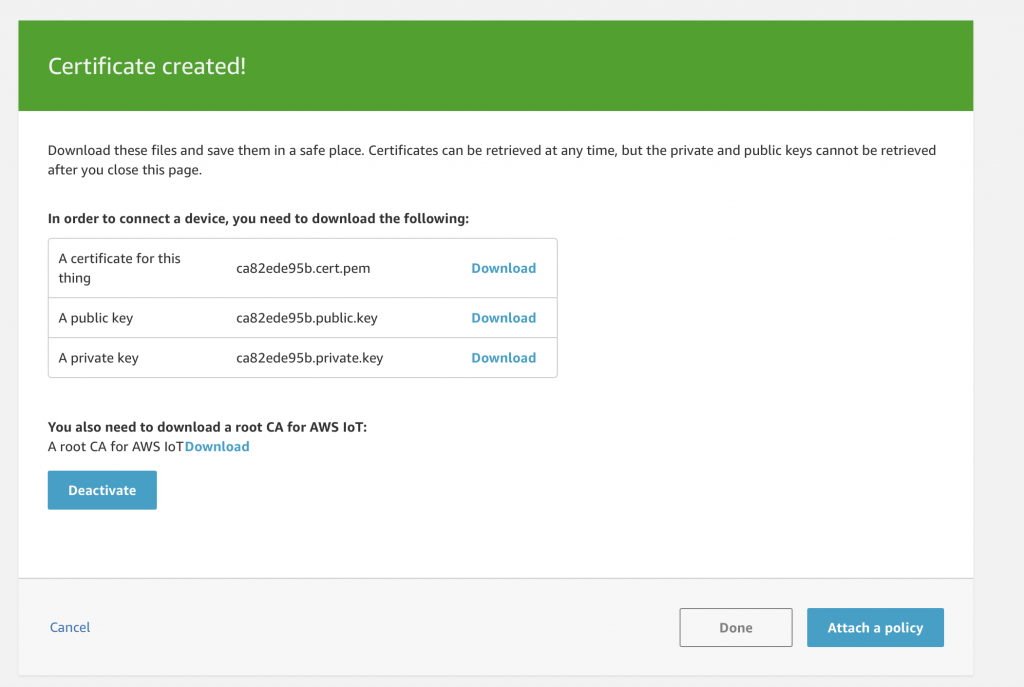
Once the Certificate is created you will come to this screen.  In order to use the Certificate on your Thing you will need to download it as well as the private/public key pair.  You should take the opportunity to down these NOW.  Once that is done press “Activate” to turn on the Certificate.

Once you have activated the certificate you get your LAST!!! chance to download the certificates.  If you do not download them, then you will need to delete them and create a new set.  You should be careful where you store the keys on  your local device as they will give bad actors the ability to access your Things.   If you look around on GitHub it will be common to find them, so be careful.  Press “Done” to move to the next screen.

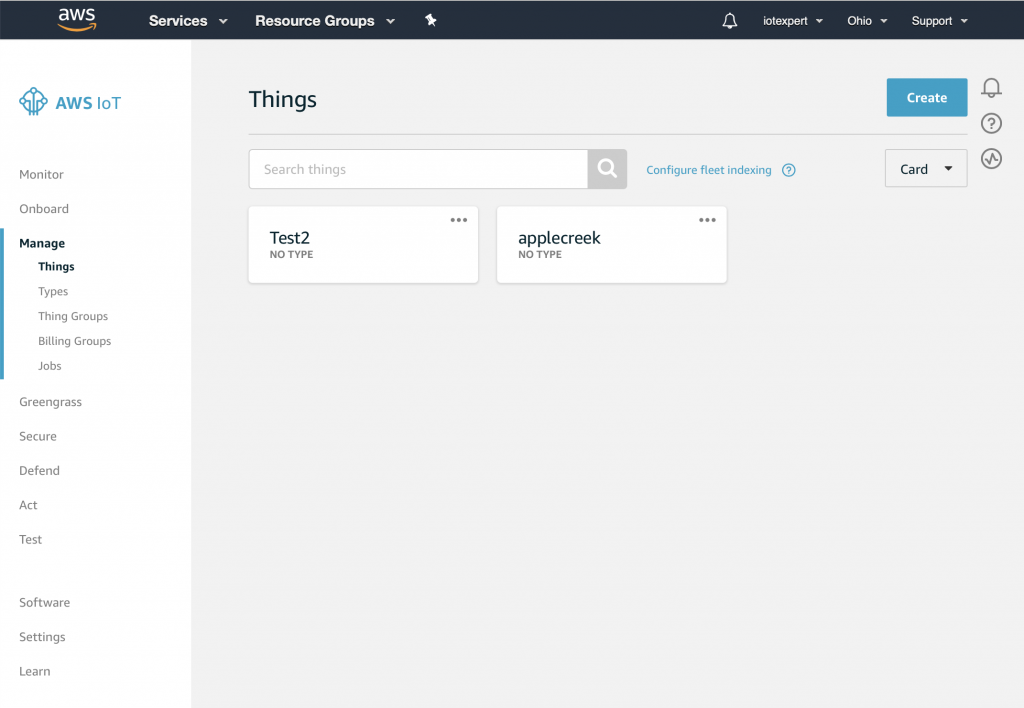
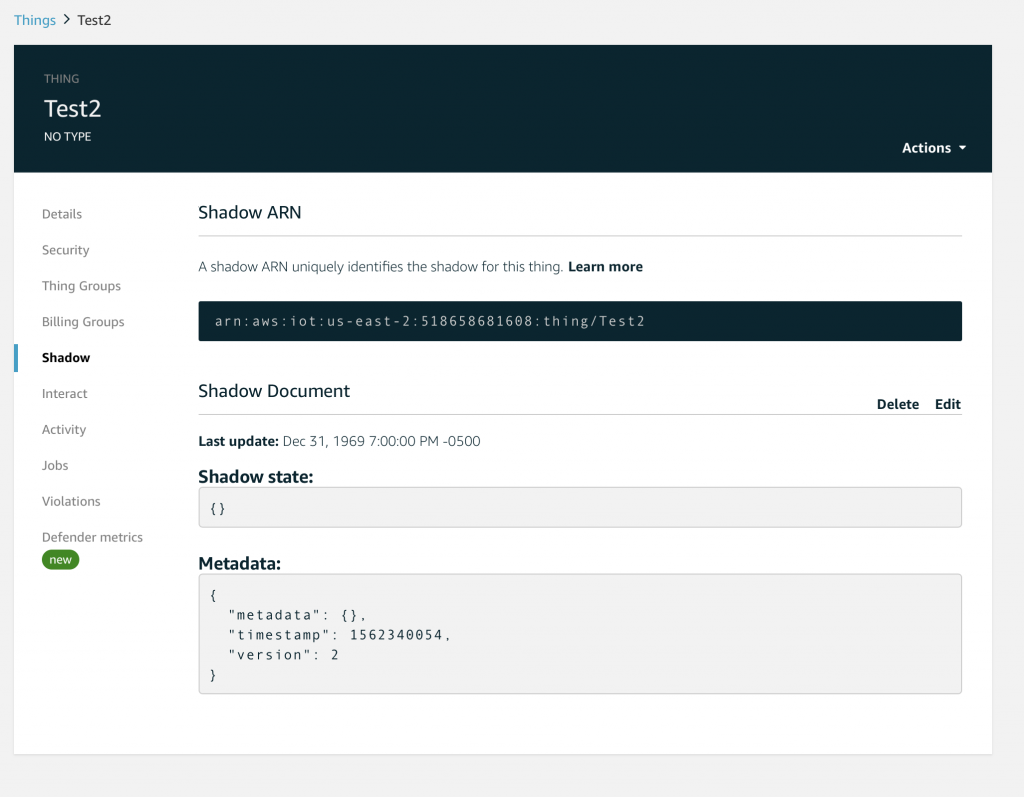
After you have created a device your screen will look something like this.  You can see that I already created several Things which I called “applecreek” (the Thing that is in production on my real system.  Now that you have “Test2” we can look at it to see some of the properties.  Click “Test2”

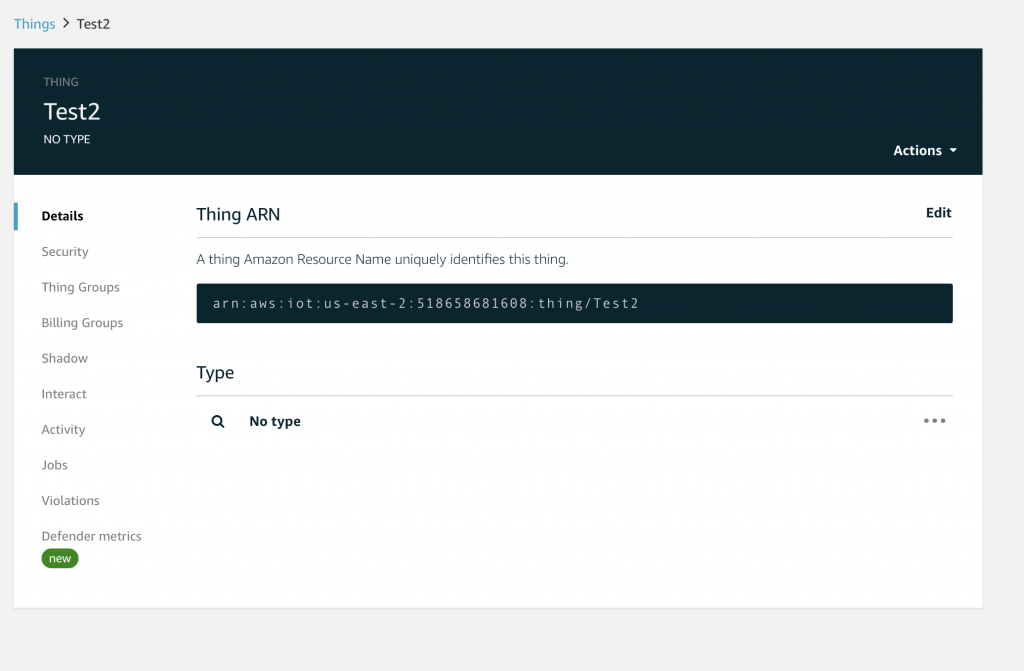
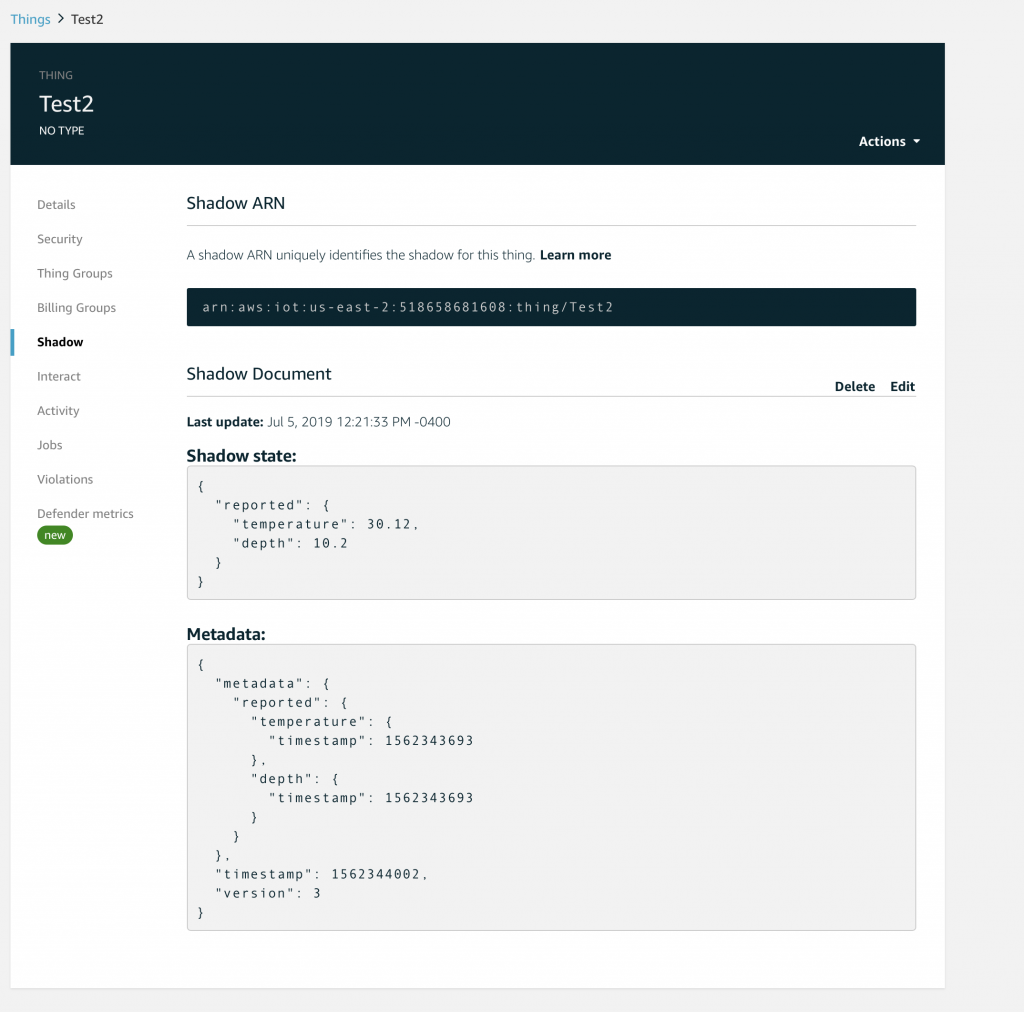
You will see a list of properties classes of the device.  Starting with the official Amazon Resource Name (ARN) of your device.  If you click on “Security”

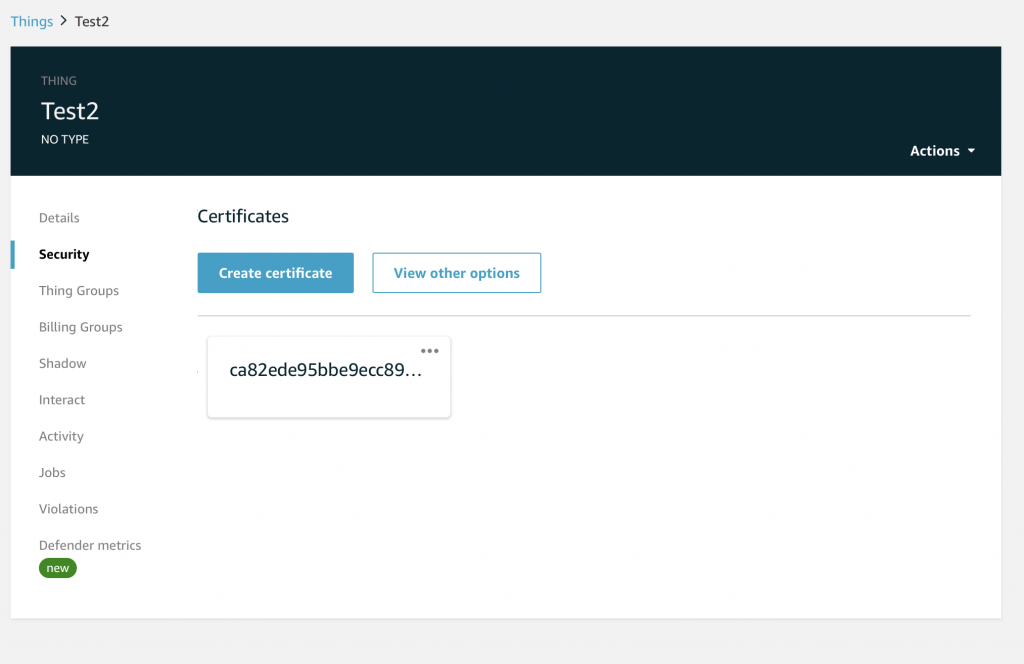
You will see that indeed you have a Certificate that is “attached” to your device.  Hopefully you downloaded the keys that go with the device.  If you didn’t you are screwed and will need to create a new Certificate (which you can do on this screen)

Create a Policy and Attach it to your Certificate

Amazon has documentation for Policies here.  As I discussed earlier a Policy is a JSON document that is attached to a Certificate that enables a Thing who is identified by that Certificate to take Action(s) on a specific Resource as identified by an ARN.  Policies can have wildcards for Actions and Resources, so they may be  attached to multiple Certificates.  Imagine Action:* and Resource:* (which is probably a bad policy)

Let’s create one and that should illuminate things better.  Go back to the main screen and click on “Secure->Policies”.  Then click “Create”

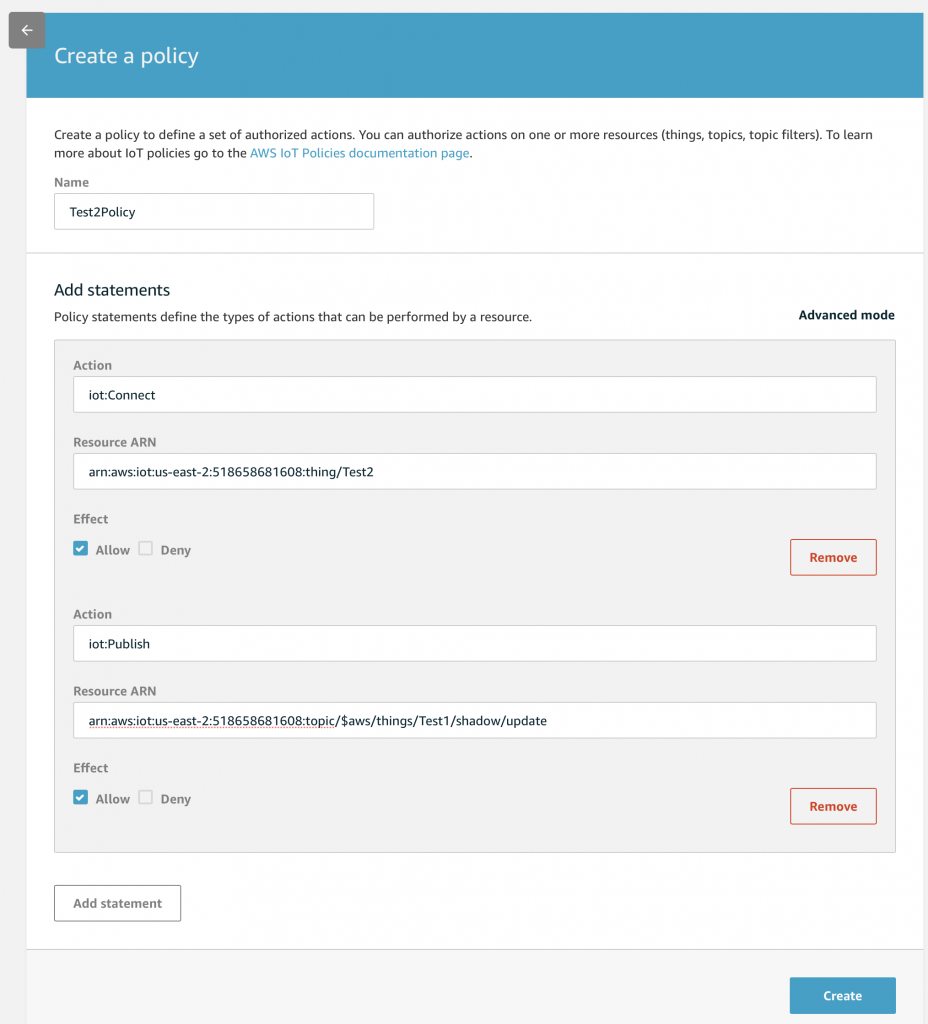
Give the Policy a name.  In this case “Test2Policy”.  My Policy has two Actions.

  1. IoT:Connect which is allowed by the Thing “…./Test2”
  2. IoT:Publish which is allowed you to MQTT Publish to the topic listed (notice I made an error and I really meant Test2)

When you click on the Actions box Amazon give you a list of suggestions.  One of the suggestions is “IoT:*” which means ANY of the IoT actions (like Connect, Publish, Subscribe,…)  You can also specify a wildcard for the resources with a “*”

After you have the policy done, click “Create”

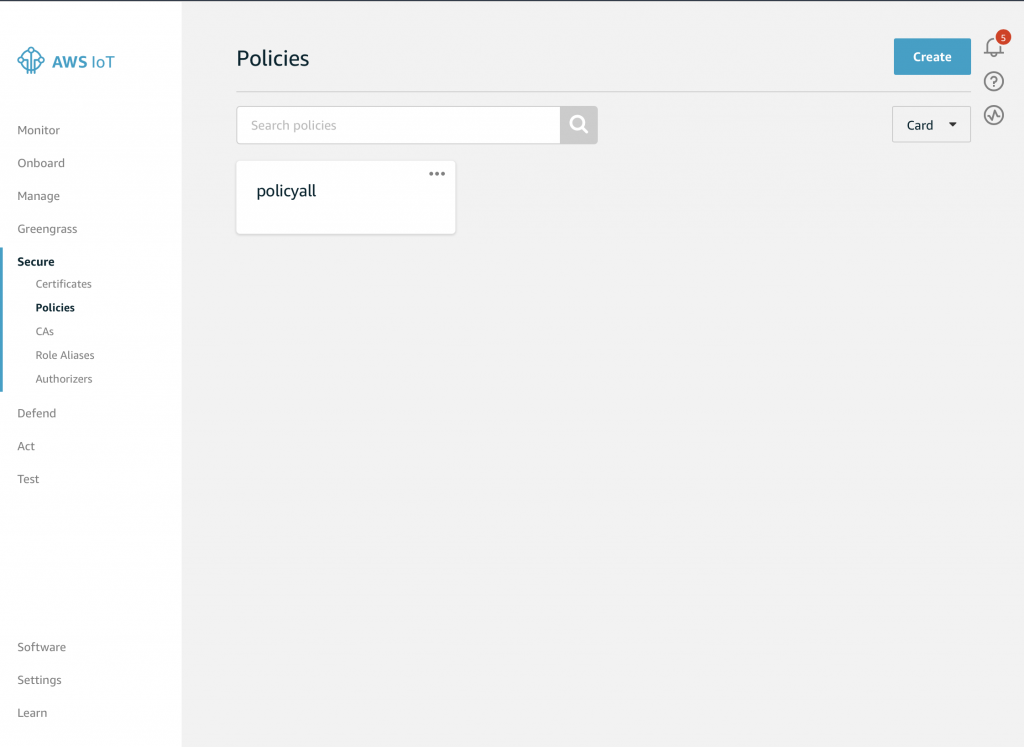
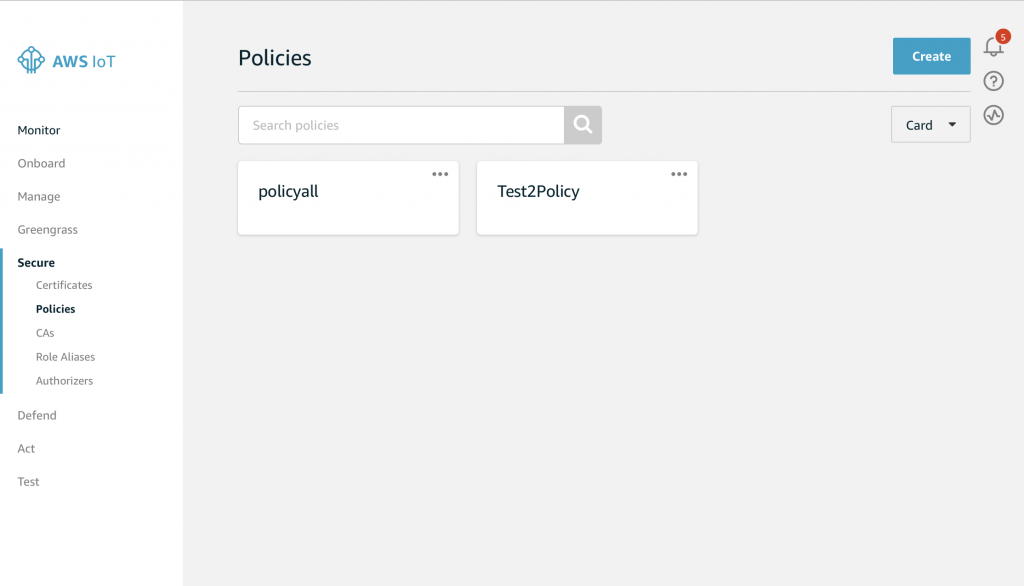
And your screen will look something like this.  Notice that I setup a policy called “policyall” which is a wildcard policy that lets me do anything.  You can click on the policies and see what is going on with them.

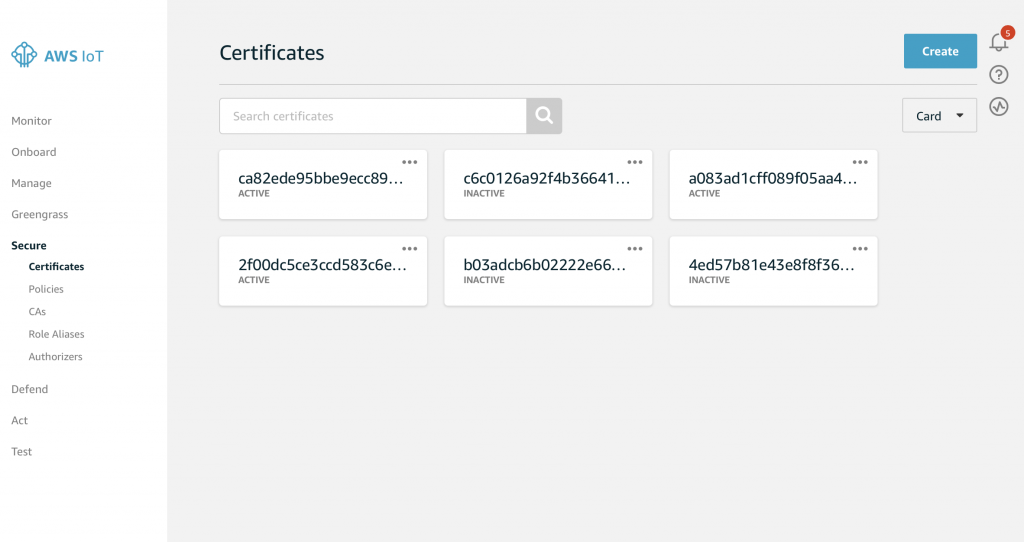
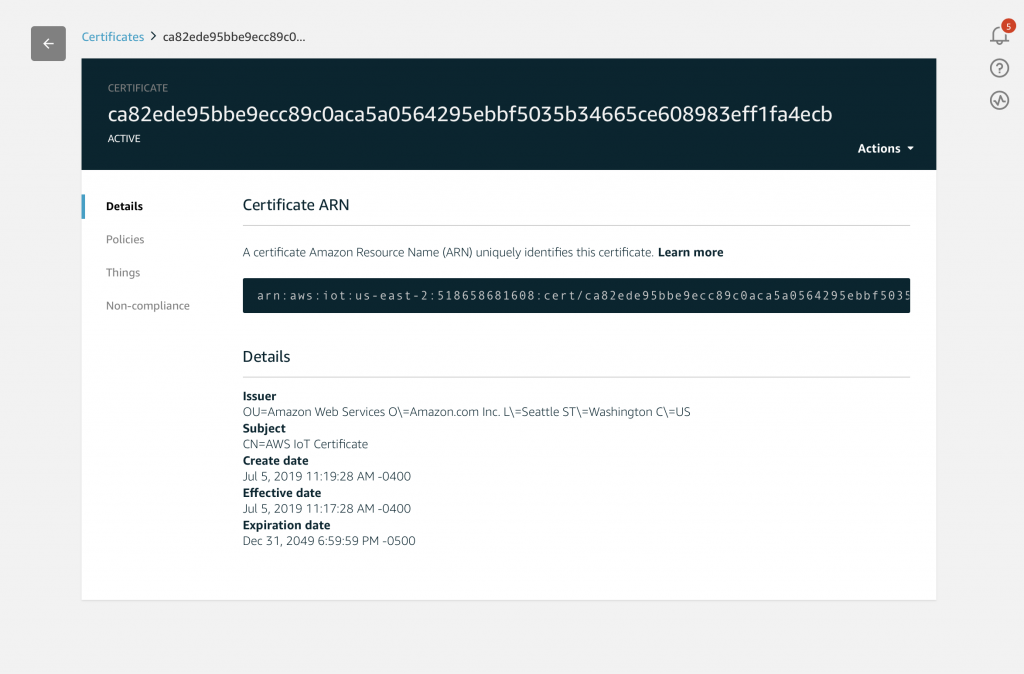
In order to have the Policy take effect you need to attach it to the Certificate.  Click on Secure->Certificates.  Then click your specific Certificate.  In my case it was “ca8…”

When you get to the Certificate page you can then click on “policies”

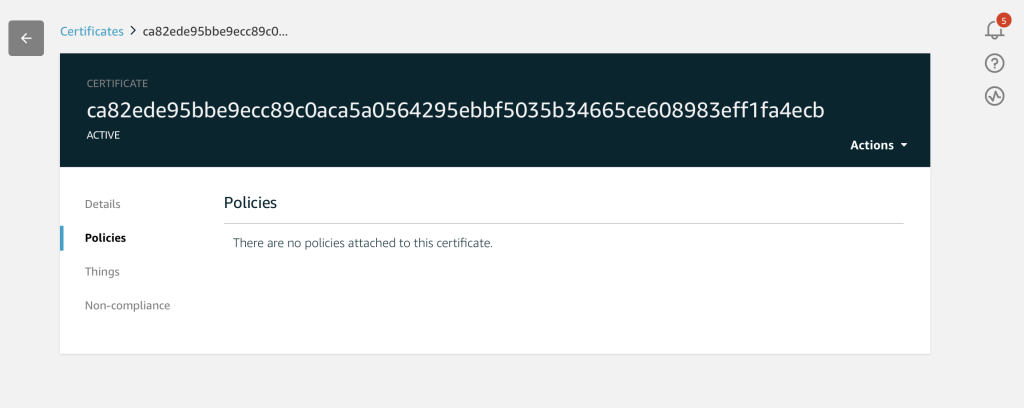
Where you will see that you don’t have a Policy associated with your Certificate.

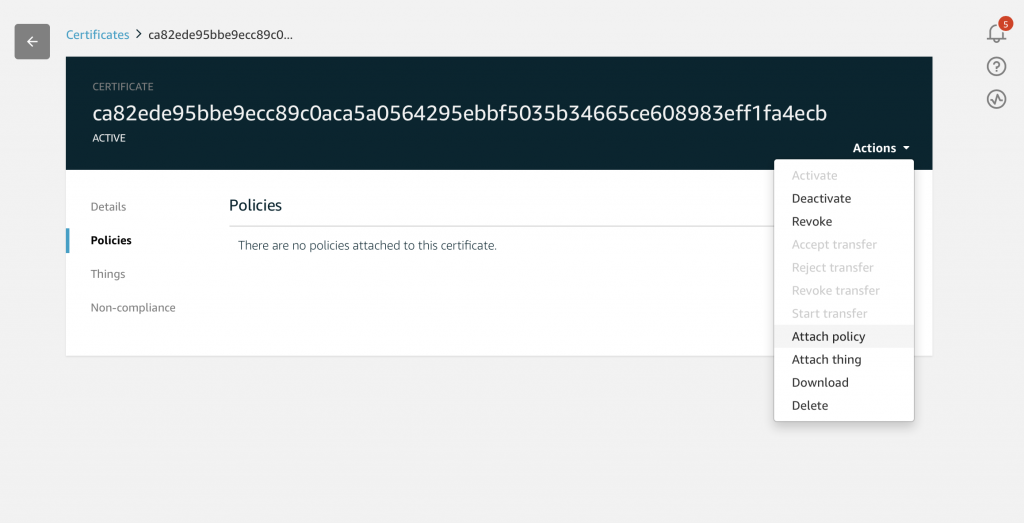
Fix that by click on “Actions” which is on the right hand side of the screen.  Pick “Attach Policy”

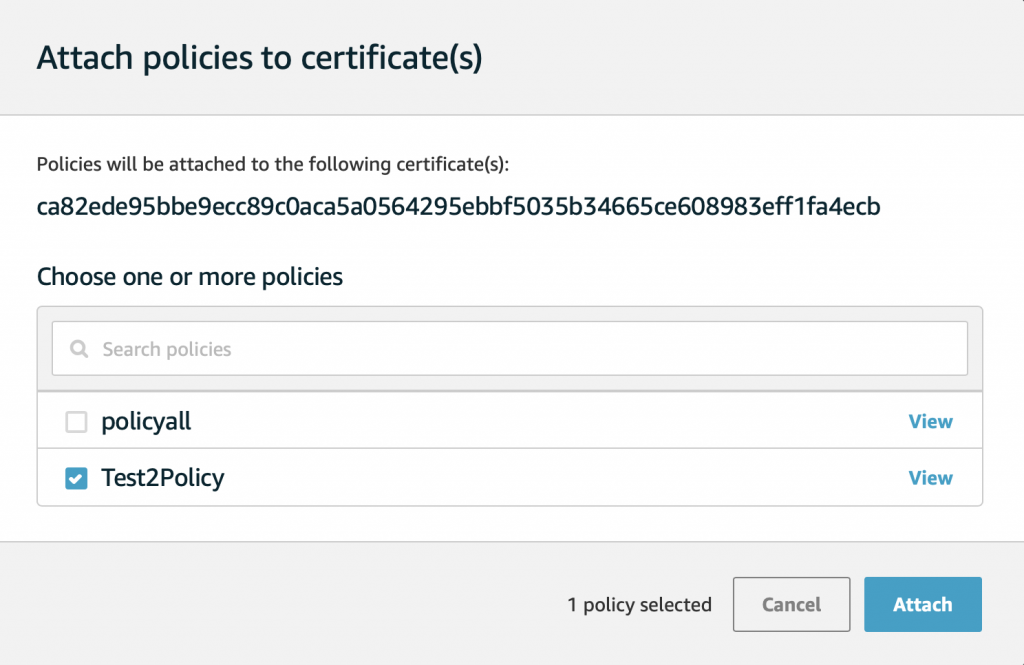
On this screen pick the policy you want to attach.  In this case I picked “Test2Policy”.  Then click attach.

MQTT & the Test Client

One of the coolest things that Amazon provides is a web browser based MQTT client.  To get to it press “Test” (the last item on the left)

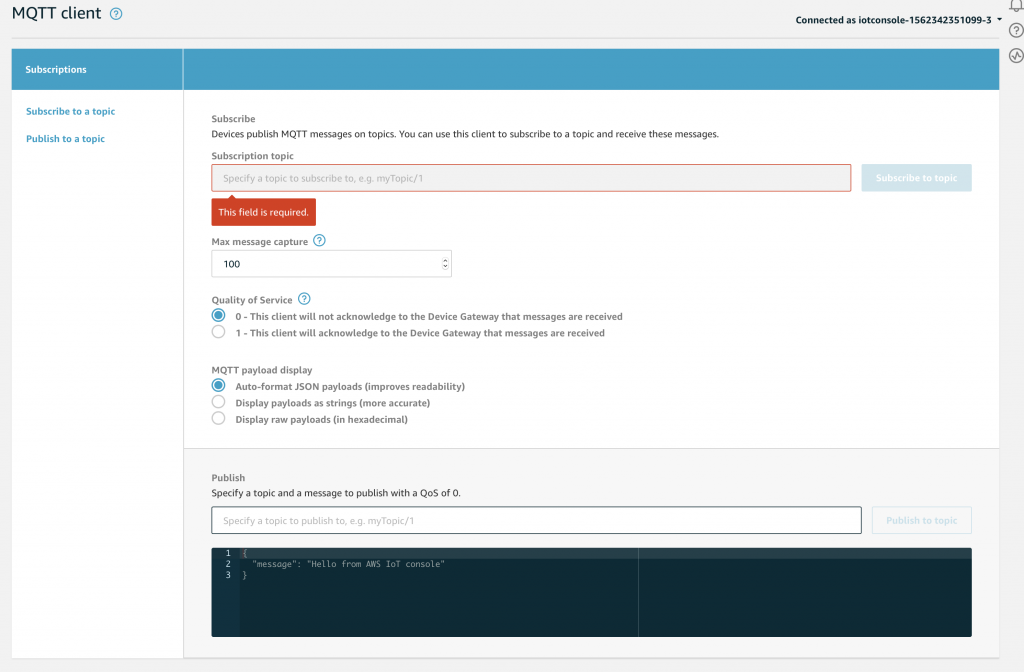
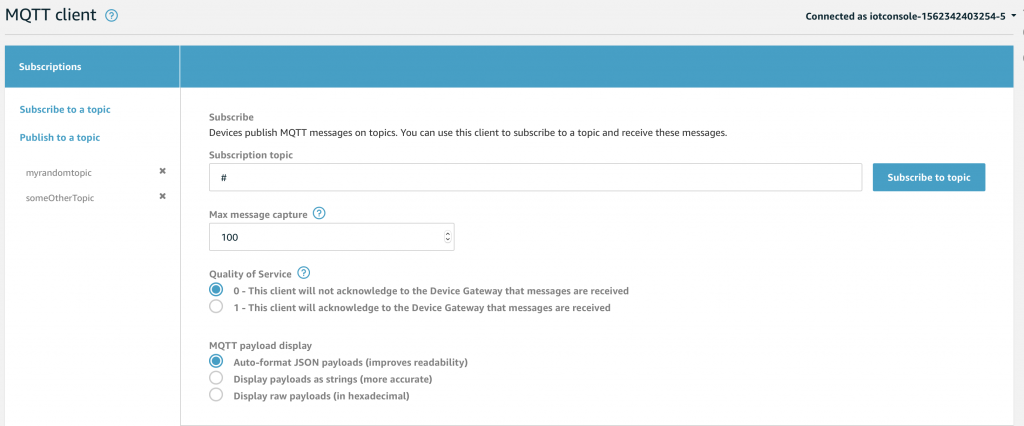
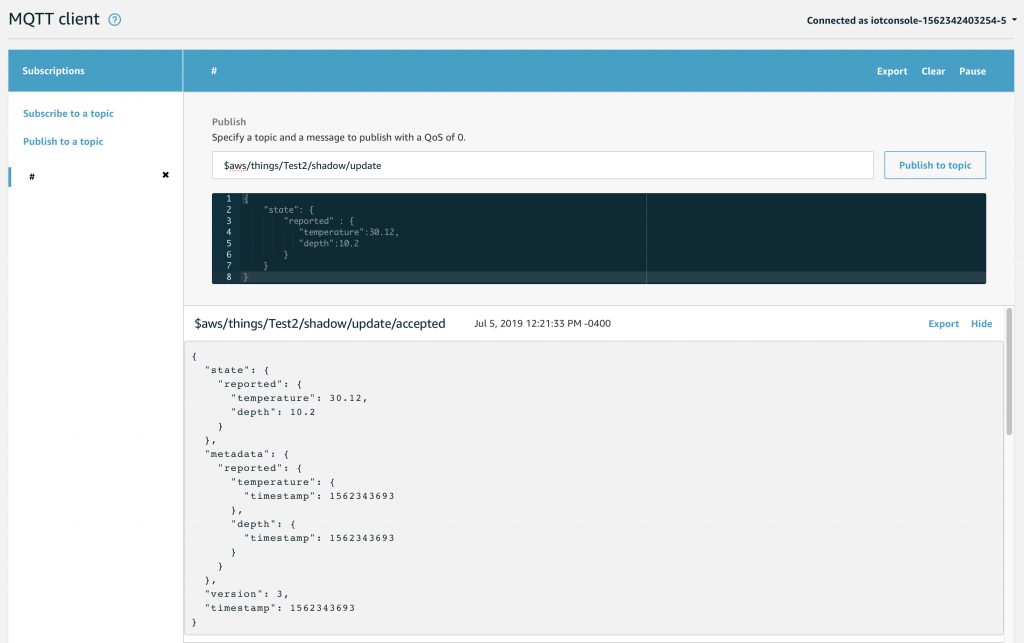
Which will bring you to this screen.  Here you can Subscribe to Topics by typing the name of the topic you are interested in and clicking “Subscribe to Topic”.  You can also Publish messages to a Topic by typing the Topic name in the Publish box, and typing the message in the black box.  The message is typically in JSON format, but this is not actually a requirement.

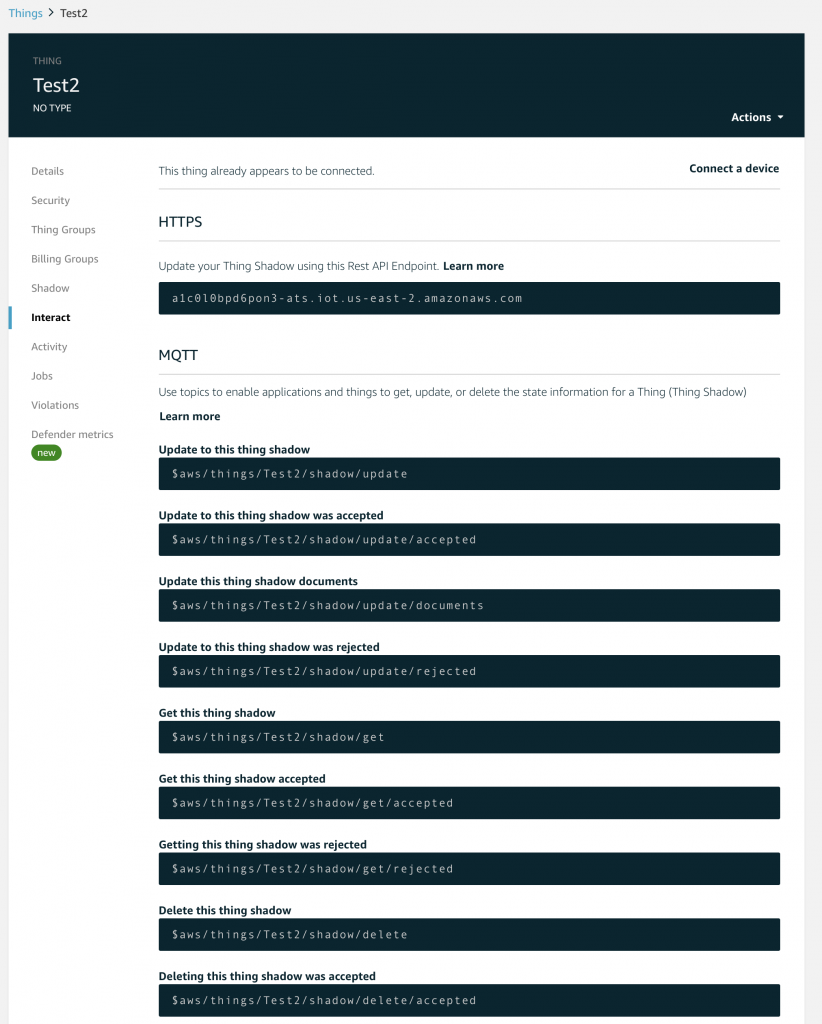
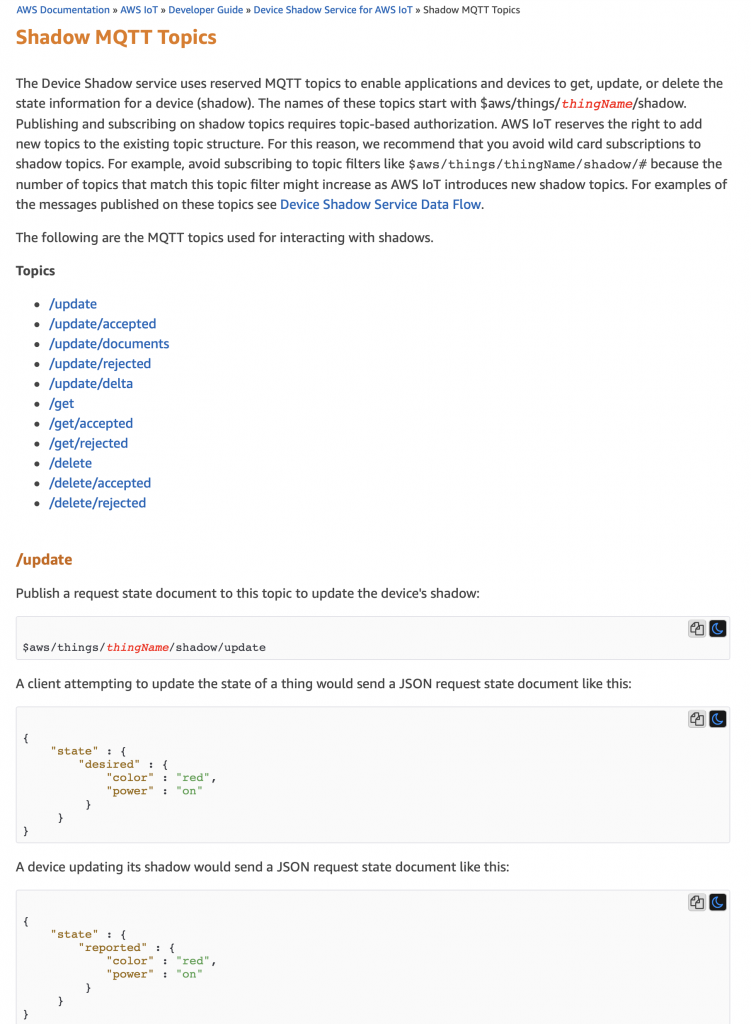
There are very few rules about topic names and as such are left up to you as application semantics.  There are, however, a few reserved names which cause specific things to happen in the AWS IoT Cloud.  These topics all start with $aws and are documented here.

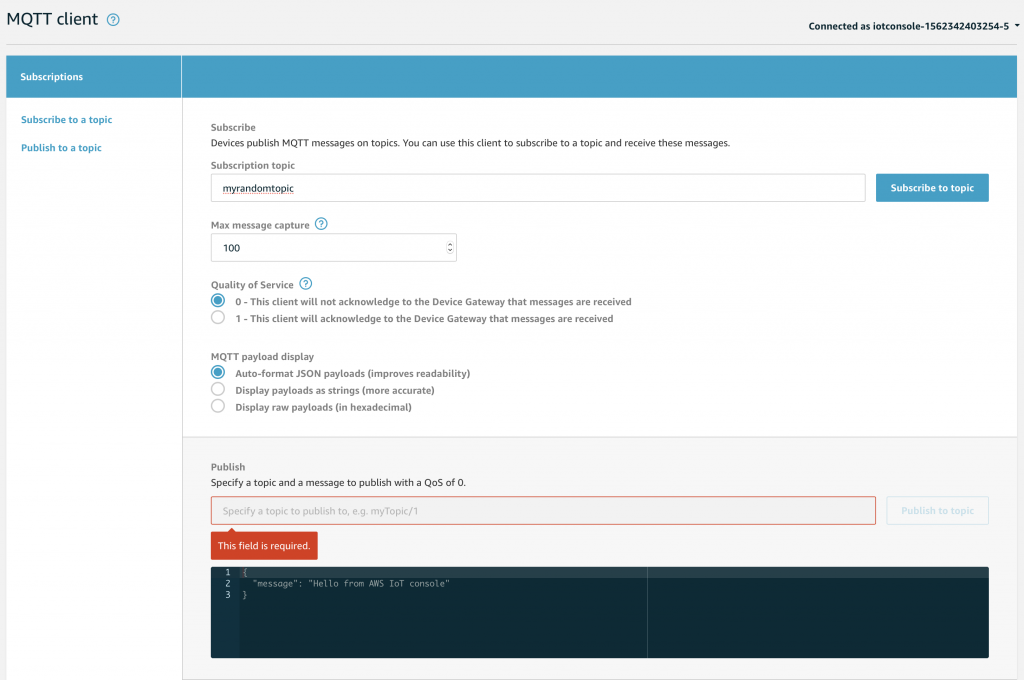
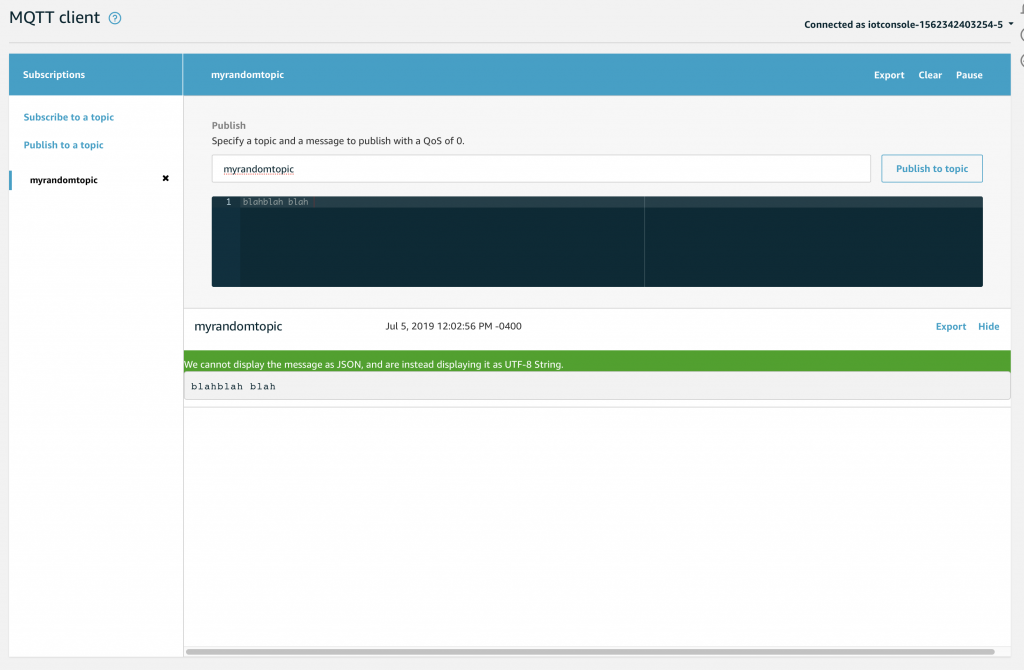
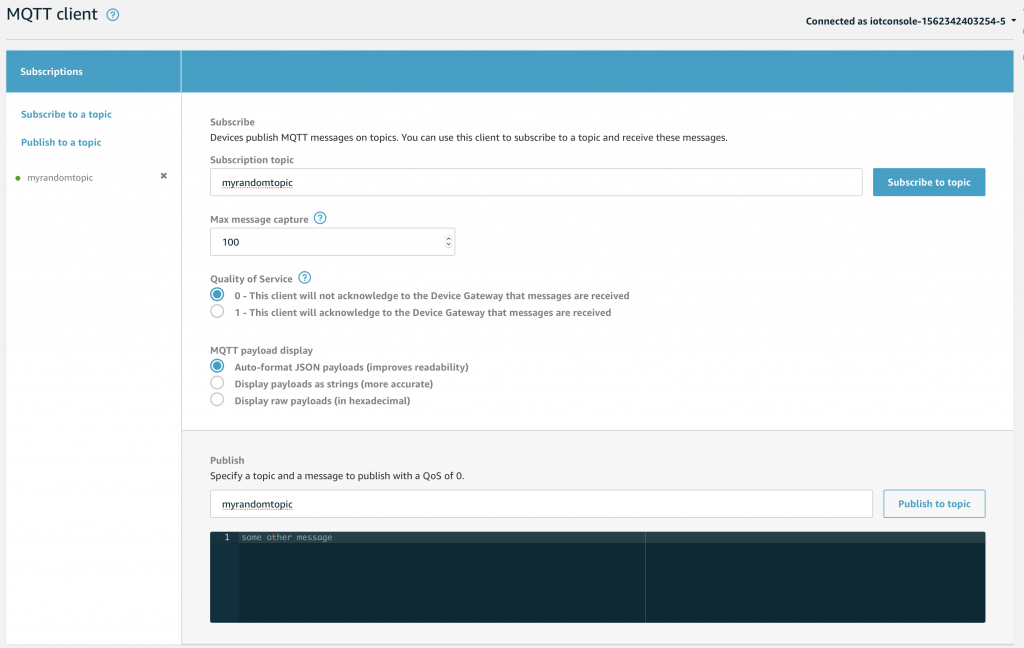
Let’s do a little demonstration of the system by subscribing to “myrandomtopic”, obviously just a name I made up.  Type in the box and press “subscribe to topic”

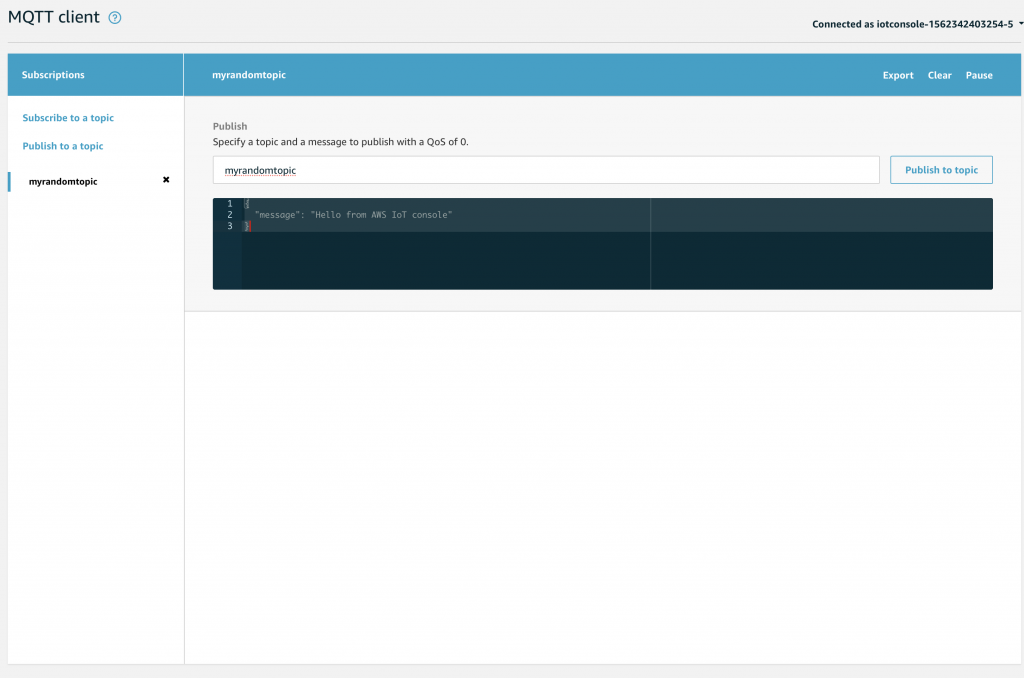
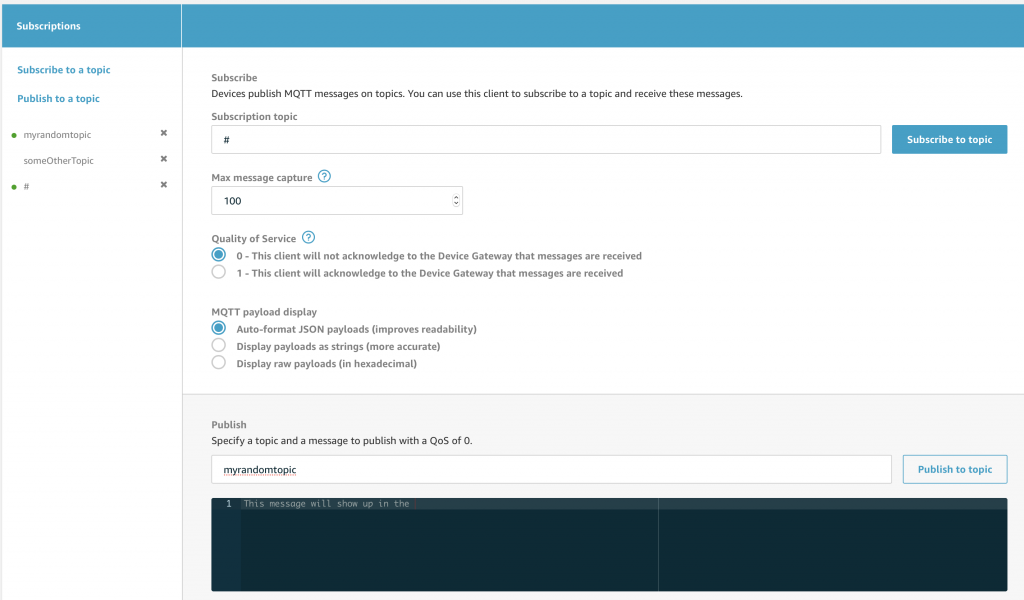
Once that is done you will see on the left side of the screen the topic name in bold with an “x”.   To actually publish something you can type a message to be sent into the black box… and when you press “Publish to topic”  Go ahead and type something.

When you press publish, your screen will show each the message that is Published to the Topic because you are Subscribed.  This will include messages you Publish in the Test console, as well as Messages that are Published by other devices, like your Thing.  This is a really convenient way to debug what is going on in your system.

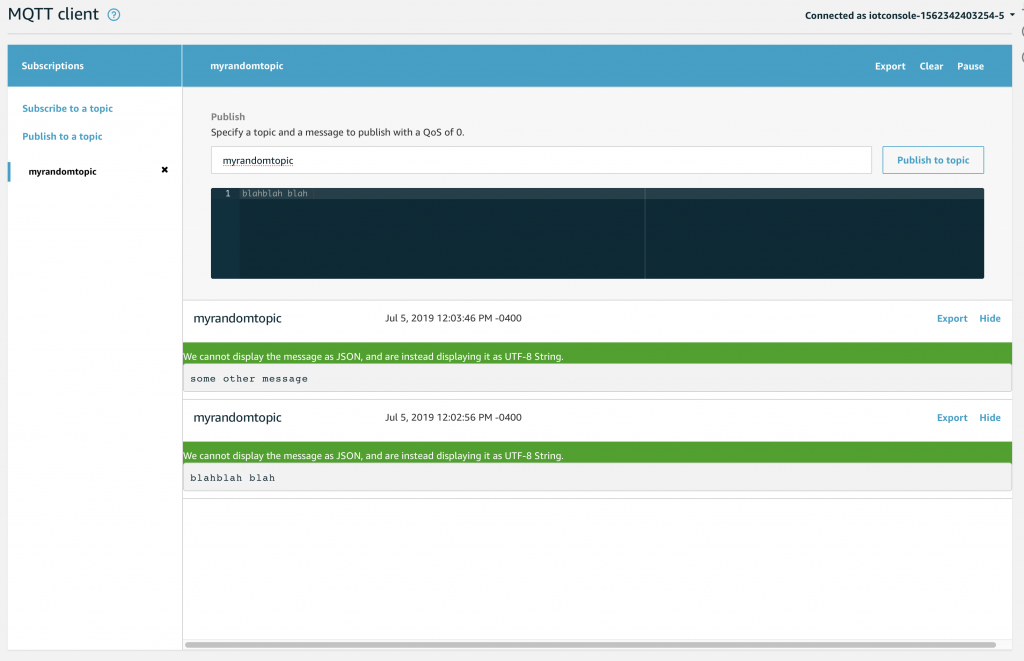
If you go back to the publish to a topic screen and type a different message… then press “publish to topic”… you will notice a green dot next to the topic indicating a new message.

And when you click the topic you will see the history of message Published since you Subscribed.

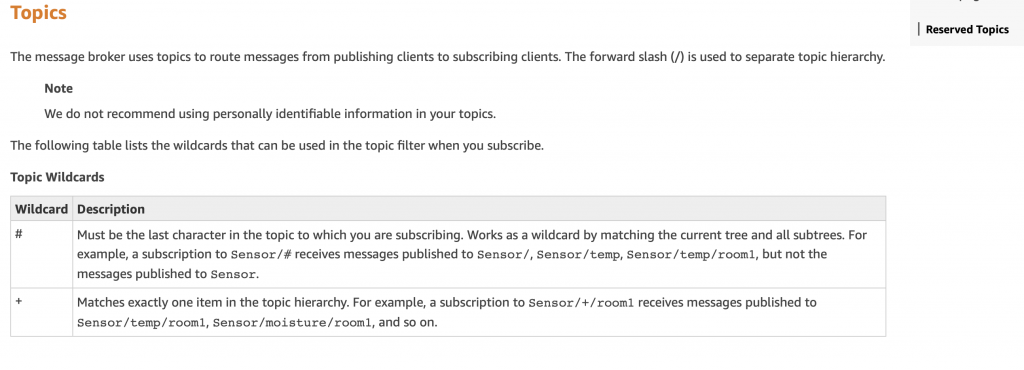
You are allowed to subscribe to multiple topics at a time and it will show all of them.

There is also the ability to subscribe to “wildcard” topics.

Which means you can subscribe to “#” which will give you all messages sent to the MQTT message broker

Notice that if I Publish to “myrandomtopic” that it will match by “myrandomtopic” as well as “#” (look at the green dots on the left of the screen)

The Device Shadow

The purpose of the Device Shadow is to serve as a Cache of the Reported and Desired State of a Thing.  This allows a Thing to not be connected all of the time.  Imagine that a light build sends its “reported” state every time that it changes.  And a light switch will send the light bulbs “desired” state when it wants to change the light bulb.  This allows a device to figure out what state it is supposed to be in when a power outage occurs.  And it allows devices to find out what is going on with a Thing without having to talk directly to them.

The official format of the Device Shadow is as follows.  Notice just another JSON document.

Here is an example document

You can look at the Device Shadow by Clicking on a Thing in the Management Console.  Then clicking Shadow.  This device has a boring document which nothing in it.

Update the Shadow Using the Test Client

The last piece of this puzzle is how a Thing interacts with its Device Shadow.  That is simple.  A Thing needs to send JSON message in the right format to the right MQTT Topic.  If you click on “Interact” it will show you the list of Topics.

In the documentation there are examples of JSON messages that you need to Publish.

Given all of that, let’s update the shadow for Test2 by publishing a message with the temperature and depth in this JSON document

{
    "state": {
        "reported" : {
           "temperature":30.12,
           "depth":10.2
        }
    }
}

First subscribe to the “#” topic so you can see all of the messages.  Then publish the JSON document.

In the MQTT test client you will see

  • $aws/things/Test2/shadow/update/accepted
  • $aws/things/Test2/shadow/update
  • $aws/things/Test1/shadow/update/documents

Then you will be able to go to the management console –> Manage -> Things.  This will show you all of your “things” including the “Test2” that we just updated.  Click on “Test2”

Then click Shadow.  Now you will be able to see that the document has been updated and it is caching the state of the device.

Now that we know how to interact with the device shadow via MQTT.  How do I get the Raspberry Pi to send MQTT messages?  That is the topic of the next article.

The Creek 2.0: Amazon AWS IoT Solution Architecture 2.0

Summary

Last week I talked about fixing my Creek Water Level sensor.  This got me to reflecting on a change that I have been wanting to make for a long long time: moving all of the backend server stuff to the Amazon AWS IoT Cloud.  In this article, I will explain the architecture of the intermediate end result.  What in the world does “intermediate end result” mean? Alan, is that a really goofy way to say that you aren’t going to finish the job?  Well, I suppose yes, not at first.  But I am going to hook up all of the middle stuff, from the current Raspberry Pi to an Amazon Relational Database Server (RDS) running MySQL.

There is a bunch of technology going on to make my new solution work, including:

  • PSoC 4 & Embedded C
  • Copious use of Python
  • MySQL
  • JSON
  • Raspberry Pi
  • MQTT
  • AWS IoT Core, Shadow
  • AWS Python SDK

Architecture

This is a picture of the updates to the system architecture.  The boxes in green are unchanged from the original system architecture.  The purple Raspberry Pi box will get some new stuff that bridges data to the Amazon IoT cloud and the blue boxes (which are Amazon AWS) are totally new.

(1) Pressure Sensor

The Measurement Specialties US381 Pressure sensor remains unchanged.  It senses the water pressure from the Creek and returns 4-20mA based on a pressure of 0 to 15PSI.  0PSI=4mA, 7.5PSI=12mA and 15PSI=20mA.

(2) Creek Board

The Creek Board remains unchanged.  It supplies power to the pressure sensor and has a 51.1Ohm sensing resistor which serves to turn the current of 4-20mA into voltage of 0.202V to 1.022V, which is perfect for the PSoC Analog to Digital Convertor.

(3) CyPi Board

The CyPi Board remains unchanged.  It has an Arduino pin out on the top to connect to the Creek Board and on the bottom it has the Raspberry PI I2C and GPIO interface.  On the board is a PSoC 4 which reads the voltage of the pressure sensor.  This board also provides power to the sensor and the Raspberry Pi (remember from the previous post that I blew up the power regulator)

(4) Raspberry Pi

In the original design the Raspberry Pi runs a bunch of different Java programs as well as MySQL.

I am going to leave all of the original stuff unchanged.  In the picture above, you can see the runI2C shell script, which is run by the Raspberry Pi crontab.  I will modify this script to run a Python program that will read the sensor state using the SMBus library, then format a JSON message, then connect to the AWS MQTT server using the AWS IoT Python library and send an update of the Shadow state.

(5) AWS IoT MQTT Message Broker

The AWS IoT Cloud provides a bunch of tools to help people deploy IoT functionality.  There are two principal methods for interacting with the AWS IoT Cloud: Message Queuing Telemetry Transport (MQTT) and Hyper Text Transfer Protocol (HTTP).  I will be using MQTT to interface with the AWS Cloud.  Specifically, I will create JSON messages that represent the state of my IoT Device (the Creek Depth and Temperature) and then I will send it to the Amazon AWS MQTT Message Broker.  The message will be stored in a facility provided by Amazon called the Device Shadow, which is a cache of your “thing” state.

(6) AWS IoT Rule Actions and (7) AWS Lambda

In the AWS IoT Core management console you can configure “Act”ions based on the MQTT messages that are flying around on the MQTT broker.  My action will be to look for updates to the Device Shadow topics and then to trigger an AWS Lamba function.  That Python function will take the JSON message (sent via AWS) and will insert the data into the MySQL database.

(8) AWS RDS MySQL

I will create almost the exact database that is running on the Raspberry Pi and install that into an Amazon Relational Database Server (RDS) running MySQL.  I decided to make the database extensible to add data from other “things”.  To do this I add a table of device names and id which map to the data table.

Future

When I get a few minutes there are a bunch of things that I would like to add to this system

  • Remove the Raspberry PI and create a PSoC 6 / 43012 Amazon Free RTOS board to read the data and send it to the AWS Cloud
  • AWS Greengrass
  • Use Grafana to view the data
  • Create and AWS Django Python based web server to display the data

Internet Insanity

Summary

It was pure Internet Insanity at my house this weekend.  On Saturday I was looking at one of my Meraki MR18 access points and realized that it was not plugged into  the LAN via Ethernet.  In other words it was operating as a mesh repeater.  That situation really sucked given that it was only about 20 feet (through a wall) to the main LAN switch.

But it was even worse than it seemed because I had 20 years of networking equipment stacked up in my wiring closet.  Yes, my house has a wiring closet.  Doesn’t yours?  The first order of business was to yank it all out except the current stuff.  Check out this pile of old stuff.

Apparently over the years I have used about 7 different WiFI and Ethernet solutions.  How is that given that there hasn’t been that many 802.11s?  Hell if I know.  But this turned into a major major job.  Everywhere I looked there was a pile of wires.

And this insanity … you wouldn’t believe how many ethernet cables there were hidden in the cabinet…

So Nicholas and I headed to Lowes (actually 4 times) and got shelfs, wire zip ties etc.  Then I put him to work. My wiring closet is actually under the stairs, so he first installed rubber tiles on the floor.  Then a shelf, and finally reinstalled all of the networking gear.

Now things are much better on my network.  I use Meraki MR18’s which are 802.11ac radios.  They also have the ability to mesh with each other.  The three radios that you see in the picture with the green circle (not filled) are meshed into the network.

And my gigabit ethernet switch.

The MR18s can look at the spectrum usage… looks like 5ghz is basically empty.

While I was cleaning I found two of this cable… Ill bet you don’t know what it is…


Particle Photon Configuration with Tinker Firmware

Summary

In the last article I wrote about using a CY3280 MBR3 Shield on a WICED WiFI 943907AEVAL1F development kit at the GE MegaHackathon.  In the next article I will show you the WICED HTTP firmware that I wrote to connect to the Particle Photon which they were using (I have written about Particle Photon before).  Obviously, I like Particle Photon because it is a WICED 43362 WiFi Radio.  In this article, I am going to show you how to get a Particle Photon going with the Tinker firmware.  Then test it with the iOS app, the web console and finally using CURL.  The CURL is just a mechanism to send HTTP Posts to the Tinker firmware, exactly what I will do in the next article on the WICED development kit.

Configure the Particle Photon

When you get a fresh Particle Photon out of the box you need to get it introduced to your WiFi network, and attached to your console.  To do this, start by going to setup.particle.io and following the process.

Particle Photon Configuration


Particle Photon Configuration

Particle Photon Configuration

Particle Photon Configuration

Particle Photon Configuration

Particle Photon Configuration


Particle Photon Configuration


Particle Photon Configuration

Testing with iPhone App

One you have “claimed” your Particle Photon and it is connected to the network, then you can talk to it with the Particle iOS app.  Here is what it looked like when I started the App on my phone.  You can see the device called “iotexpert-example” (remember that is what I named it from above).  The “Elkhorn_creek” Photon is the one that I wrote about in this article.

Particle Photon iOS App

Although the console says that I have the Tinker Firmware on the app, I wanted to make sure, so I use the iOS App to re-flash the Tinker Firmware.  You can do this by clicking the new device, then press the little “…” at the top right of the screen.  Finally click “Reflash Tinker”. It is awesome how fast that happens.

Particle Photon iOS Flash Firmware

Once I am sure about the version of the Tinker firmware, I test to make sure that things are working correctly.  First I click on “D7”

Particle Photon iOS Tinker App

Which brings up this screen where you can select digitalRead and digitalWrite.

Particle Photon iOS Tinker App

Then when you press the button it will switch from high to low and vice versa.

Particle Photon iOS Tinker App Particle Photon iOS Tinker App

You can also call the API directly by pressing “inspect” then “Data”

Particle Photon iOS digitalwrite Data Function

Particle Photon Console

In addition to using the iOS App, you can also interact with the Photon using the console.

Particle Photon Console

When I click on the “iotexpert-example” it brings up this screen where I can run the Tinker firmware functions.  In this case I ran “digitialwrite” with “D7,HIGH” which turns on the LED on the Photon.

Particle Photon Console

Testing the Particle Photon with CURL

The Particle Cloud exposes an API which lets you send Restful API requests to specific devices.  The Unix tool CURL lets me type command line requests (which I will mimic in the next Article using WICED).  The first command that I send is and HTTP GET which will return a JSON document that describes the configuration on my Photon.

curl https://api.particle.io/v1/devices/iotexpert-example?access_token=1311f67269d6

You can see the device name etc in the JSON below.  It also shows that the Tinker firmware has four function built into it.

{  
   "id":"2a001b000347353137323334",
   "name":"iotexpert-example",
   "last_app":null,
   "last_ip_address":"69.23.226.142",
   "last_heard":"2017-09-17T15:38:56.406Z",
   "product_id":6,
   "connected":true,
   "platform_id":6,
   "cellular":false,
   "notes":null,
   "status":"normal",
   "current_build_target":"0.5.3",
   "variables":{  

   },
   "functions":[  
      "digitalread",
      "digitalwrite",
      "analogread",
      "analogwrite"
   ]
}

Then I can send a HTTP POST using Curl to turn on the D7 LED.

 curl https://api.spark.io/v1/devices/2a001b000347354/digitalwrite -d access_token=1311f67269d66b -d params=D7,HIGH

You can see the Blue LED right next to D7 turns on.

Particle Photon

Particle Photon Tinker App

I wondered where the Tinker App API was documented?  It turns out that the App is available in Particle library.  You can search by typing “tinker”

The section of code that matters is here.  The function takes a “String” and parses it.  It demands that the 2nd character be a PIN number between 0 and 7.  The first character be a capital “D”.  Then you need to have a “HIGH” (in caps) or a “LOW” (in caps)

/*******************************************************************************
 * Function Name  : tinkerDigitalWrite
 * Description    : Sets the specified pin HIGH or LOW
 * Input          : Pin and value
 * Output         : None.
 * Return         : 1 on success and a negative number on failure
 *******************************************************************************/
int tinkerDigitalWrite(String command)
{
	bool value = 0;
	//convert ascii to integer
	int pinNumber = command.charAt(1) - '0';
	//Sanity check to see if the pin numbers are within limits
	if (pinNumber< 0 || pinNumber >7) return -1;

	if(command.substring(3,7) == "HIGH") value = 1;
	else if(command.substring(3,6) == "LOW") value = 0;
	else return -2;

	if(command.startsWith("D"))
	{
		pinMode(pinNumber, OUTPUT);
		digitalWrite(pinNumber, value);
		return 1;
	}
	else if(command.startsWith("A"))
	{
		pinMode(pinNumber+10, OUTPUT);
		digitalWrite(pinNumber+10, value);
		return 1;
	}
	else return -3;
}

In order to access the digitialwrite function via the network, they publish it (and some others).

/***
 * All the based tinker functions are registered. You can add you own code.
 ***/

// This #include statement was automatically added by the Spark IDE.
#include "Tinker.h"

void setup() {
	//Register all the Tinker functions
	Spark.function("digitalread", tinkerDigitalRead);
	Spark.function("digitalwrite", tinkerDigitalWrite);
	Spark.function("analogread", tinkerAnalogRead);
	Spark.function("analogwrite", tinkerAnalogWrite);
}

void loop() {
}

When I first thought about the Tinker firmware I thought that it must be reasonably complex.  But it is not because it takes advantage of the Particle cloud functionality.  All in all what they did is very elegant and simple..

Now that it looks like my Particle Photon is working, in the next article I will show you WICED firmware to read the CapSense buttons and then Turn On/Off the LED on the Photon.

Particle Photon: Elkhorn Creek Depth

Summary

In the previous article I showed you all of the components of the Particle Photon Ecosystem.  All that is cool.  But what can you build?  I have written extensively about the Elkhorn Creek in my backyard, and the system that I built to monitor the water level.  As part of that series of articles I explained that I have a 4-20ma current loop that turns pressure into water level read here .  In this article I will:

  • Attach the Photon to my Creek System Current Loop
  • Write the Firmware in the Particle Cloud IDE to publish W
  • Send events to the Particle Cloud & monitor
  • Use Webhooks to send the data to ThingSpeak.com

Attach Particle Photon to Creek System

To interface to a 4-20mA current look you just attach it to a 51.1 ohm resistor to serve as a trans-impedence amplifier.  Here is the PSoC Creator schematic for the board:  Using this schematic, the system will generate a voltage between (51.1 Ohms * 4ma = 204.4mV) and (51.1Ohm * 20mA = 1022 mV).   This voltage can then be attached to an Analog To Digital Convertor, then converted digitally into a Pressure, then a water depth.

I decided that the easiest thing to do with the Particle Photon was to attach the pin A0 to the highside input.  This was easy as I put a loop on the Creek Board.  The loop is labeled “PRES”.  The picture is a bit ugly as I was standing in the dark in the rafters of my barn.  Sorry.

Particle Photon attached to Elkhorn Creek Water Level 1.1

Particle Photon Firmware

When you look at the main loop of the firmware, lines 23-40 it does three things

  • Reads the ADC voltage on Pin A0
  • Applies an Infinite Impulse Response Filter (IIR) with coefficients of 7/8 and 1/8.  This is low pass filter.
  • Turns the voltage into depth.  This is done by turning (4-20ma) into (0-15 psi) then PSI into Feet

Then, on lines 34-39, I use the system time to figure out if it is time to publish again.  I publish every “INTERVAL”.

In order to test the Particle Cloud interface to the Photon, I setup all of the intermediate calculation of depth as “Particle.variable”s which allows me to inspect them remotely.

uint32_t nextTime; // when do you want to publish the data again
const uint32_t INTERVAL = (5*60*1000); // every 5 minutes in milliseconds
const double  MVPERCOUNT = (3330.0/4096.0); // 3300mv and 2^12 counts
uint32_t current;
uint32_t filter=0;
double depth;
double percent;
double psi;
double voltage;
double percentTemp;

void setup() {
    nextTime =  millis() + INTERVAL;
    // setup variables so that they can be polled
    Particle.variable("filter",filter);
    Particle.variable("adc",current);
    Particle.variable("percent",percent);
    Particle.variable("voltage",voltage);
    Particle.variable("psi",psi);
    Particle.variable("depth",depth);
}

void loop() {
   
   char buff[128];
   
    current = analogRead(A0);
    filter = ((filter>>3) * 7) + (current>>3); // IIR Filter with 7/8 and 1/8 coeffecients
    voltage  = ((double)filter) * MVPERCOUNT; // Convert ADC to Milivolts
    percent = ( voltage - (51.1*4.0) ) / (51.1 * (20.0-4.0)); // 51.1 ohm resistor... 4-20ma 
    psi = percent * 15.0; // Range of pressure sensor
    depth = psi / 0.53; // Magic 0.53psi per foot

   if(millis() > nextTime)
   {
        sprintf(buff,"%.1f",depth);
        Particle.publish("CreekDepth",buff);
        nextTime = millis() + INTERVAL;
   }
}

Sending Events to the Particle Cloud & Monitor

Once I flashed the firmware with the very cool Over-The-Air Bootloader, I go to the Particle Console and click on my device.  As soon as I do that I see the “Particle.variable”s that I defined in the firmware.  One by one I press “get” and after a second the data is displayed on the screen.  I am not exactly sure how the exactly works, but it is cool.

Particle Cloud Device Console

After inspecting the variables, I go the Logs page and look to see what the events are.  You can see that every 5 minutes (about) there is an event called “CreekDepth” with a -0.0 or so. That is good as it means that the Particle Photon is publishing regularly.  The answer is 0.0 (or about 0.0) as the Elkhorn Creek if not doing anything right now.  The other events are part of the web hook that I setup (and will talk about in the next section).

Particle Cloud Device Event Log

Using WebHooks to send data to ThingSpeak.com

Unless I am missing something, the Particle Cloud does not store your actual data.  They do have a mechanism to take Events from your devices and trigger a “WebHook”.  This is basically a RESTFul API call to another cloud.

Particle Cloud Webhooks

They call these “integrations” and you configure them on the Console.  When you press “Integrations” you end up with this screen which gives you the option of editing a current webhook or creating a new one.

Particle Cloud Integrations

When you click on “new integration” it gives you the option of connecting to Google, Microsoft Azure or Webhook.  I havent tried Google or Azure so for this article Ill stick with a Webhook.

Particle Cloud New Integration

I started with a WebHook to the ThingSpeak Cloud (because they show a nice example in the documentation).  ThingSpeak is run by the MathWorks people (same as Matlab).  They call ThingSpeak “an open IoT with Matlab Analytics”.  OK sounds cool.  In order to use it to collect and display data I start by creating a new account.  Then I click on the “New Channel” button to create an “Elkhorn Creek Depth” channel.  On this screen I say that there will be only one field “CreekDepth”.

ThingSpeak Create New Channel

In order to write data into this channel you need to have the API keys which give your Restful API call the authority to write into the database.  Press “API Keys” and you will see this screen.

ThingSpeak Channel API Keys

Now that I have an active channel (and I know the channel number and API write key) I go back to the Particle Cloud Integrations tab and create a Webhook.

Particle Cloud Edit Integration

Each time the “CreekDepth” event occurs, the Particle Cloud will do an API call to the ThingSpeak cloud and insert the new data.  On the ThingSpeak Cloud there is a chart of the data, and a handy-dandy way to insert the chart into your webpage.  Here it is for the Elkhorn Creek showing the last 6 hours of data which is flat at the time of this writing, but maybe when you read this page it will be raining in Kentucky and you will see something interesting.

I guess at this point I have a number of questions which I will leave to the future:

  • Exactly what is the form of the request made to the ThingSpeak cloud?
  • What is the mapping between the event –> API Request
  • What is the protocol for Particle.variables?
  • How does the Microsoft integration work?
  • How does the Google integration work?
  • How do I save power on the Photon?

I suppose Ill leave these questions to future posts.  If you have other questions leave them as I comment and Ill take a crack at trying to figure them out.

Install AMQP + MQTT + RabbitMQ + Docker + Vagrant + VirtualBox

A couple of weeks ago I told you about teaching the first Cypress Academy WICED WiFi class.  In that class, one of the things that I taught people is how to connect a WICED WiFi devkit to the Amazon AWS IOT Cloud using MQTT (which I am going to will publish here).  At the time I was writing the material I wanted to create a “cloud” server that ran on the LAN for the classroom, but there were too many moving parts for me to attack that.  However, the last couple of days I have had some free time so I have gone through all of the steps to create the first part of the Cypress Academy Cloud.  The cloud will have:

  • An RabbitMQ MQTT server
  • An RabbitMQ AMQP server
  • A COAP server (future)
  • An HTTP server

Each of these four protocols are in common use by IoT devices to transfer data to the cloud as they are all lightweight.

In order to simply things, I wanted to run MQTT and AMQP in Docker containers.  And to make matters a bit more fun, on my laptop I only run test stuff inside of a virtual machine (VirtualBox in this case), never on the bare metal.  In order to facilitate the provisioning of the virtual machine I use a tool called Vagrant which can create and configure a virtual machine from a single configuration file called “Vagrantfile”.

Nicholas, my son, always comes in my office and asks “what are you doing”.  I decided years ago to always do my best to answer this question.  On Tuesday, when he asked the question I started talking and quickly realized that this whole thing was a little bit complicated…. well, actually a lot complicated.  So, I did what I always do, drew a picture:

mqtt-network-pic

The get all of this going I:

  1. Install VirtualBox 5.1 on the Mac (Use the simple Mac installer)
  2. Install Vagrant 1.8.7 on the Mac (Use the simple Mac installer)
  3. Create a “Vagrantfile” (by running “vagrant init”) that:
    1. (line 3) Creates a Ubuntu trusty installation in VirtualBox
    2. (lines 5-7) Forwards ports TCP ports 15672, 1883 and 5672
    3. (line 11) Install emacs (which is the best editor)
    4. (lines 12-20) Installs Docker into the Ubuntu 14.04 (Trusty) virtual machine using instructions from the docker website.  There is a vagrant Ubuntu box based on Precise Pangolin 12.04 but the built in kernel does not seem to work with Docker and it wasn’t worth figuring out why/how to fix it.
      1. (line 21-22) Configures Docker to get the RabbitMQ and Management docker images using instructions from the docker rabbitmq website
        1. (line 23) Creates a Docker container called “rabbitmq” and forwards ports 15672, 1883, and 5672
        2. (line 24) Enables the MQTT Plugin
      2. (line 25)Configures Docker to get the NGINX HTTP container
        1. (line 26) Create and run a docker container with NGINX and forward Port 80

screen-shot-2016-11-25-at-9-51-57-am

The networking aspect of this was a bit tricky to understand when I first went through the process.  Docker and VirtualBox both create private networks for the virtual machines/containers to run in.   In order to get from the native Mac –> Ubuntu VirtualBox –> Docker RabbitMQ container you need to setup port forwarding tables.

To test all of this first prove that the NGIX server is working go to http://127.0.0.1:8000

screen-shot-2016-11-25-at-10-16-19-am

And the RabbitMQ Management Console at http://127.0.0.1:15672

screen-shot-2016-11-25-at-10-16-37-am

And test the MQTT server on port 1883 using MQTTBox

screen-shot-2016-11-25-at-10-17-37-am

RADIUS + Meraki + Beef Brisket

Last weekend was one of those times I felt like jabbing an icepick in my ear.  My “simple” project of cooking a beef brisket turned into a cascading series of pain.  What do brisket and IOT have to do with each other?  Here is the story:  A beef brisket needs to be smoked for no less than 12-15 hours.  This is a total PITA without some computer help as by far the most important variable in doing this right is the temperature of the Pit.  To solve this, I use the Cyber-Q from BBQ Guru.

CyberQ

This little box has

  1. 4x thermocouple based temperature probes (one for the “pit” and 3 for the BBQ)
  2. A Fan controlled by a PID
  3. WIFI with a build-in web server

This box turns your smoker into an IOT device.  What it really means is that you can pay very little attention to your smoker and it will stay within a few degrees of the target.  Which is awesome.  It can also be attached to your network so that you can monitor it from wherever you are (assuming you are willing to poke a hole in your firewall).

On Saturday I get up at 4:00AM to start the Brisket, but when I plug in the Cyber-Q the damn thing won’t attach to my freaking WIFI network.  With this box, this happens to me approximately 50% of the time.  I start and stop it a half a dozen times with the hope that it will attach, but to no avail which causes me nothing but frustration.  The WIFI at my house is protected using WPA2 Personal and all I can figure is that the Microchip WIFI  chipset in the Cyber-q is flaky but I suppose that it could also be the Meraki AP.

To attempt to fix the problem I decide to create an open WIFI network and attach the Cyber-Q to it.  That works fine, but now I have an open network which is mostly OK since I live out in the country, but it is still annoying.  When I created the new SSID I noticed that Meraki allows for MAC based access control using a RADIUS server.

Screen Shot 2016-07-18 at 8.30.07 AM

That is cool now all I have to do is figure out how to build a RADIUS server.  Actually, I need to start by figuring out what RADIUS server is.

It turns out that RADIUS stands for Remote Authentication Dial In User Server.  The “Dial In” part of the name gives you the hint that it has been around for a long time.   Basically a RADIUS server was built to perform three functions, Authentication, Authorization and Accounting in dial up networks.  When someone dialed in the RADIUS server validated the password, gave them access to the network and then kept track of their usage.  Since the days of dial-up, RADIUS servers have undergone the out of control process of creeping functionality and they now support a frightening number of possible setups.

My fist step in this journey was to look around on the internet and find a suitable RADIUS server.  FreeRadius seems to be the most popular tool around and it runs on my mac server.  When I looked on their website, there was no prebuilt version… go fish.  I started the process of getting Free Radius to build, but when I was looking around for a solution to one of the install problem I found “HomeBrew” which claims to be the missing package manager for Mac.  To install Brew you just need to run

/usr/bin/ruby -e "$(curl -fsSL https://raw.githubusercontent.com/Homebrew/install/master/install)"

Screen Shot 2016-07-18 at 10.16.43 AM

After that I can use brew to install FreeRadius using the following command:

brew install freeradius-server

Screen Shot 2016-07-18 at 10.18.56 AM

After running the brew command you will have a built version of FreeRadius in /usr/local/Cellar/freeradius-server/3.0.11

So how does it work?  When a device tries to attach to the network, the Meraki will query the Radius server to see if their is a user/password combination that matches the mac address of the device.  To make this work I just add a username/password to the …/freeradius-server/3.0.11/etc/raddb/users file so that it looks like this:

001ec020425a Cleartext-Password := “001ec020425a”

The “001ec020425a” is just the MAC address of the Cyber-q.

The next step is to tell the Mac OS-X to start the Radius server when it boots.  To do this you need to create  “plist” file with the right stuff in it to make the Launchd start the daemon when the Mac boots.  There is a tutorial on the web here.

The first step is to create a file called org.freeradius.radius-server.plist and put it into the directory /Library/LaunchDaemons.  The file just contains instructions to the launchd to start the radiusd (daemon) when the mac starts.  Here is the file:

<?xml version="1.0" encoding="UTF-8"?>
<!DOCTYPE plist PUBLIC "-//Apple//DTD PLIST 1.0//EN" "http://www.apple.com/DTDs/PropertyList-1.0.dtd">
<plist version="1.0">
<dict>
<key>Label</key>
<string>org.freeradius.radius-server</string>
<key>Program</key>
<string>/usr/local/Cellar/freeradius-server/3.0.11/bin/radiusd</string>
<key>RunAtLoad</key>
<true/>
</dict>
</plist>

After that you need to run:

  • sudo launchctl load org.freeradius.radius-server

Then

  • sudo launchtl start org.freeradius.radius-server

Now that I have a radiusd running I need to tell the Meraki about it.  To do that I change the SSID setup

Screen Shot 2016-07-18 at 10.22.42 AM

There are a few problems with this setup.

  1. The devices that are attached to the open WIFI broadcast in the open
  2. It is easy enough to change the MAC address of device and then hack your way onto the network.
  3. Any broadcast packets from the private network  are broadcast in the open on the WIFI network

But none of these problems are serious enough given that I am in “gun range” of anyone who is within “hacking range.”

The Creek: Meraki Network

I have very mixed emotions about posting a diagram of the network at my house.  On one hand the network is super cool and lets me do all kinds of interesting things so I think a lot of people will be interested in it.  On the other hand giving information that could be used by hackers might not be such a good idea.  I don’t think I am giving away to much crucial information, but I don’t know that to be the case.

OK.  Here it is.  I use a bunch of Meraki networking equipment from Cisco.  Meraki is a cloud managed infrastructure company that was bought by Cisco in 2012.   Cisco seems to position it for smallish companies who need first class networking but don’t have lots of people to support it.  Cisco handles all of the patching, network maintenance, etc. but you still have complete control to do about whatever you want.  In my case, it can do more things that I am capable of doing.

I wanted a network that could:

  • Provide a wide physical area of WiFi coverage (I live out in the country in lots of space)
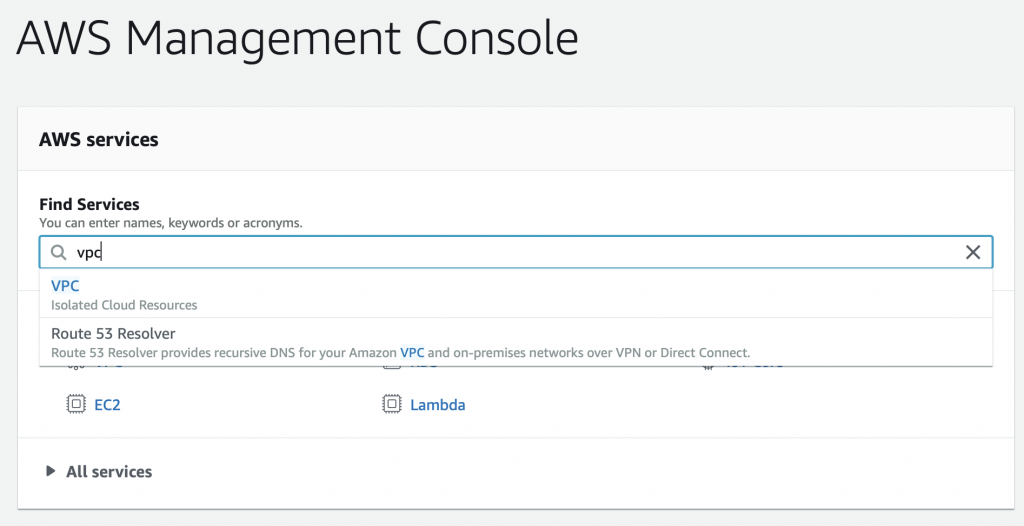
  • Provide private and public WiFi on separate VLANs
  • Wirelessly extend both the WiFi and the ethernet network into the barn
  • Traffic shape all of the networks onto the Internet
  • Manage my children access to the Internet
  • Provide excellent firewall services

I have a close friend who works at Cisco as an Application Engineer who convinced me to choose Meraki.  Overall I am sure that there is a premium that you need to pay, but it works great and is easy to learn and administrate.

First the physical diagram:

meraki-physical-a

The MR60W was designed to be a complete small office solution.  It has

  • 5 ports of 1G ethernet
  • WiFi (Both 5G Hz and 2.4GHz)
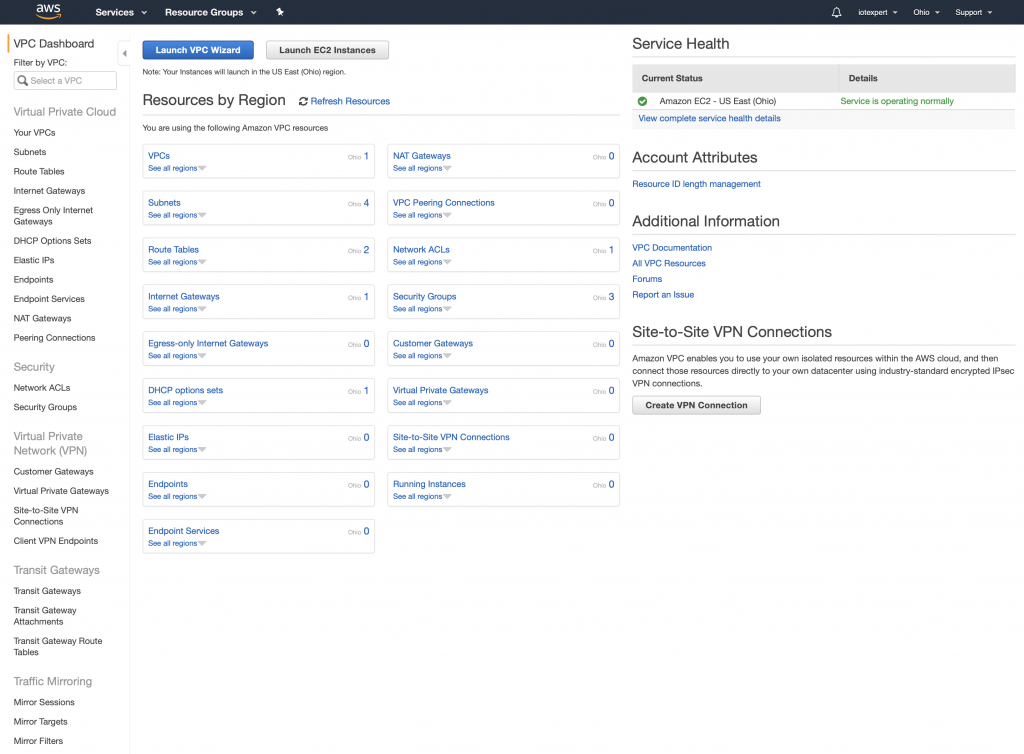
  • Firewall
  • Connection to Internet

The MR60W has been superseded by the MR64W, Cisco appears to have removed the MR60W product landing page from their website or I would have linked to it, but I did find a review here.  They call this the “security appliance” as it is the principal device in securing your network.

The MS22P (which has also been obsoleted) is a 24 port, power-over-ethernet, gigabit ethernet switch.  It supports all of the switching things that I needed to do to have separate VLANs.  This looks like it has been replaced by the MS220-24.  In my office I have several devices that I run on wired ethernet including a couple of MACs, and a 17TB dual ethernet Segate RAID box.

The MR66s are outdoor access points that I use to

  • Bridge between the Barn and my house (they have Yagis)
  • Provide Wifi in the barn and around the back of my house
  • Provide ethernet in the Barn

This is a picture of the access point attached to the side of my porch.  You can see the Yagi antenna on the left.

IMG_2781

This is a picture of the “other end” of the bridge.  The Yagi points towards my house and the other Yagi.

IMG_2783

The MR16 is is a WiFI access point (that has been superseded by the MR18).  It is located in the far corner of my upstairs and provided Wifi for the front part of the house.  It runs off of Power-over-Ethernet (which made it easy to install).

Configuration

When you enter the Meraki control website there are an unbelievable number of configuration and monitoring screens that you have access to.  Here are a few of the menus:

Screen Shot 2016-04-07 at 5.39.04 AM

The “Cients” menu give you this screen where you can monitor the clients that are accessing your network and whitelist or blacklist them.  Notice that I have two unknown people who joined the guest network blocked (probably the neighbors kids).

clients

This menu gives you access to all of the configuration settings of your network including VLANs, Wireless network, DHCP etc.  The system will also allow you to create VPN tunnels between offices.

Screen Shot 2016-04-07 at 5.39.13 AM

Here is the DHCP screen.  You can see that I have a number of “fixed” IP assignment based on ethernet mac addresses.

dhcp

This menu has global settings about your network, for instance the Administrators menu where you can configure everyone who is allowed to log into the management web page.

Screen Shot 2016-04-07 at 5.39.22 AM

This menu allows you to control the switches on your network.

Screen Shot 2016-04-07 at 5.39.52 AM

Here is a screenshot of the MS22P Ethernet Switch:

m22p

This menu allows you to control your wireless networks.

Screen Shot 2016-04-07 at 5.40.00 AM

Here is the screen that shows the status of one of the WiFi Access Points

mwireless

All in all the network works very well.  Send me an email or leave a comment if you have a question.

Git and SSH

Summary

In a previous post I talked about the steps I took to repurpose my old Mac Mini as a server.  In this post I will explain the steps that I went through to make it act as a “Git” server.  Although I am an active github.com user it is sometimes nice to have something stored locally as well.  The easiest (and best) way to make a git server on your network is to use SSH.  In order to make SSH work you need to know about encryption and keys.  I knew in an abstract way about encryption but I hadn’t really dug through how all of the parts operate in detail which I had to do to figure this out.  I will start by explaining the practical mechanics of encryption, and then take you through the rest of the steps to setup and use Git.

  1. Symmetric and Asymmetric Encryption: A Foundation
  2. Setup Git as user on your Server
  3. Create RSA Keys for a User
  4. Give user permission to write into Git User Account
  5. Create a new repository called “repoName”
  6. Using the new repository

Symmetric and Asymmetric Encryption: A Foundation

SSH stands for Secure SHell.   The reason it is called Secure is that it uses an encrypted channel for all communication.  But how can that be?  How do you get a secure channel going?  And what does it mean to have a secure channel?  What is secure?  This could be a very complicated topic as establishing a fundamental mathematical understanding of encryption requires competence in advanced mathematics that is far beyond most everybody on the face of this planet.  It is also beyond what there is room to type in this blog.  It is also far beyond what I have the ability to explain.  But, don’t despair.  The practical aspects of getting this going are actually pretty simple.

First a word of caution.  When you make the changes to your computers/network to make this stuff work, you are playing with fire.  If you are not careful, you will compromise the security of your system.  At this point all of the computer and operating system vendors have spent considerable amounts of time and money making computers safer by installing firewalls and closing security holes.  For as much as they have spent making security, the fucking hackers, the Chinese government and the assholes in US government have put 10x that energy into trying to steal your information.

All encryption does the same thing.  It takes un-encrypted data, combines it with a key, and runs it through an encryption algorithm to produce encrypted data.  You then transmit the encrypted data over the network.  When the other side receives the data it decrypts the encrypted data by combining it with a key, and running the decrypt algorithm.

There are two types of encryption schemes, symmetric and asymmetric.

Symmetric means that both sides use the same key.  That is, the key that you encrypt with is the same as the key you unencrypt with.  Examples of this type of encryption include AES and DES.  This type of encryption is preferred because it is very fast and secure.  However, both sides need to know the key before you can use it.  If you have never talked before how do you get both sides to know the key?  This is a big problem.

Asymmetric, often called Public Key, encryption techniques use two keys that are mathematically related.  The keys are often referred to as the “public” and the “private” keys.  The private key can be used to decrypt data that the public key encrypted and vis versa.  This is super cool because you can give out your public key to everyone, they can encrypt data, then only your private key can be used to decrypt it.  The problem with this encryption technique is that it is slow.

What now?  The most common technique to communicate is to

  • You open an unencrypted connection to a server
  • You give out your public key to the server
  • The server then creates a random symmetric key
  • The server then encrypts its newly created random symmetric key using your public key and sends it back to you
  • You use your private key to decrypt the symmetric key
  • You open a new channel using symmetric key encryption

public-key-exchange

This scheme is completely effective against eavesdropping.  What happens if someone eavesdrops the original public key?  That is OK because they won’t have the “client private key” required to decrypt the symmetric key.  What this scheme doesn’t work against is called man-in-the-middle (MIM).  An MIM attack works by

  • You open an unencrypted connection to a server [but it really turns out that it is a MIM]
  • You send your public key to the MIM
  • The MIM opens a channel to the server
  • The MIM sends its public key to the server
  • The Server encrypts a symmetric key using the MIMs public key and send it back to the MIM
  • The MIM decrypts the symmetric key using its private key
  • The MIM send you the symmetric key encrypted with your public key
  • You unencrypt the MIM symmetric key using your private key
  • Then you open new channel to the MIM using the symmetric key
  • The MIM opens up a channel to the server using the symmetric key

Once the MIM is in the middle it can read all of the traffic.  You are only vulnerable to this attack if the MIM gets in the middle on the first transaction.  After that things are secure.  However, the MIM can easily happen if someone gets control of an intermediate connection point in the network-like e.g. WIFI access point.  The only way to protect against MIM attacks is to have a Certificate Authority (CA).  A CA works by verifying that the Public Key actually belongs to who you think it belongs to by using a cryptographic hash.  If the MIM sends you its public key then you check with the CA and find out that the MIM public key does not belong to the server that you are trying to connect to, then you know that you are being subjected to an MIM attack.  How do you prevent an MIM when talking to a CA?  This is done by building in known valid certificates into your program.   This morning when I looked at the certificates on my Mac there were 179 built in, valid certificates.  This is cool for HTTPS but what about SSH?  With SSH you will need to manually verify the public key of the host you are attaching to.  There is a nice discussion of this topic here.

When you configure your GIT server you will manually copy your public keys onto the GIT server.  This will prevent MIM attacks and will support the establishment of a symmetric encrypted connection.  This is called an out-of-band (OOB) key exchange.  On github this is done with a browser.   For other security systems it could be a USB stick or other scheme.  More on that later.  Now onto the mechanics of making the Git server work.

Setup Git as user on your Server

First you need to enable Remote Login (ssh) from the System Settings –> Sharing.  Make sure that it enabled for All Users

Remote Login

Then you need to turn on the firewall  System Settings –> Security & Privacy

Firewall

Press the “Firewall Option…” turn off the “Block all incoming connections” and then allow Remote Login (SSH)

Firewall Remote Login

Then you need to create a “git” user account.  The account should be a standard account.

Create GIt Account

The next step needs to be done in a terminal window.  You need to have root access (your account need to be authorized as an administrator) to follow these steps.  This will create the place to store the SSH RSA Keys.

command comment
su – git log in a the git user.  You will need to type the password that you set when you setup the git account
mkdir .ssh Create the directory with the public and private secure shell keys
chmod 700 .ssh This directory should only be redable by the git user
cd .ssh
touch "authorized_keys" Create a file that you will add public keys to of the people who are allowed to upload to this server
sudo chpass -s /usr/bin/git-shell git Make the git user so that it can only do git commands.  This is a way to enhance security by not letting the git account do anything other than local git commands.

Create RSA keys for a user

In order for a user to have access to the git account on the server he will need to have RSA Keys.  Specifically, in the ~/.ssh directory of the user you will need two files, id_rsa and id_rsa.pub  These files are the public and the private keys of the user.  When you run the command

  • ssh-keygen -t rsa -b 4096 -C “user@computer”

it will first ask you where to store the keys.  If you already have keys it will give you the option to store them someplace other than the default location.  Then ssh-keygen will ask you for the password to encrypt the private key file.  I don’t use a password on my private key file, but the security would probably be better if I did.  The “-C” option just inserts the text in quotations into the key file as a comment so that when you look at the file you can figure out what the key is associated with.

Screen Shot 2016-03-29 at 7.24.22 AM

You can look at the MD5 signature (which is what github displays) of a public key by running

ssh-keygen -E md5 -lf  id_rsa.pub

Give user permission to write into your Git User Account

In order for a user to be able to access the git server you will need to append his public key to the “~git/.ssh/authorized keys” file.  As I talked about above, in the users home directory you will find a directory called “.ssh”.  In that directory there will be two files, one is called “id_rsa.pub” which is the RSA public key, the other is called “id_rsa” which is called the private key.  You should be very careful to only copy the public key.

  • sudo cat id_rsa.pub >> ~git/.ssh/authorized_keys

In this example both users were on the same computer, but they don’t have to be.  In that case you will need to copy the file some other way (ftp, scp, the browser, …)  Then append it to the ~git/.ssh/authorized_keys file.

Create a new repository called “repoName”

Once you have everything setup with the git user and the SSH RSA keys you will need to create a “bare” repository

  • cd ~git
  • sudo git init –bare repoName.git
  • sudo chown -R git repoName.git

Using your new repository

The last thing to do is to setup git remotes for the new repository.  To do this, on your client machine you can either clone it with

  • git clone git@githost:repoName.git

Or if you have an existing repo you can

  • git remote origin git@githost:repoName.git
  • git push origin master


Other random topics

When I was trying to figure out how all of this worked I found a couple of places (on google) that talked about modifying the file /etc/ssh/sshd_config.  This turned out to be a red herring as the default Mac OS X settings work fine.

When you open a new shell on your client computer, then start your first SSH, the client shell automatically starts a daemon called “ssh-agent”.  This daemon reads all of your key information and caches it.  You can see the information that it is storing by running “ssh-add -l”.  If for some reason you change your rsa keys you will need to either restart the daemon or tell it to read the new keys “ssh-add ~/.ssh/id_rsa”.  You can read more about this in these articles ssh-agent-forwarding and ssh-agent-keys in the github documentation.

If for some reason you are using multiple rsa key files then you need to create a “~/.ssh/config” file to setup which key is used in which situation.  I have this situation because I use github for my personal stuff as well for my iotexpert stuff.   By default ssh uses the keys in “~/.ssh/id_rsa”.  If you need to setup a different key for other hosts you can:

  • Create an ssh name called “github.com” which uses “~/.ssh/id_rsa”
  • Create and ssh name called “iotexpert.github.com” which uses “~/.ssh/id_rsa_iotexpert”

Screen Shot 2016-03-30 at 7.14.13 AM

There is a daemon running called the ssh-agent.  It is used to cache and deliver the keys.  You can see what keys it knows about by running

ssh-add -L

You can delete the cache by running

ssh-add -D

You can add keys to the cache by running

ssh-add ~/.ssh/id_rsa

ssh-add ~/.ssh/id_rsa_iotexpert

To test all of this (with github) you can run

ssh -T git@iotexpert.github.com

or

ssh -T git@github.com

These commands will test the key exchange to make sure that the right key is being mapped to the correct user.

Then to setup the different remotes I do

  • git remote add origin git@github.com/someuser/repository.git to use the id_rsa key
  • git remote add origin git@iotexpert.com:iotexpert/repository.git to use the id_rsa_iotexpert key

The thing that was intensely confusing is “iotexpert.github.com” isn’t actually the name of a computer.  It is just an ALIAS that ssh uses… when SSH runs it looks in the config file and if it sees a “Host” alias that matches what you typed, then it substitutes the value of “HostName” in place of where you gave it “Host”.


Mac Mini –> Mac Server

In 2011, I bought a Mac Mini Server to act as my main desktop.  That computer had 2GBs of RAM and 2 internal 500gb hard drives.  I originally setup that computer as RAID1, meaning that the two drives were in a mirror configuration.  This meant that if one failed that I didn’t loose my data and things kept going.  As I am paranoid about my data I also had a Time Capsule that made regular backups using Time Machine.  I will admit that I am an Apple fan boy.  When I got married in 1992 the asshole photographer misprocessed the film, which resulted in all of the pictures being destroyed.  Since then, I have been really really paranoid so I also backup my backup to the Cloud using Mozy.

In the fall of 2014 I switched to using a MacBook Pro as my main computer, so I moved the Mac Mini onto my kids desk.  And, as computers seem to do, the Mac Mini became slower and slower as more crap was loaded onto it.  Earlier this year I bought them a new Mac Mini and set my old workhorse to the side.   About 6 weeks ago, I decided that I was interested in building a new cloud server and I decided to refurbish the Mac Mini as a server.

I started the process by installing two 8 GB SIMMs which I bought from MacSales.com because they have really excellent tutorials on their website.  16GB made a huge difference in the performance of the machine.  The install process is pretty simple.  The Mac just has a cover which twists off giving access to the two SIMM slots.  Here is the video tutorial that they provide

https://player.vimeo.com/video/139638226?title=0&byline=0&portrait=0

I then reinstalled the OS, which was a total pain in the neck.  At some point in the last couple of years Apple stopped delivering an operating system DVD, moreover I wanted to make a clean install of the most recent version of the operating system and I wanted a backup.  I found the instructions for creating a USB stick on Apples website.  The problem was I didnt have the directory /Application/Install OS X El Capitan.app.  Now what?  After a bunch of google and false starts I figured out that you have to download it from the Appstore, even if you already have it installed on your computer.

To create a USB stick with the most recent Mac OS you need to take the following steps.

  • Get the installation for Mac OSX  from the App Store
    • Press “download”
    • When the installation screen starts, use the menu to quit.  If you don’t do this it will try to install the OS on your computer.

PastedGraphic-2

  • Insert a USB stick and start a terminal
    • run the command “sudo /Applications/Install\ OS\ X\ El\ Capitan.app/Contents/Resources/createinstallmedia –volume /Volumes/MacOSX/ –applicationpath /Applications/Install\ OS\ X\ El\ Capitan.app/”
    • The “/Volumes/…” is the path to the USB stick.  You can figure that out using the command “df”
    • When you run the “sudo …” it will ask you for your password, it will then erase the “/Volumes/…”  Make SURE that you don’t erase your hard disk by picking the wrong directory
    • I had an old USB stick and it took a very long time (about an hour) to make the copy

To emphasize, if you don’t quit the installer it will remove the installation directory from the “/Applications/Install…” folder and you will not be able to create the media.

If you don’t want to do this you can use DiskMaker which provides a GUI that does exactly the same thing.  You can find it at http://diskmakerx.com

The next step is to reboot your Mac from the USB Stick.  To do this, reboot and press the “Option” key to start the “Startup Manager”.   I found an Apple Knowledge Base Article with a list of all of the startup commands here.  After the computer reboots run the “disk utility” program to reformat the hard disks.  When I ran the disk utility I found that one of my hard disks was dead.  I guess that it was a good thing that I was running RAID.  I decided to run on just one disk as this computer was going to be used only for testing, so I picked the good disk to reformat and went for it.  After the disk was formatted I quit the disk utility and then continued the Mac OS installation.

With all of that done I found it remarkable how much faster the computer was.   Night and day difference.

Fast forward several weeks.  My experiments with cloud services were turning more serious (there will be a bunch of posts on this topic).  This set me to worrying about the good disk going bad, which would be annoying, but I suppose, not a horrible problem as I had the belt-and-suspenders-setup.  It seemed like installing two SSDs in RAID would make another leap in performance.  So, I went back to macsales.com and bought a pair of 1TB SSDs, the toolkit to install them, and an external USB 3.0 drive enclosure so that I could read data off of the one good drive.  Doing the installation was quite complicated and took me the better part of two hours.  On the macsales.com website there is an outstanding video of the process.

https://player.vimeo.com/video/139637589?title=0&byline=0&portrait=0

After I got the drives installed the next step was to get RAID1 going again.  Unfortunately, Apple in their infinite wisdom has discontinued support for RAID in the diskutility program.  In order to get the RAID working you need to run diskutility from the command line.  To do that:

  1. Reboot the Mac while holding down the option key with your USB stick installed.  If you are using a PC keyboard on your mini then you are out of luck.  Specifically, there is no option key on a PC keyboard and the only way I could get the option to be held down was to use an old Mac keyboard that I had laying around.
  2. When the Install OS screen comes up run the “Utilities -> Terminal”
  3. In the command window run “diskutil appleraid create mirror MyHardDisk JFHS+ disk0 disk1”  This will create a new volume called “MyHardDisk” that is RAID1 (aka Mirror).  Be aware that this ERASES your hard disks so be careful.  There were several discussions I found on this topic on the internet including this one.

For me the last step was to restore my image from the time capsule.  To do that I

  1. Rebooted the Mac and held down the “Command-R” which starts an internet recovery.  I had to do this because my hard disk doesn’t have a recovery partition
  2. Select recover from Time Capsule

There are two troublesome things about what I have done.

  1. Apple seems to be discontinuing their support for RAID which makes me question how good an idea it is to run.  There doesn’t seems to be any support infrastructure so Im not sure how I would know if there was a problem
  2. The first MacOS USB drive I made worked to install the OS.  The second one did not.  After I compared them, the second one was missing a file called “.IAProductInfo”.  I copied that file from the first to the second drive and things started working.  When I googled around I found a couple of references to this problem.  I have no idea why the second install didnt have the .IAProductInfo.

If you have an answer, or an opinion about either of these topics then please email me or leave a comment.

In future posts I will talk about installing VMware, PHP and a bunch of other tools.