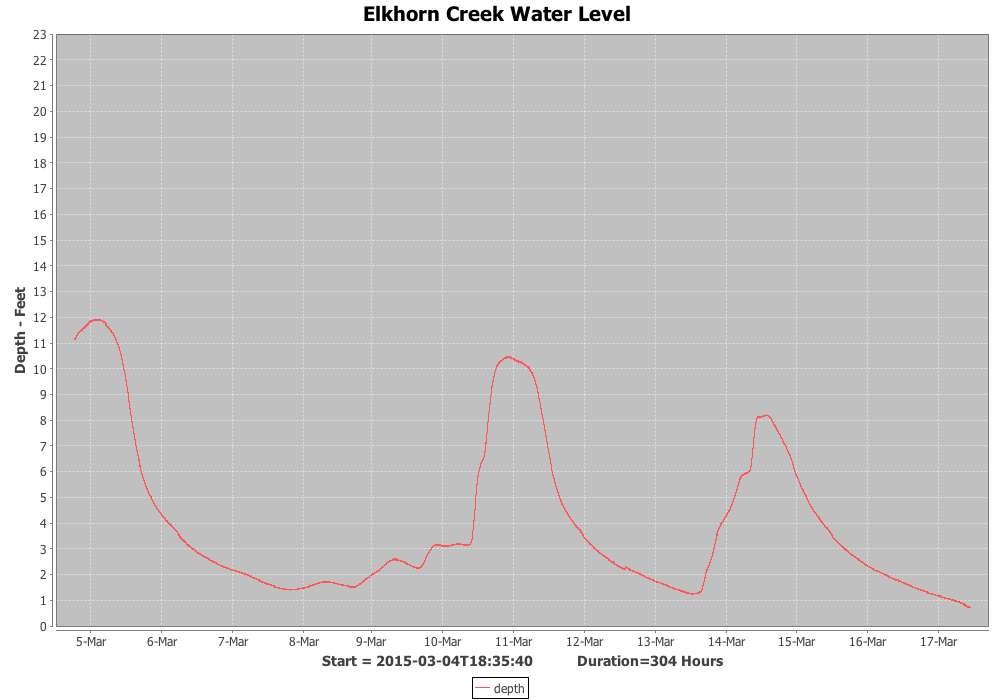
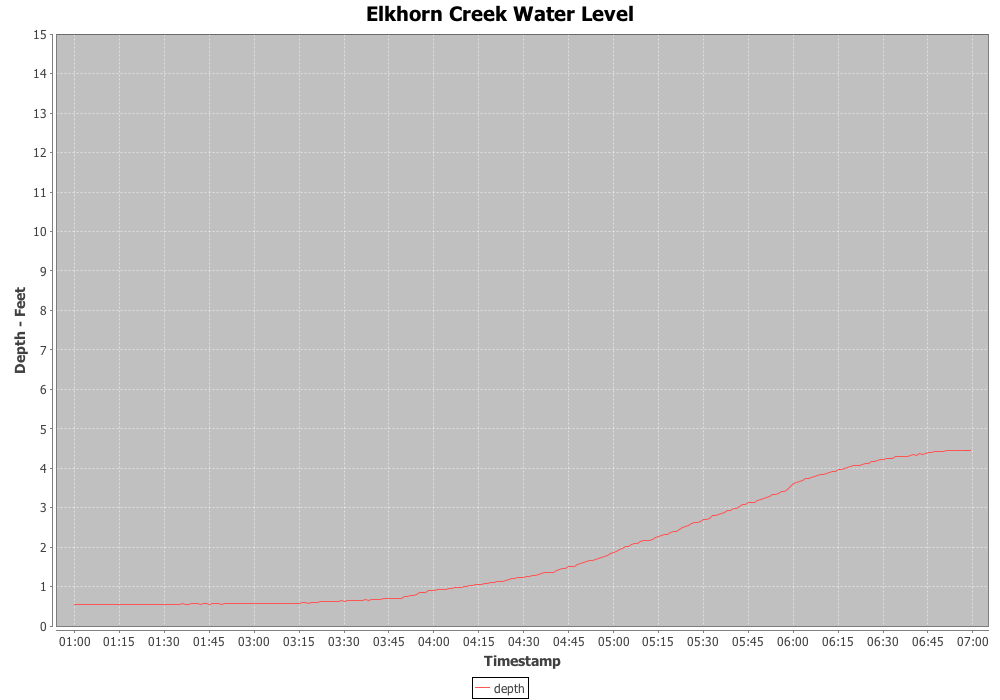
In the previous post I talked about scanning through the Elkhorn Creek MySql database and finding flood events. This is a very IO intensive task and as such is slower than crap. It takes something like 20 seconds on the Raspberry Pi and as such is not very ideal for an interactive application. So to make this better, I will create code that runs once per minute and then creates the “floods.html” with all a table of all of the floods and links to the charts. It will also recreate the chart for any flood event that is in the database but doesn’t have a chart.
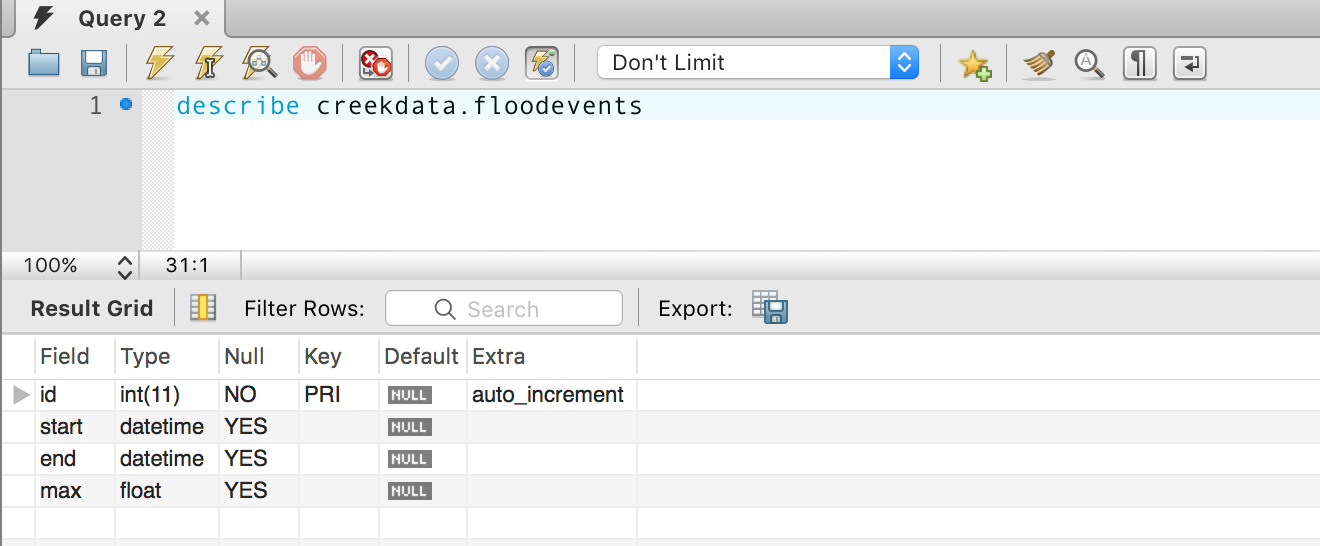
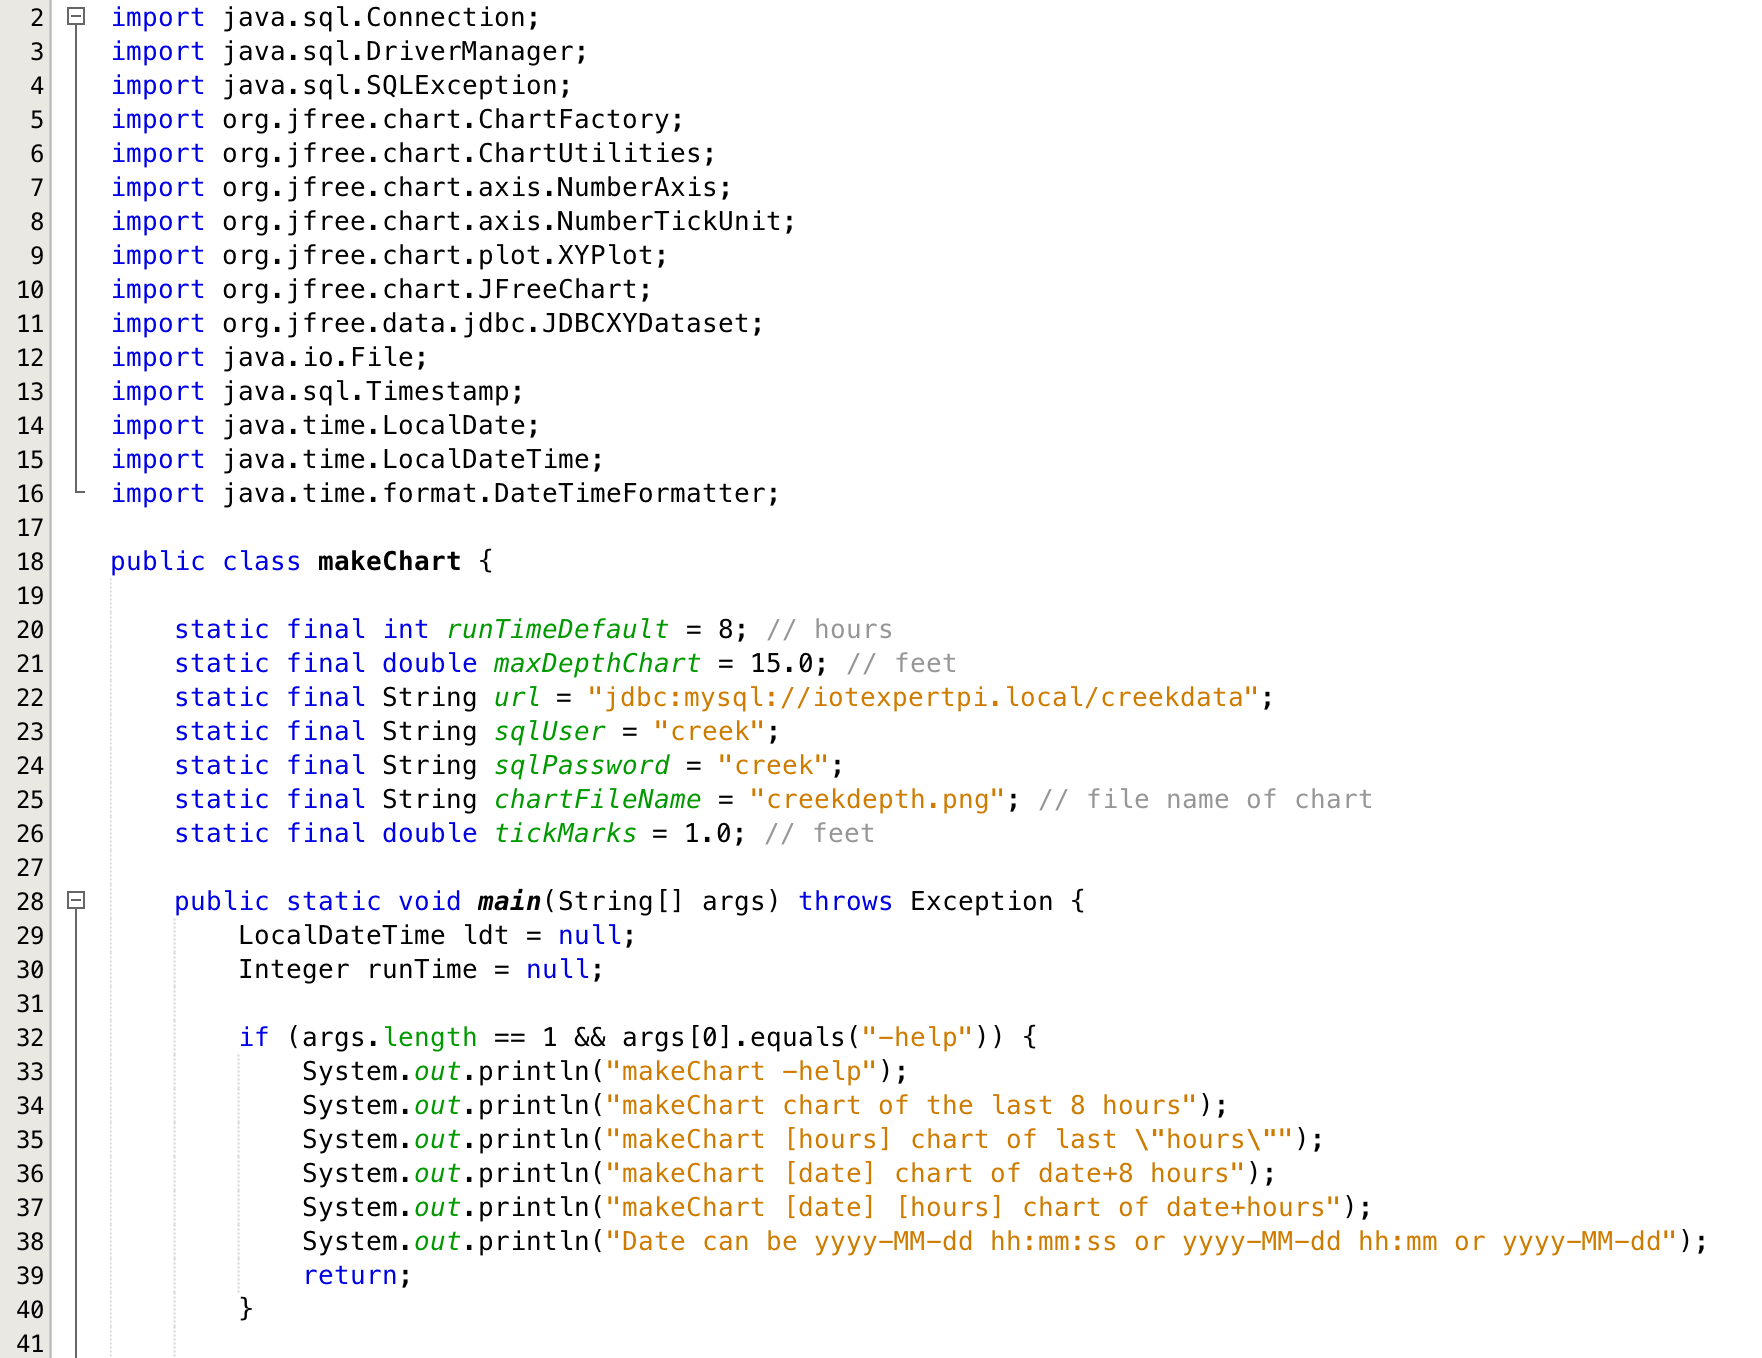
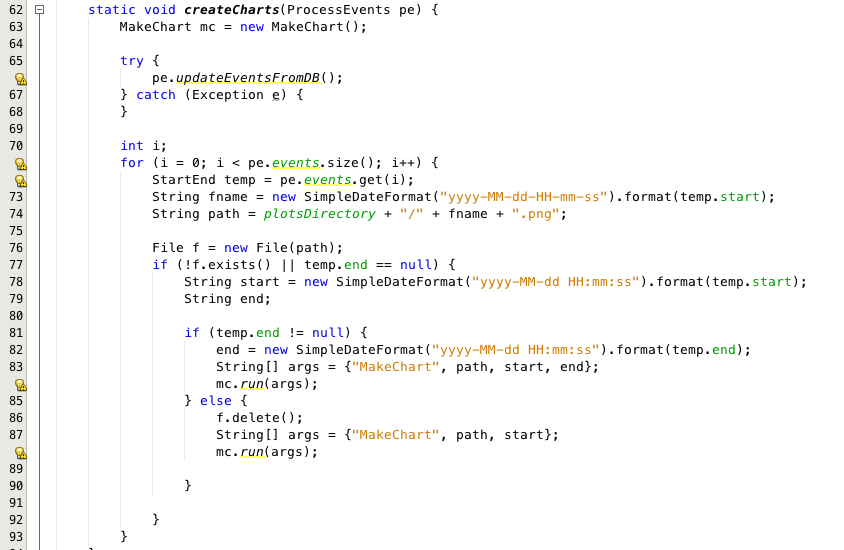
After the “ProcessEvents” run method has done its thing, there is a table in the database called “floodevents” that will have columns for the start,end and maxdepth of all of the floods. To make things easy I would like a directory full of PNG files with the charts of the floods. Each PNG file will contain one flood event and be named by the date of the flood. To do this I create a function called “createCharts” that will:
- [Line 71] Iterate through the list of events
- [Lines ] Create a string that represents the filename
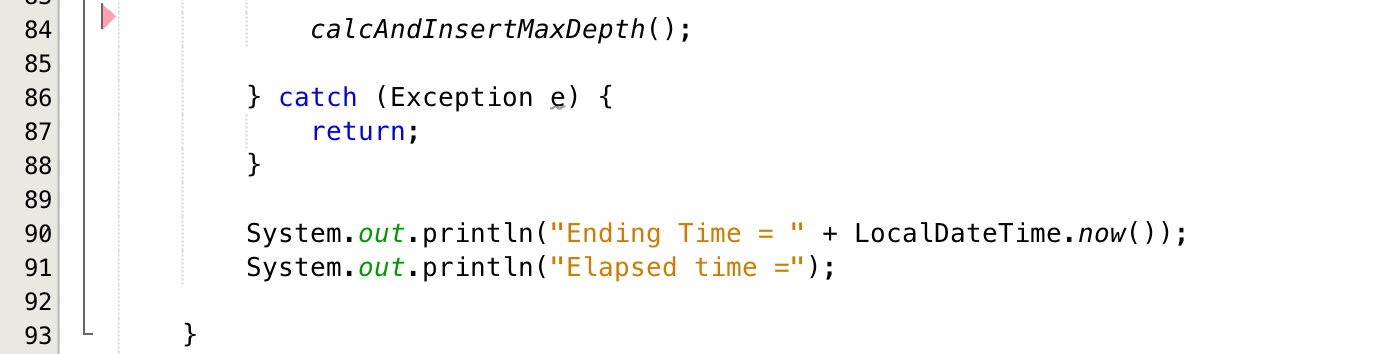
- [lines] If that filename doesn’t exist (for some reason it was never created or it was deleted) or the flood isn’t over (and the chart needs to be redrawn) then:
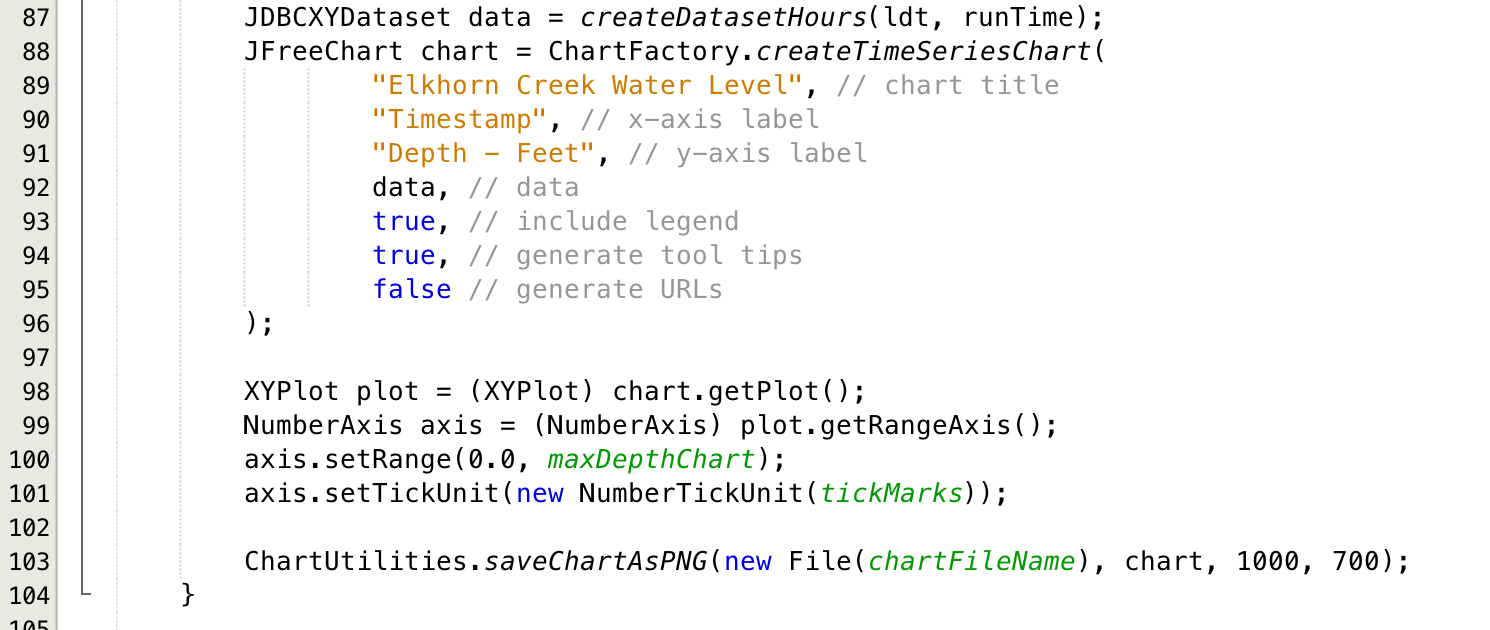
- [Lines 77-88] Create the chart of the flood
After this function has been run, there will be a directory full of charts. I can then copy this directory to the Tomcat web apps directory
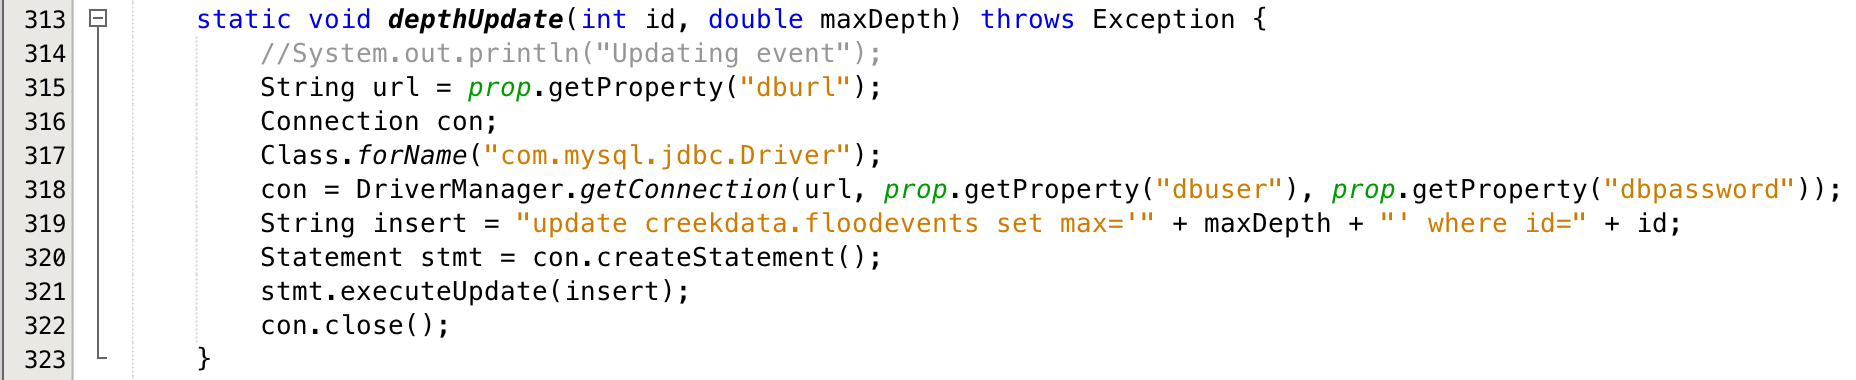
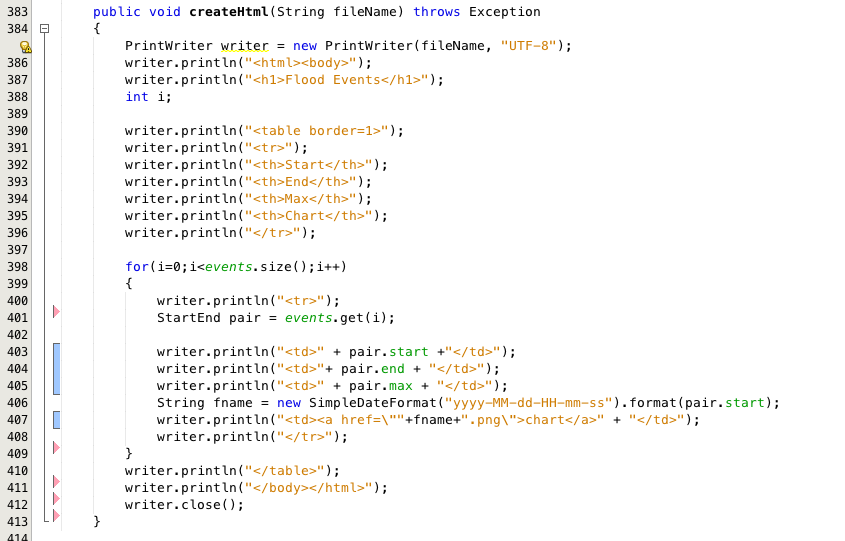
As long as you know all of the floods, and you have created PNGs of the flood events you might as well also create and cache the HTML of the flood events. This is simply done in the ProcessEvents object with the method “createHtml”. This method take a filename that will be the name of the HTML table file, then creates an HTML table, iterates through each of the events printing one row per flood event.
As always you can get of all this code on the IOT Expert github site.
Index
Description
The Creek: IOT for the Elkhorn Creek
Introduction
The Creek: Solution Architecture 1.0
Overall architecture
The Creek: Creek Board 1.1
Eagle layout of the board
The Creek: Creek Board 1.0 – RCCA
A discussion of the errors in the 1.0 board
The Creek: CYPI, a Raspberry Pi to Arduino Bridge
PSoC4 <--> Raspberry Pi Bridge Board
The Creek: PSoC4 Creator Schematic and Firmware
Firmware to interface with the temperature and pressure sensors
The Creek: Testing the Firmware
Using tools to verify that the PSoC 4 Firmware is working correctly
The Creek: Testing the Bootloader
Make sure that you can load new firmware into the PSoC
The Creek: Software Architecture
All of the Raspberry Pi software connections
The Creek: Install MySql
Instruction to configure MySql
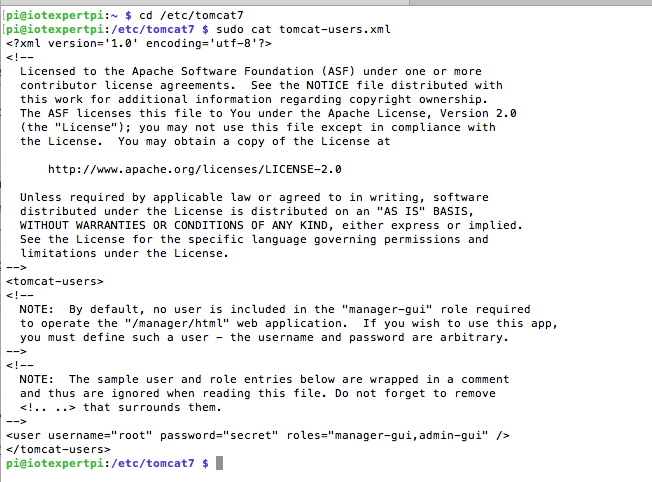
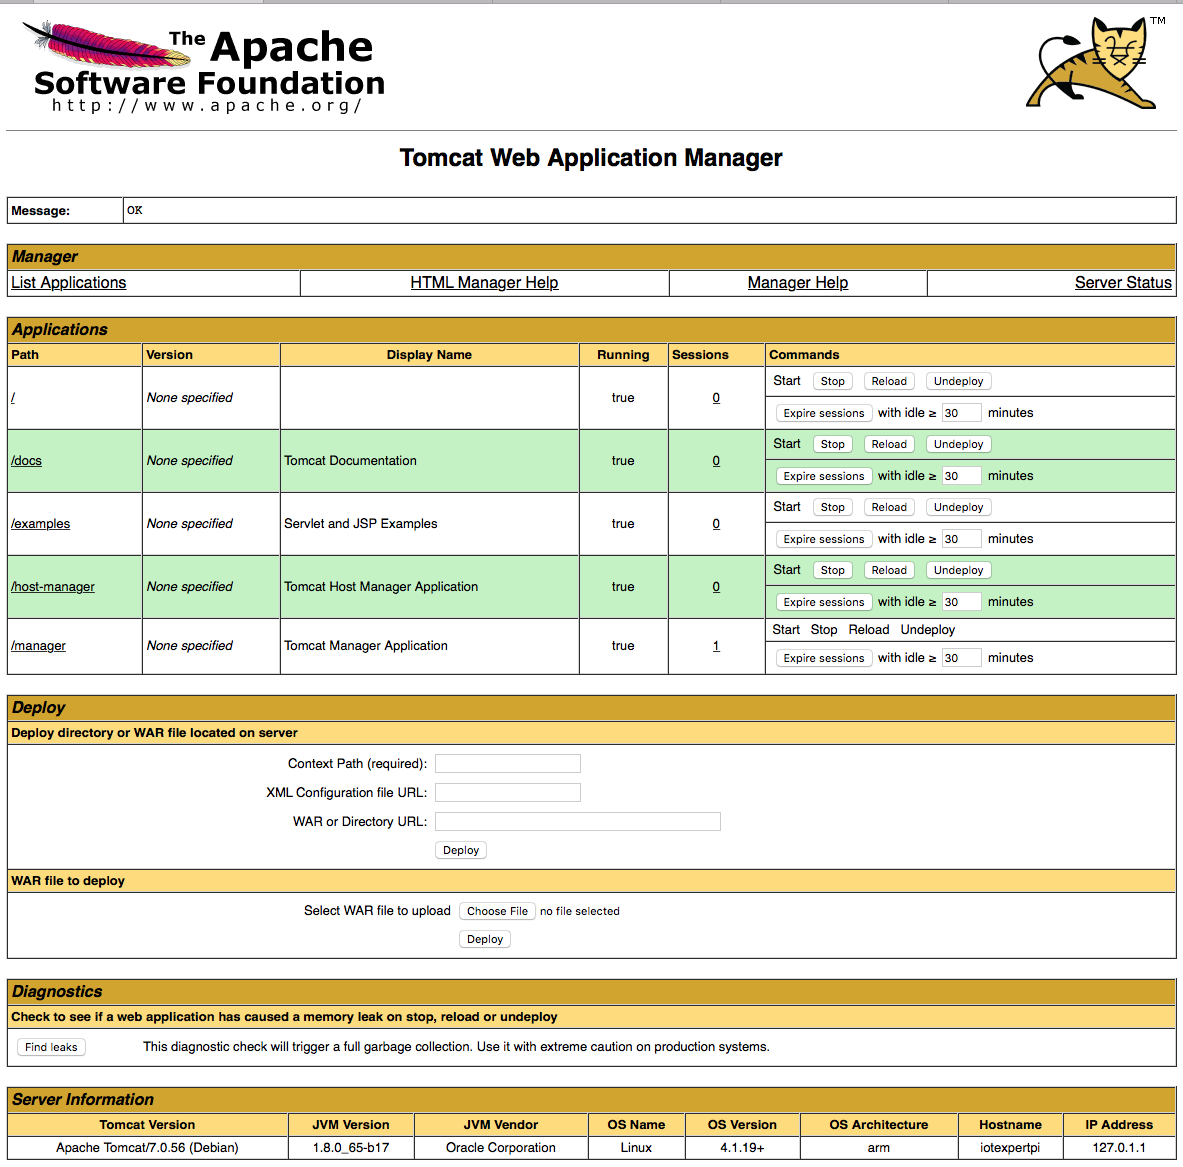
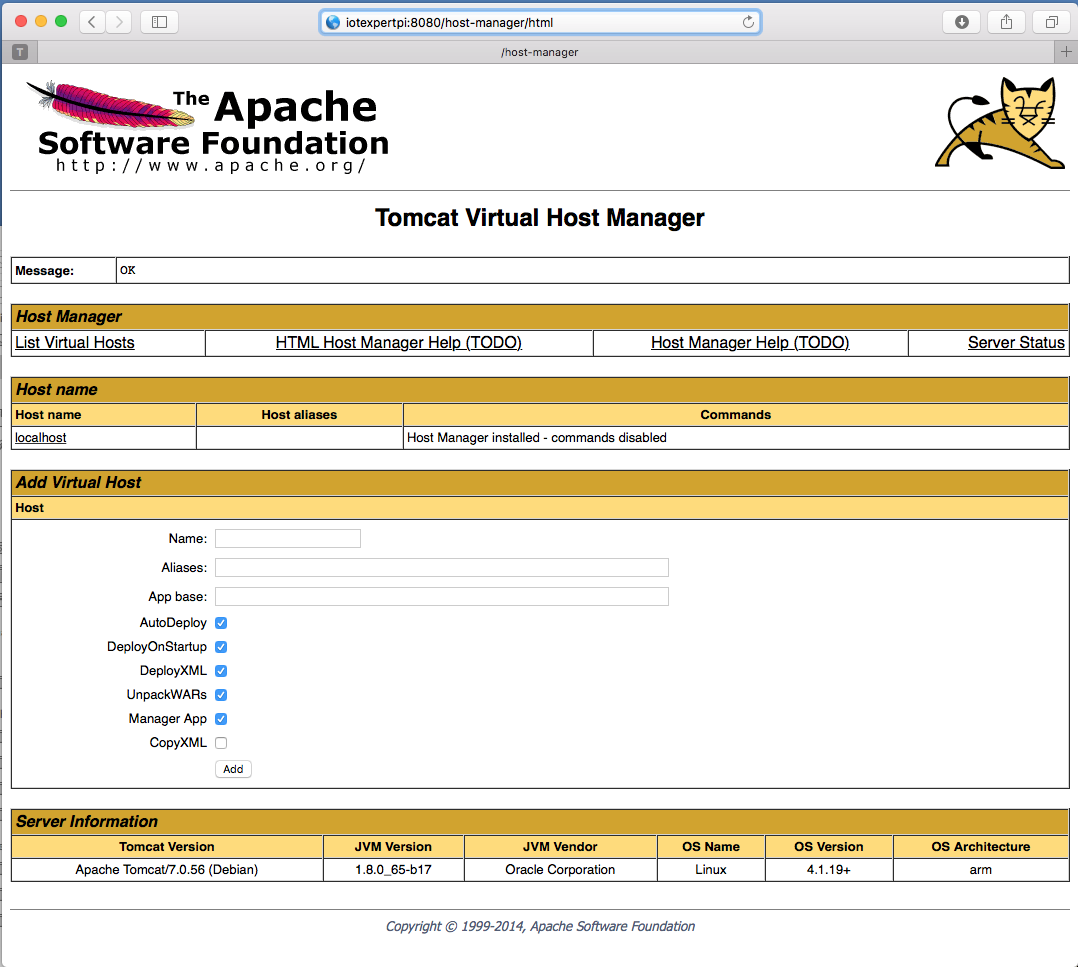
The Creek: Install Tomcat
Instruction to configure Tomcat JSP Server
The Creek: Data Collection Java (Part 1)
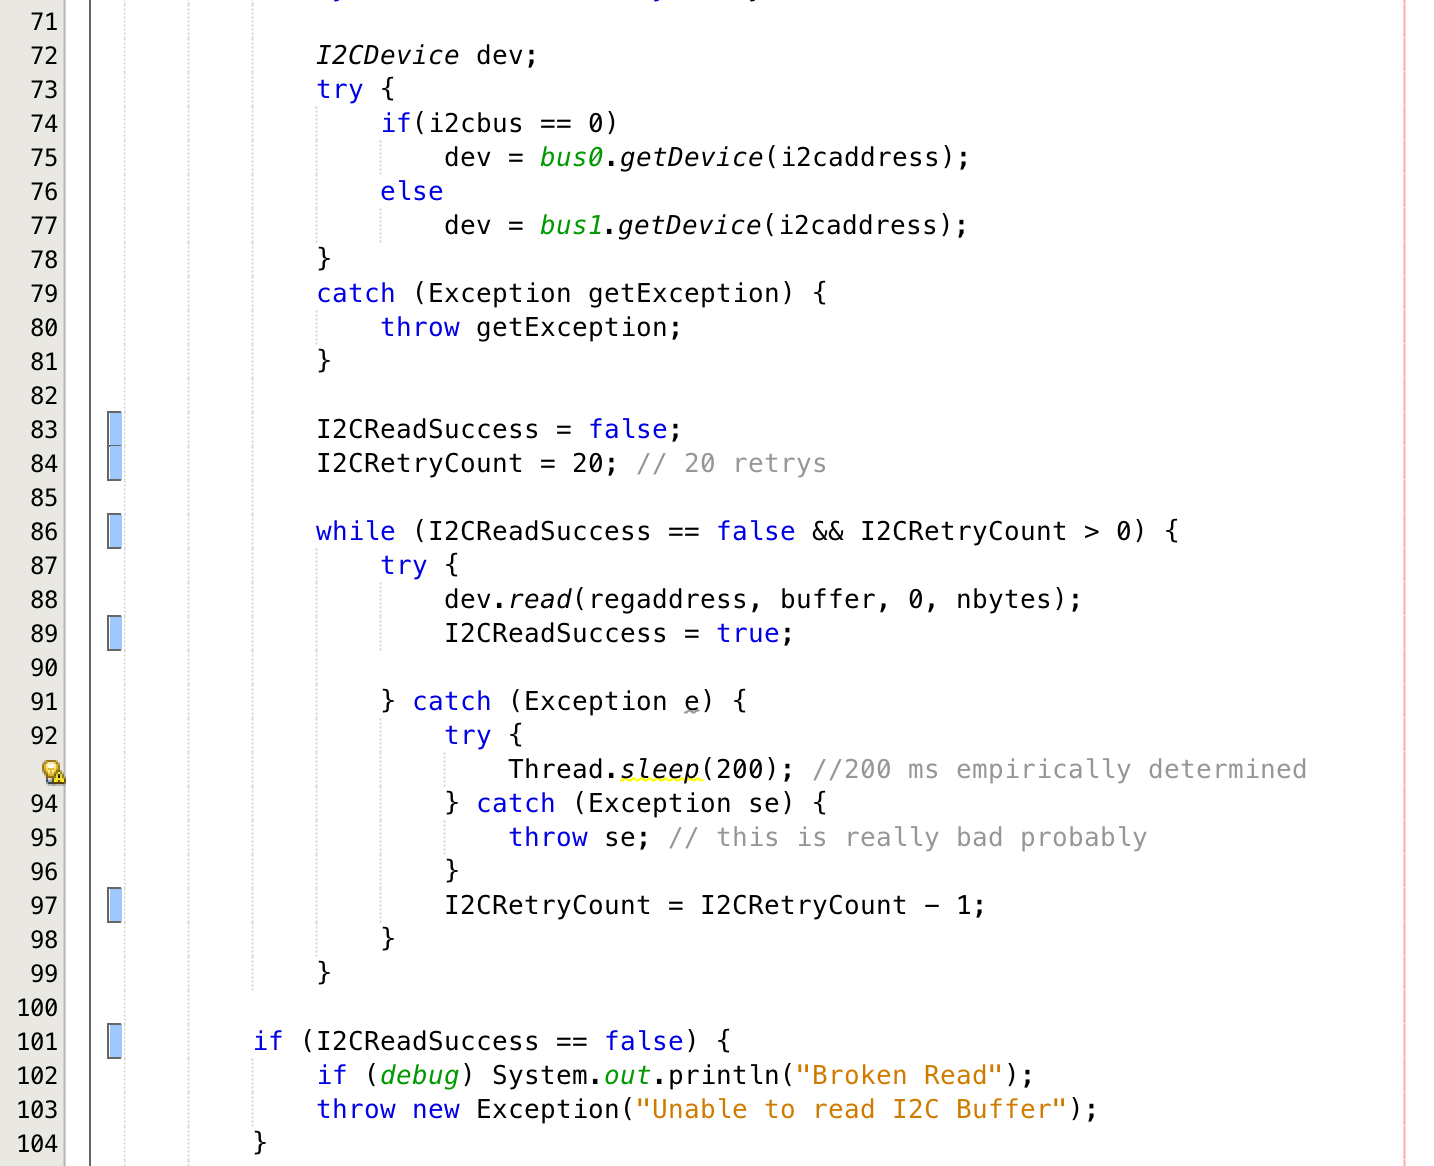
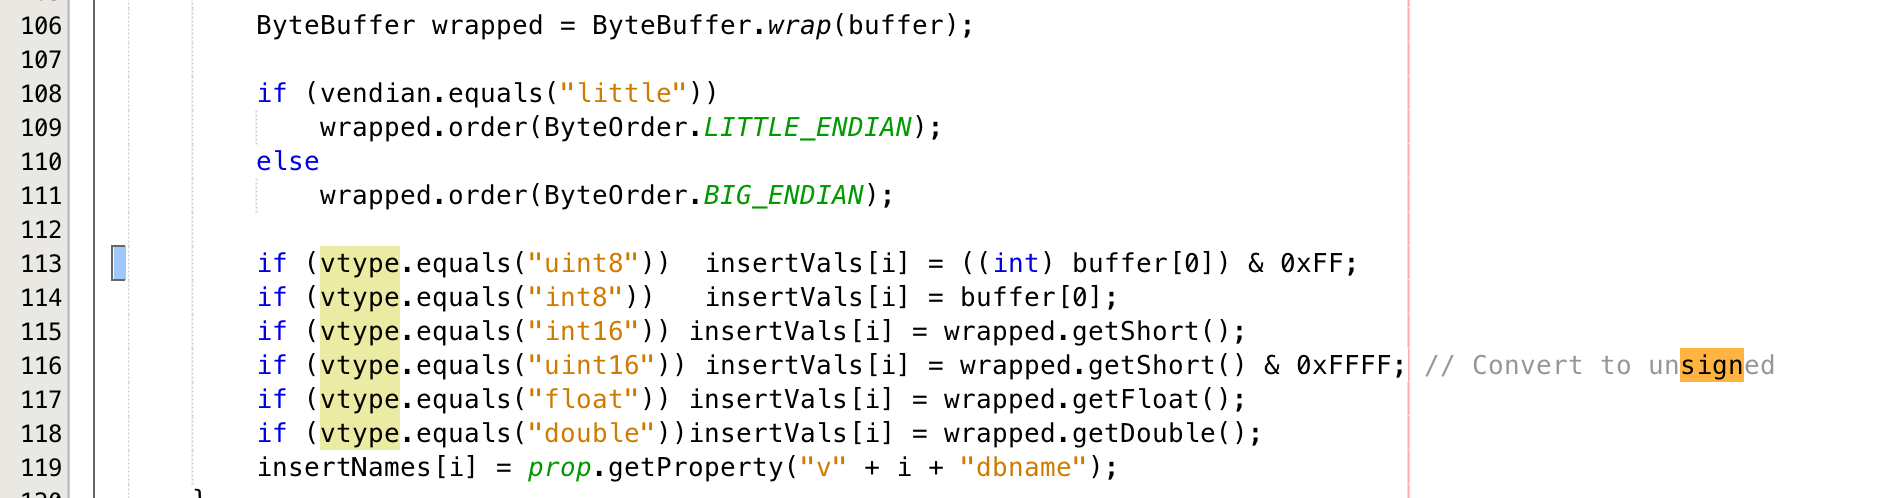
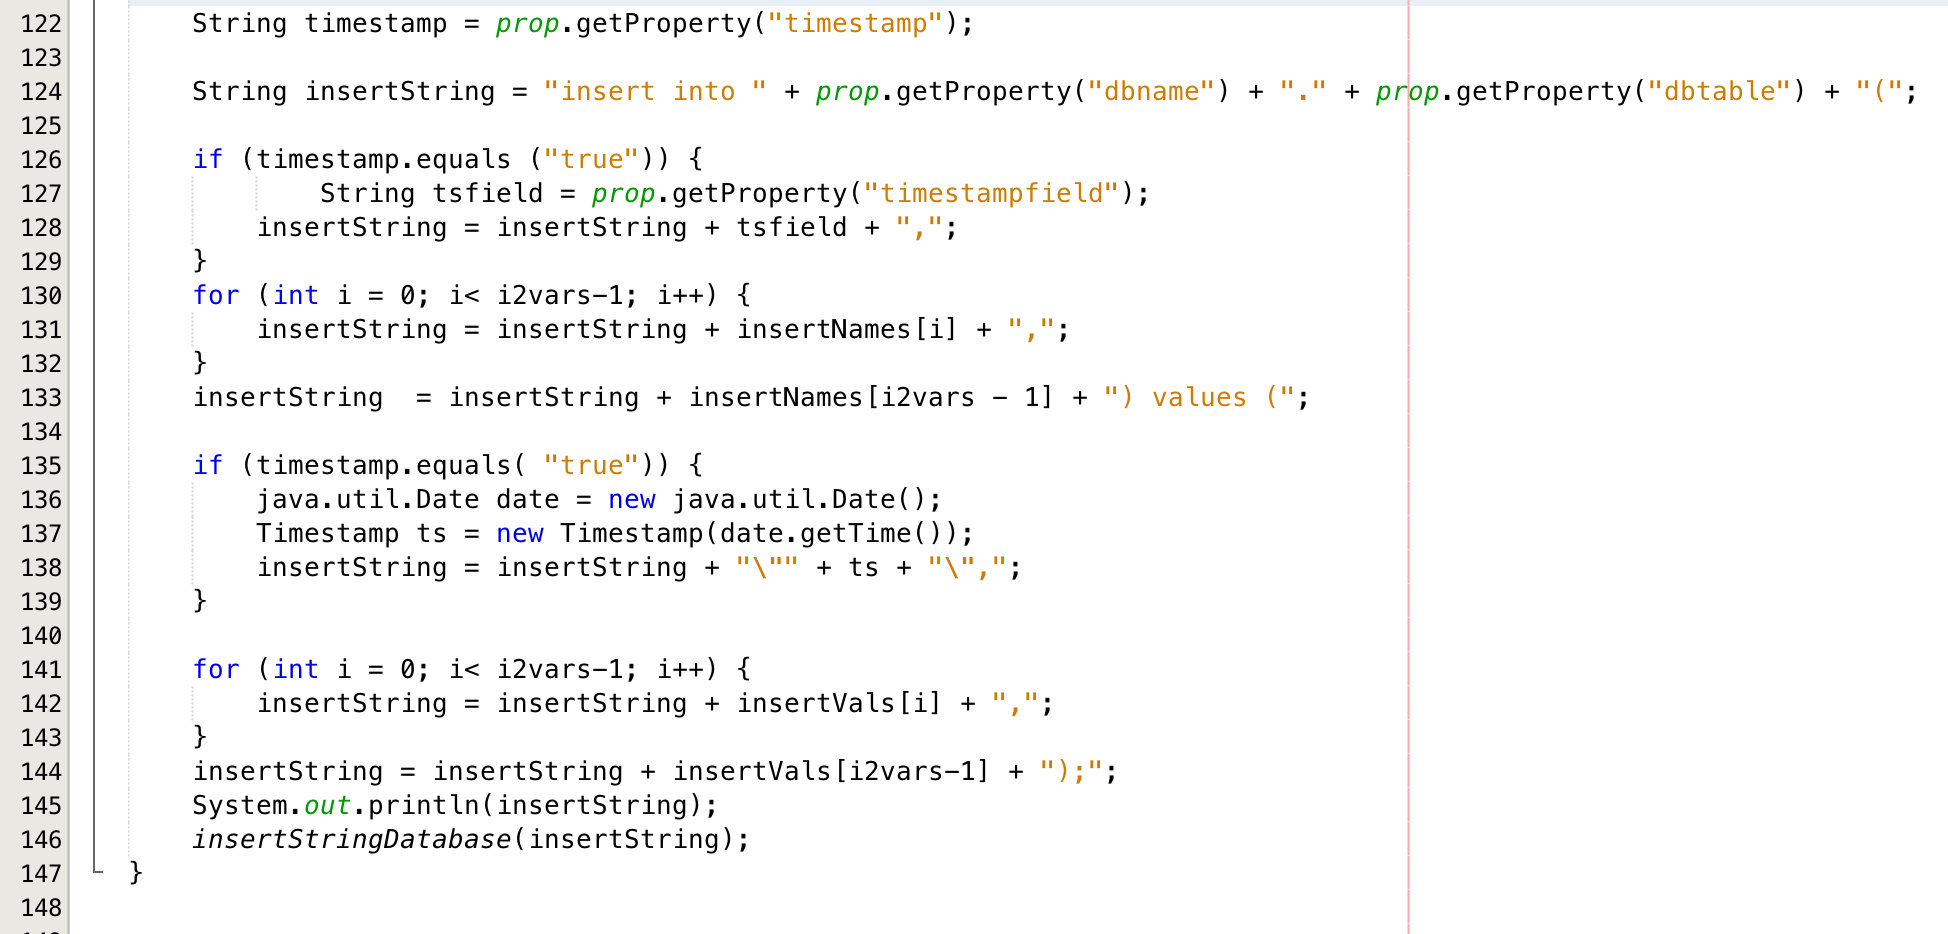
The Java program that reads the I2C and saves it in the database
The Creek: Data Collection Java (Part 2)
The Java program that reads the I2C and saves it in the database
The Creek: Create the Chart with JFreeChart
Using open source Java charting software to create plots of the Creek Depth
The Creek: Flood Event Data Processor
A batch program to create analyze the database and create a table of flood events
The Creek: Flood Event Web Page
A batch program to create the flood event web page
The Creek: Creek Server 1.1
Updates to all of the back off server programs to integrate charts
The Creek: JSP Web Page for www.elkhorn-creek.org
The JSP program to make the table and display the website
The Creek: Raspberry Pi Clock Stretching
Sorting out a bug in the system having to do with the Broadcomm Raspberry Pi Master not functioning well with clock stretching
The Creek: Creek Server 1.2
Caching the web pages to make them faster