Summary
A discussion of a new series of articles about using the PSoC 6 + 43XXXX Wifi/Bluetooth combo chips to implement a data collection system for the Tilt2 Hydrometer. Even if you aren’t specifically interested in hydrometers, this is a general purpose discussion of the design of an IoT device.
Story
In the middle of the Covid lockdown my 21-year-old daughter suggested that we start brewing beer. This was always something that I have been interested in so I said “Sure!”. What does this have to do with IoT you might ask? I am an engineer and I love data. Two of the key pieces of data that you are interested in while fermenting beer are:
- The gravity of the beer
- The temperature of the beer
If you don’t know anything about brewing beer, it is simple (people have been doing it a long time… even with no IoT)
- Start with grain
- Mill the grain
- Heat the grain with water to turn it into sugar water (called wort)
- Add yeast
- Wait while the yeast converts the sugar in the wort into alcohol and carbon dioxide
- Bottle the beer (or keg)
- Drink
Back to the metrics. The “specific gravity” or just “gravity” is just the ratio of the density of your solution to plain water. This is an indication of sugar in the wort solution. At the start of the fermentation you will have “lots” of sugar, and no alcohol. By the end you will have “lots” of alcohol and not much sugar. You can tell how things are going by monitoring the gravity of the beer, which is a proxy metric for how much sugar has been converted to alcohol.
There are two common ways to measure the gravity:
- A float hydrometer – sugar water is denser then water, so a “float” will float lower in the solution as the sugar gets converted to alcohol.
- A refractometer – the index of refraction of the solution changes as the sugar concentration changes (this is an amazing old-school technology
As I was learning about this whole process I found the tilt hydrometer. This device has
- A Bluetooth MCU (u-blox BMD-300)
- An I2C accelerometer (NXP MMA8451Q)
- An I2C temperature sensor (Microchip MCP9808)
- Enclosed in a sealed plastic tube of known volume and weight (known density)
As the gravity of the beer changes, the device floats at a different angle (because it floats lower/higher). They use the accelerometer to measure the apparent angle of gravity to calculate the angle of the device. This angle is then used to calculate the density of the solution it is floating in. They then broadcast the calculated gravity and temperature in Apple Bluetooth iBeacon format.
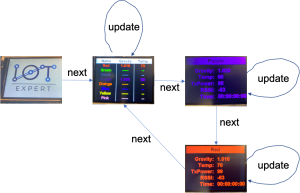
When I saw this, I thought “perfect” I know what to do with that. I should build a device that can collect all of the data, display it, save it to an SPI flash and put it into the cloud. It should look something like this: (each Tilt is identified by 1 of 8 colors… pink in this case).
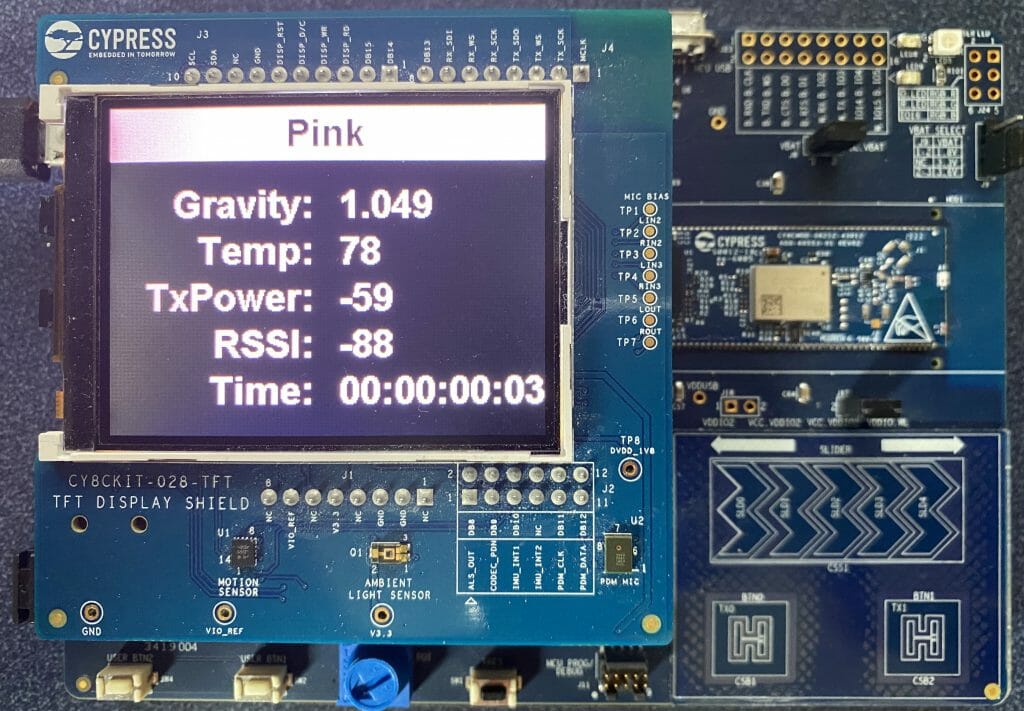
Yes, I know they have an iPhone app, but I want to build a single device that sits in my brewery all of the time. And yes I know they have a Raspberry Pi app, but that isn’t the point.
My device will have the following characteristics:
A Display with:
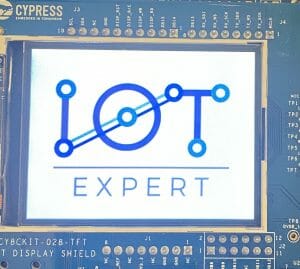
- A Splash Screen
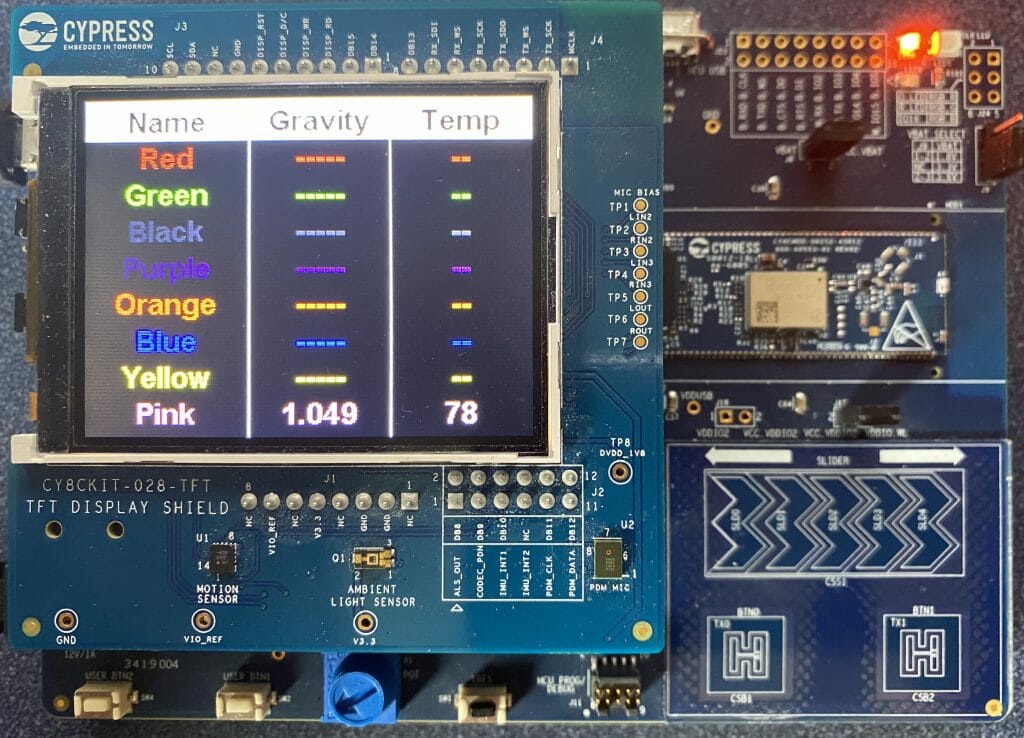
- A Table of all Tilts, Gravity and Temperature
- Single: One screen per tilt with the specific data including debugging
- Single: A graph of the active data for one specific tilt
- Single: A table of all of the recordings from that specific tilt
- The WiFi Status
- The Bluetooth Status
Bluetooth System that can:
- Record tilt data as broadcast in iBeacon advertising packets
- Repeat tilt data (maybe)
- Introducer WiFi (probably)
CapSense button GUI to:
- Next Screen
- Auto Mode
- Reset current
- Dump recorded data to the SD Card
Command Line
- A UART based command line to debug & learn
USB
- Mass Storage to see files
- USB <-> UART Bridge
Power Supply via USB Port
- Plug in Type-C using Cypress BCR
WiFi
- MQTT Publish to AWS
- NTP – to find the time
- Local webserver
- MDNS
RTC
- Keep Track of current Time
SPI NOR Flash
- Record the data
SD CARD
- Dump the fixed SPI Flash recordings to a removable SD CARD & remove data from the SPI Flash
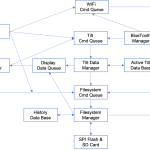
Here is another picture of what I am thinking (well actually what I implemented for this series of articles)
Un-boxing
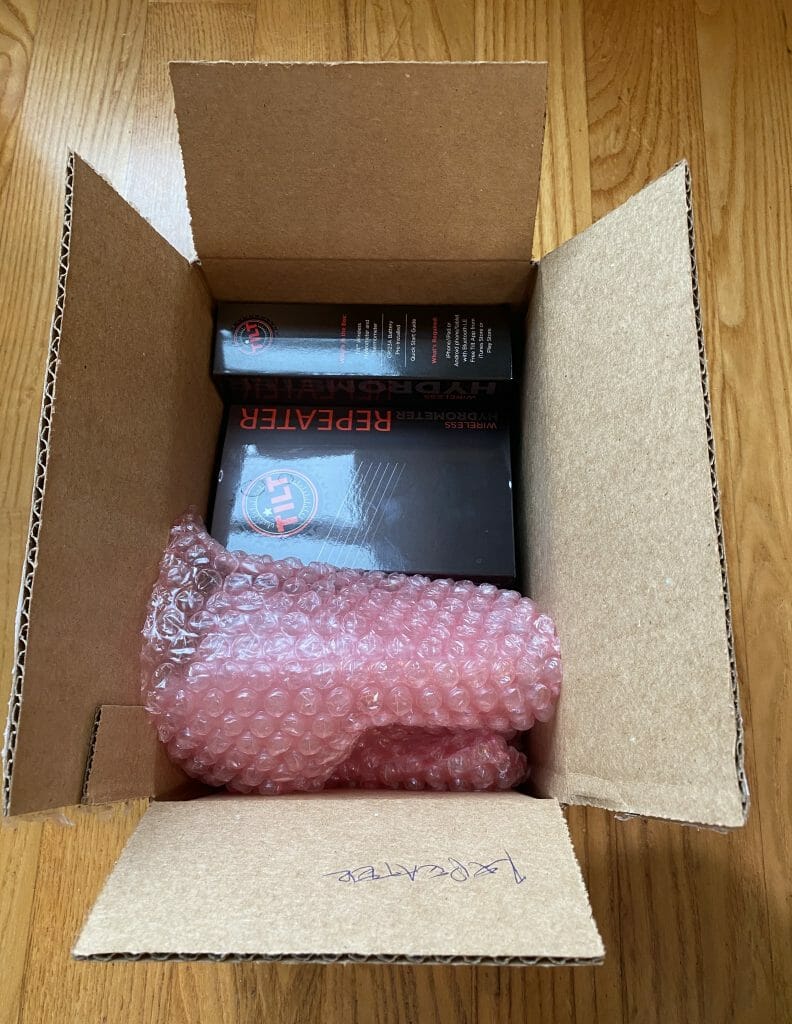
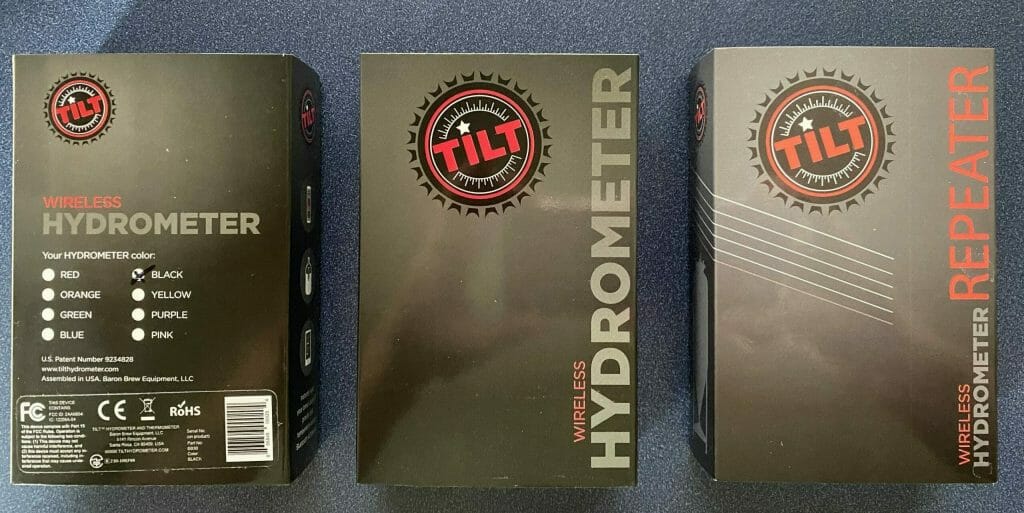
To get this show on the road, I ordered three tilts and two repeaters from Baron Brew Equipment.
![]()
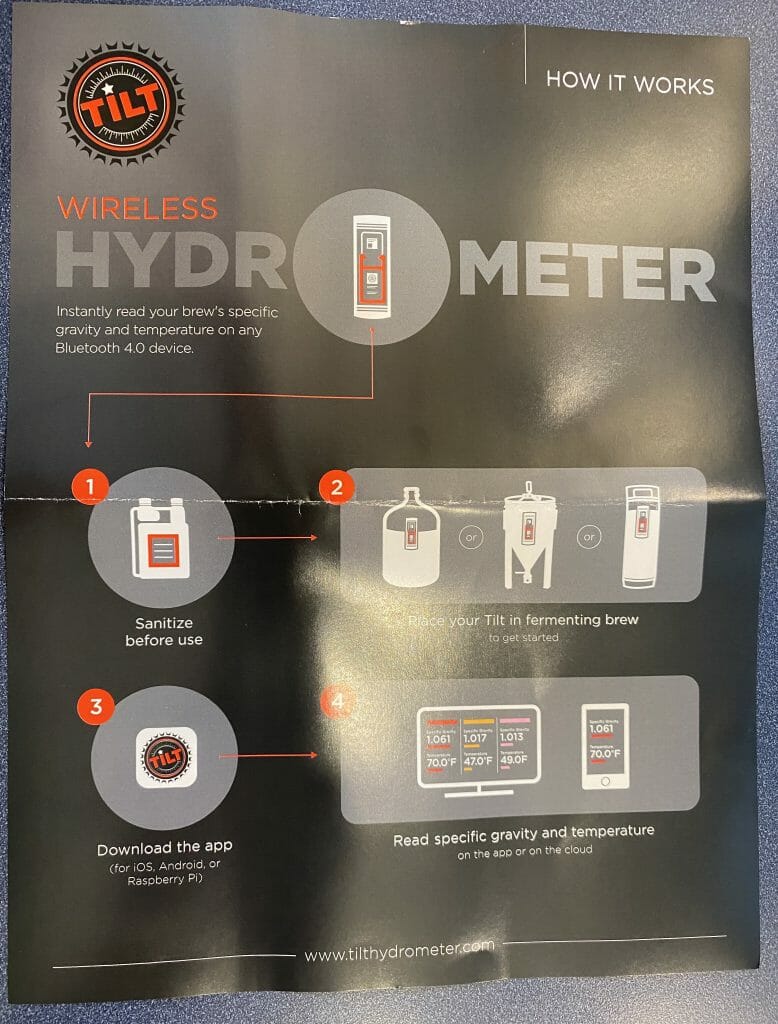
It included a neat little quick start picture showing how to get going.
Then the box of goodies.
There are 8-possible tilts, Red, Green, Orange, Blue, Black, Yellow, Purpose and Pink (each Tilt his “hardcoded” to identify itself as a specific color)
Tilt Hydrometer
Here is a picture of the “blue” one (notice I put the wrong box in the picture)
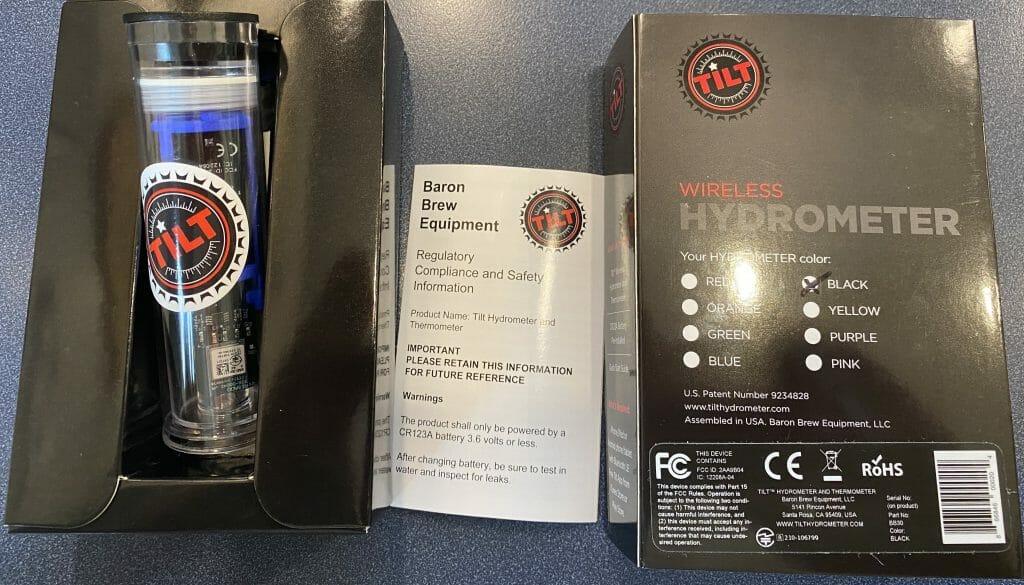
The tilt comes in a plastic tube. Which has a label to remind you to take it out of the tube (my experience is that you should be embarrassed to have to read most warning labels 🙂 )
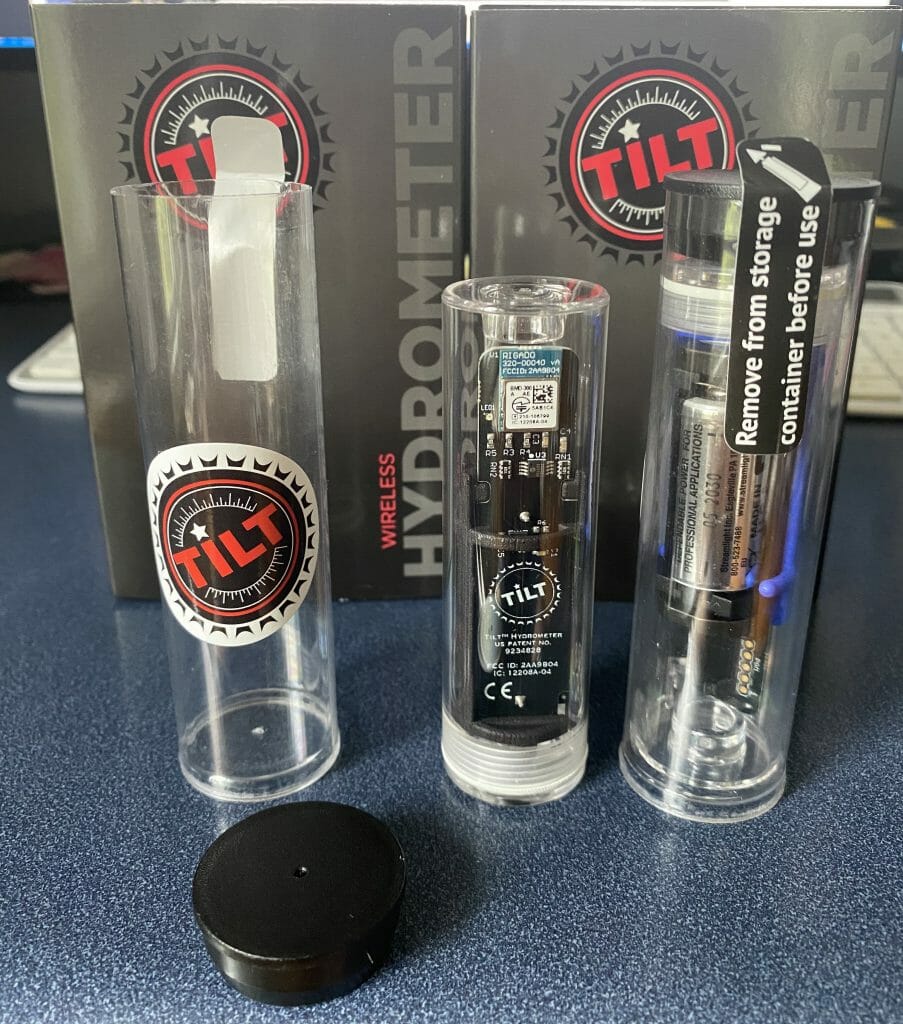
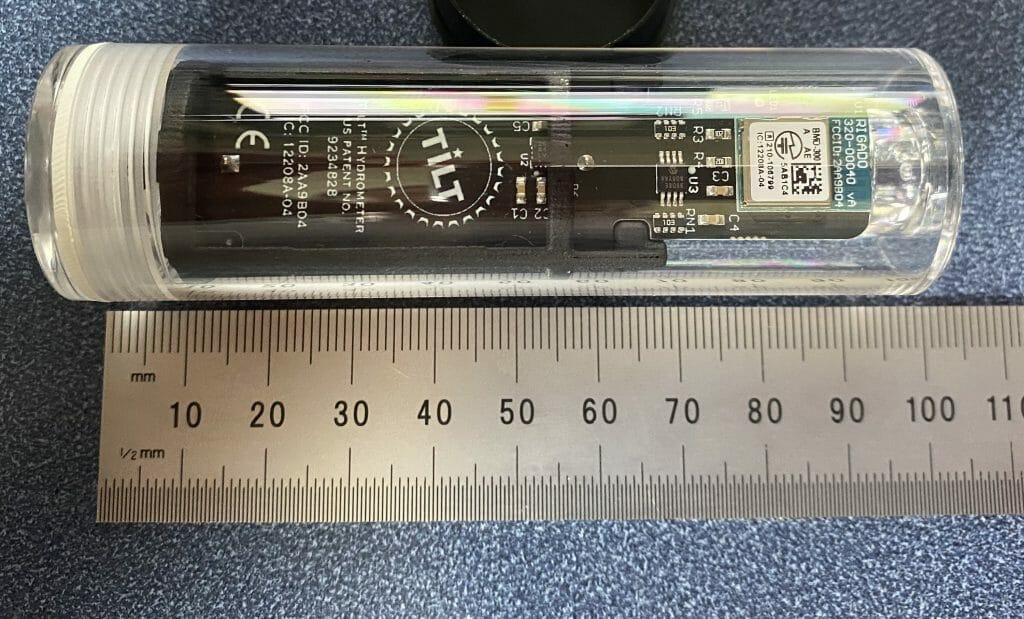
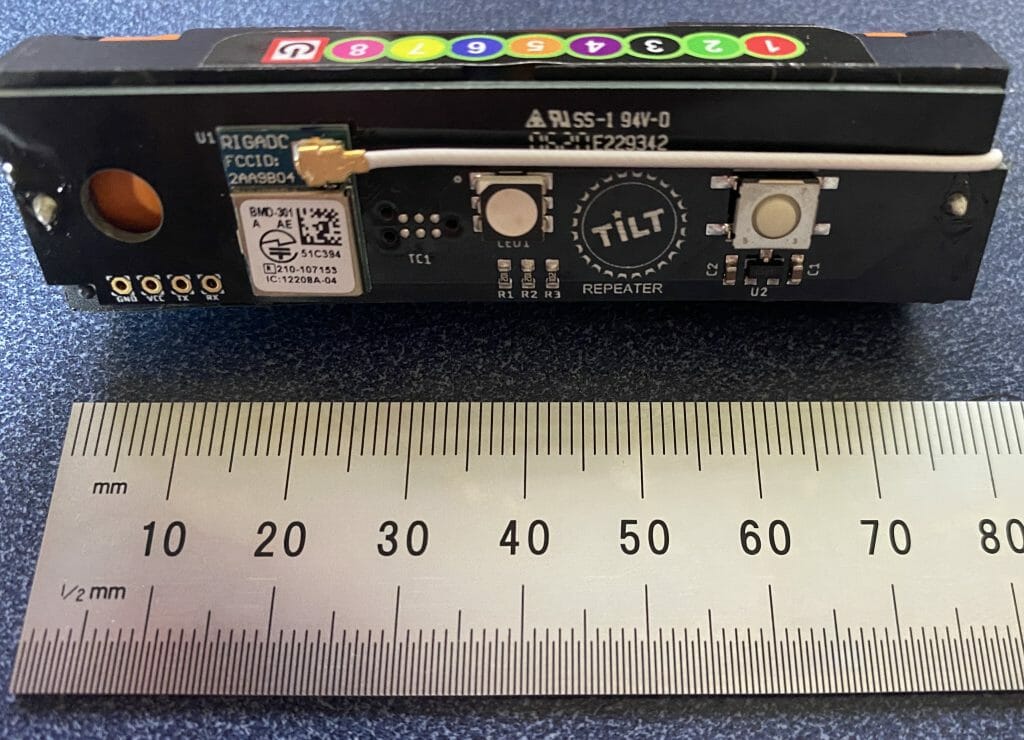
It is about 100mm long (about 4 inches). The bluetooth module is at the top, U3 is the temperature sensor and U2 (which is under the black 3-d printed plastic) is the accelerometer.
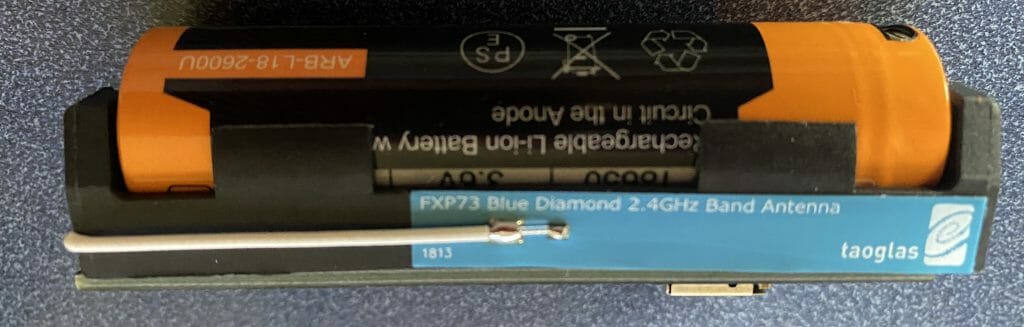
Repeater
If you put a Bluetooth device floating in a bunch of beer, surrounded by a metal fermentation container, you will not be able to hear the Bluetooth signal. To solve this problem the Tilt people made a repeater which can rest on the top of the fermenter. It listens for the weak signal, then rebroadcasts with a higher gain antenna.
Here is a picture of the repeater. Notice that it uses the BMD-301 which has an external SMA antenna.
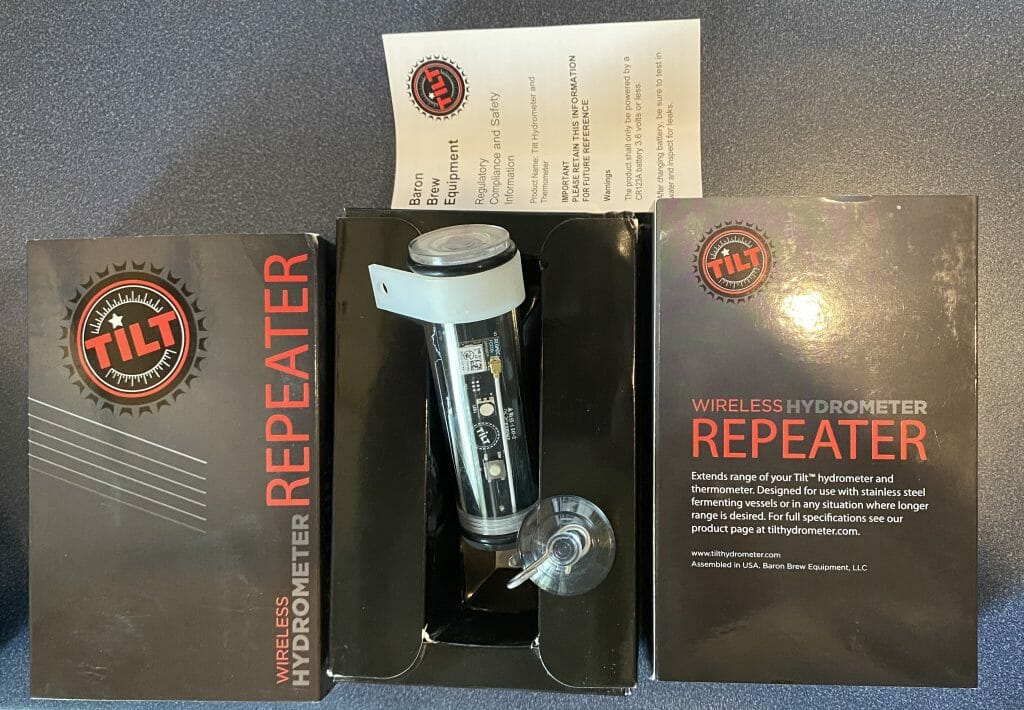
It also comes in a nice plastic tube.
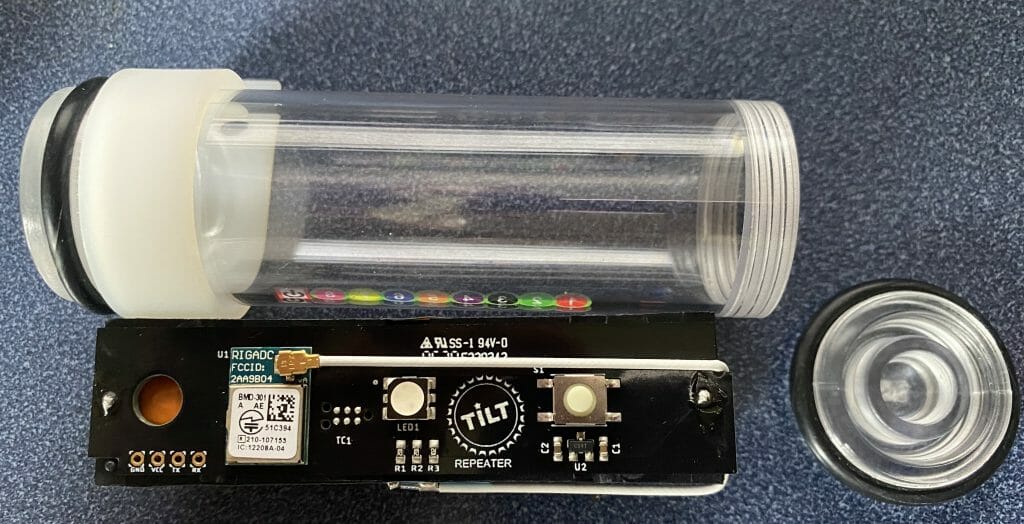
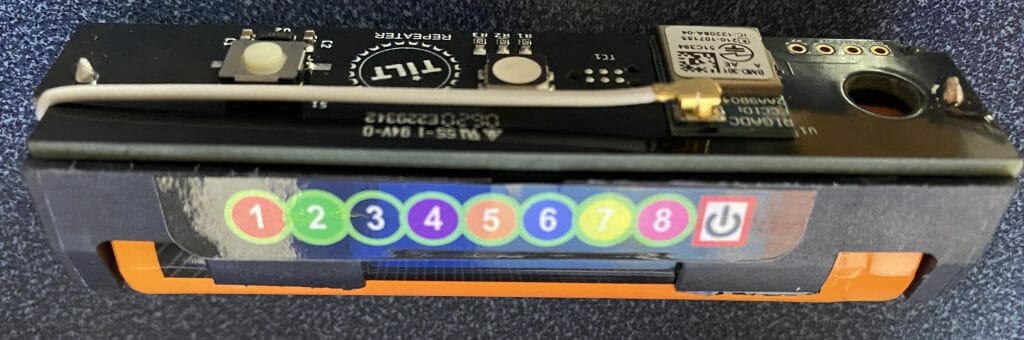
The repeater can only re-broadcast one color at a time. The button to switches between the 8 colors and off.
Each time you press the button the 3-color LED lights up with the color that represents which tilt color that it is repeating. Red->Green->… Pink->Off
It also has a huge rechargeable battery.
The Plan
Here is a list of the articles that I plan to write
This series is broken up into the following 12 articles with a few additional possible articles.
Tilt Hydrometer (Part 1) Overview & Out-of-Box
Tilt Hydrometer (Part 2) Architecture
Tilt Hydrometer (Part 3) Advertising Scanner
Tilt Hydrometer (Part 4) Advertising Packet Error?
Tilt Hydrometer (Part 5) Tilt Simulator & Multi Advertising iBeacons
Tilt Hydrometer (Part 6) Tilt Simulator an Upgrade
Tilt Hydrometer (Part 7) Advertising Database
Tilt Hydrometer (Part 8) Read the Database
Tilt Hydrometer (Part 9) An LCD Display
Tilt Hydrometer (Part 10) The Display State Machine
Tilt Hydrometer (Part 11) Draw the Display Screens
Tilt Hydrometer (Part 12) CapSense
Tilt Hydrometer: LittleFS & SPI Flash (Part ?)
Tilt Hydrometer: WiFi Introducer (Part ?)
Tilt Hydrometer: WebServer (Part ?)
Tilt Hydrometer: Amazon MQTT (Part ?)
Tilt Hydrometer: Printed Circuit Board (Part ?)
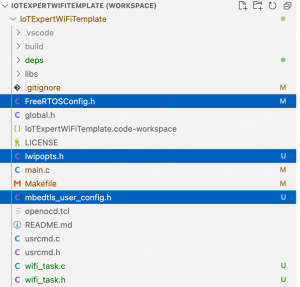
You can get the source code from git@github.com:iotexpert/Tilt2.git This repository has tags for each of the articles which can be accessed with "git checkout part12" You can find the Tilt Simulator at git@github.com:iotexpert/TiltSimulator.git.
No comment yet, add your voice below!