Summary
This article walks you through the steps to test the CY4533 Type-C BCR & IR3894 under the load conditions from 1A to 12A. In the previous article, I supplied power to the IR3894 using a bench top power supply. For this set of experiments I will use a Type-C wall wart connected to the Cypress 4533 BCR development kit to supply power.
Test the BCR
The first thing that I do is connect the whole mess together like this:

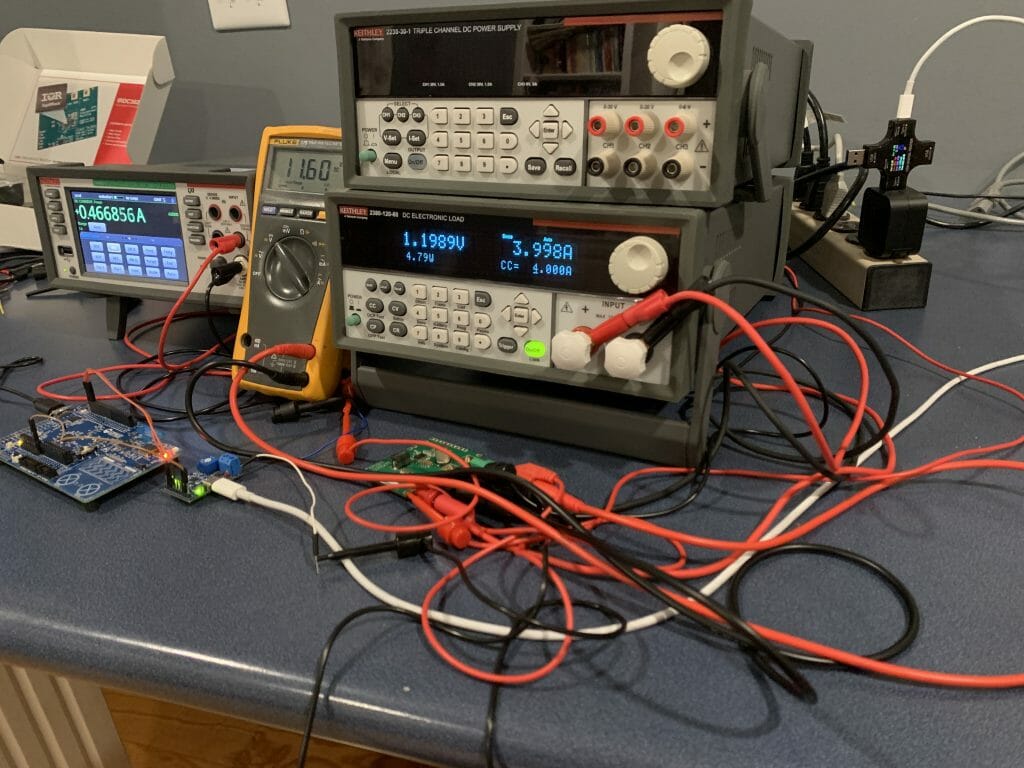
Here is how it looks on my desk. Note that the Keithey can measure current and voltage… but that I don’t have a way in this setup to measure either the voltage/current from the power supply or the current out of the CY4533
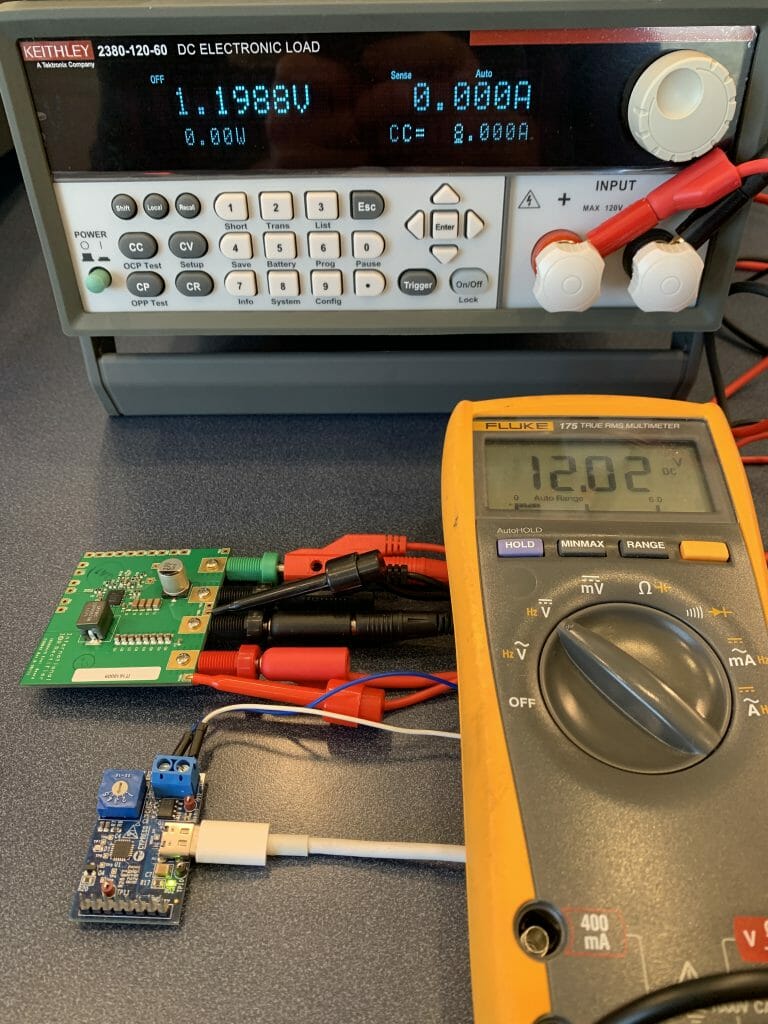
I step the output load from 1A to 12A in 1A increments. I am super happy to see that the output voltage of the IR3894 is perfectly regulated to 1.198V. It is also interesting to see that the Type-C power supply is able to keep the voltage within 3.25% of nominal even when I am using 12A on the IRDC3894 output (probably around 1.5A from the Type-C)
Measure the Input Current
In the previous article I used the current measurement from the Keithley bench top power supply. In the setup above I don’t have a way to measure the actual input current. To fix this put my new Keithley DAQ6510 in series with the IRDC3894 board. Like this:

Then I step through the 1A-12A load conditions. Once again the IR3894 provide a very well regulated voltage and current (exactly the same as before so I didn’t write them down)
Here is a table with the data from the previous post (without the Type-C power supply) versus the Type-C power supply.
| 2230-30-1 Power Supply | With 6510 current meter in input path | ||||||||||
| Vin | Iin | Win | Vout | Iout | Wout | Eff | Vin | Iin | Win | Eff-C | Loss |
| 12 | 0.27 | 3.24 | 1.198 | 0 | 0 | 0% | |||||
| 12 | 0.129 | 1.548 | 1.198 | 0.998 | 1.195604 | 77% | 11.91 | 0.129 | 1.53639 | 77.8% | -0.6% |
| 12 | 0.239 | 2.868 | 1.198 | 1.998 | 2.393604 | 83% | 11.8 | 0.242 | 2.8556 | 83.8% | -0.4% |
| 12 | 0.345 | 4.14 | 1.198 | 2.998 | 3.591604 | 87% | 11.7 | 0.352 | 4.1184 | 87.2% | -0.5% |
| 12 | 0.454 | 5.448 | 1.198 | 3.998 | 4.789604 | 88% | 11.59 | 0.467 | 5.41253 | 88.5% | -0.6% |
| 12 | 0.564 | 6.768 | 1.198 | 4.999 | 5.988802 | 88% | 11.47 | 0.586 | 6.72142 | 89.1% | -0.6% |
| 12 | 0.677 | 8.124 | 1.198 | 5.998 | 7.185604 | 88% | 11.36 | 0.709 | 8.05424 | 89.2% | -0.8% |
| 12 | 0.792 | 9.504 | 1.198 | 6.998 | 8.383604 | 88% | 11.25 | 0.837 | 9.41625 | 89.0% | -0.8% |
| 12 | 0.909 | 10.908 | 1.198 | 7.998 | 9.581604 | 88% | 11.13 | 0.97 | 10.7961 | 88.8% | -0.9% |
| 12 | 1.029 | 12.348 | 1.198 | 8.998 | 10.779604 | 87% | 10.95 | 1.115 | 12.20925 | 88.3% | -1.0% |
| 12 | 1.152 | 13.824 | 1.198 | 9.999 | 11.978802 | 87% | 10.85 | 1.258 | 13.6493 | 87.8% | -1.1% |
| 12 | 1.277 | 15.324 | 1.198 | 10.998 | 13.175604 | 86% | 10.8 | 1.401 | 15.1308 | 87.1% | -1.1% |
| 12 | 1.406 | 16.872 | 1.198 | 11.997 | 14.372406 | 85% | 10.68 | 1.558 | 16.63944 | 86.4% | -1.2% |
These measurements use 1A/3A range on the Keithley DAQ6510 DMM, which means that they have a 100mΩ shunt resistor in series which drops the voltage by V=IR or about 0.1-ish volts. This explains most of the difference from the Power Supply to the Type-C setup.

It is actually very interesting to look at the data to see the impact of lowering the input voltage on the efficiency of the IR3894. It appears that at the highest load and lowest input voltage the efficiency is down by 1.2%
Watch the Sunrise
While I was sitting there at my desk thinking about what to do next, I decided that the best thing to do was go sit in my hottub and watch the sunrise on God’s country.

USB C Power Meter Tester
I was hoping to be able to measure the input current and voltage from the Type-C power supply so that I could calculate the efficiency of the CY4533 EZ BCR. And as a result the efficiency of the whole system. There wasn’t a place on the Type-C development kit to make these measurements, but the Cypress Apps manager for Type-C – Palani – said I should buy something like this from Amazon.
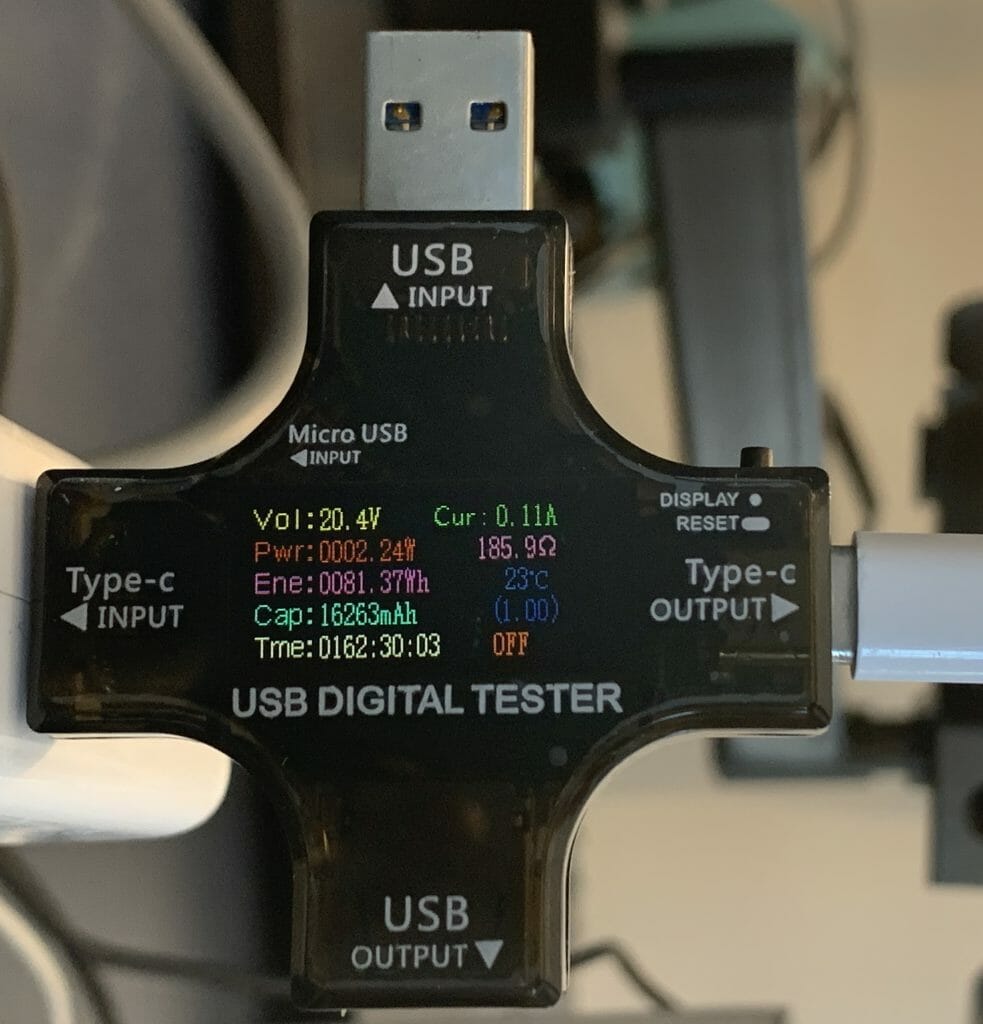
So I did. You can plug it into Type-A or Type-C and it will tell you how much V/I are coming out. In the picture below you can see 20.4v@0.11A
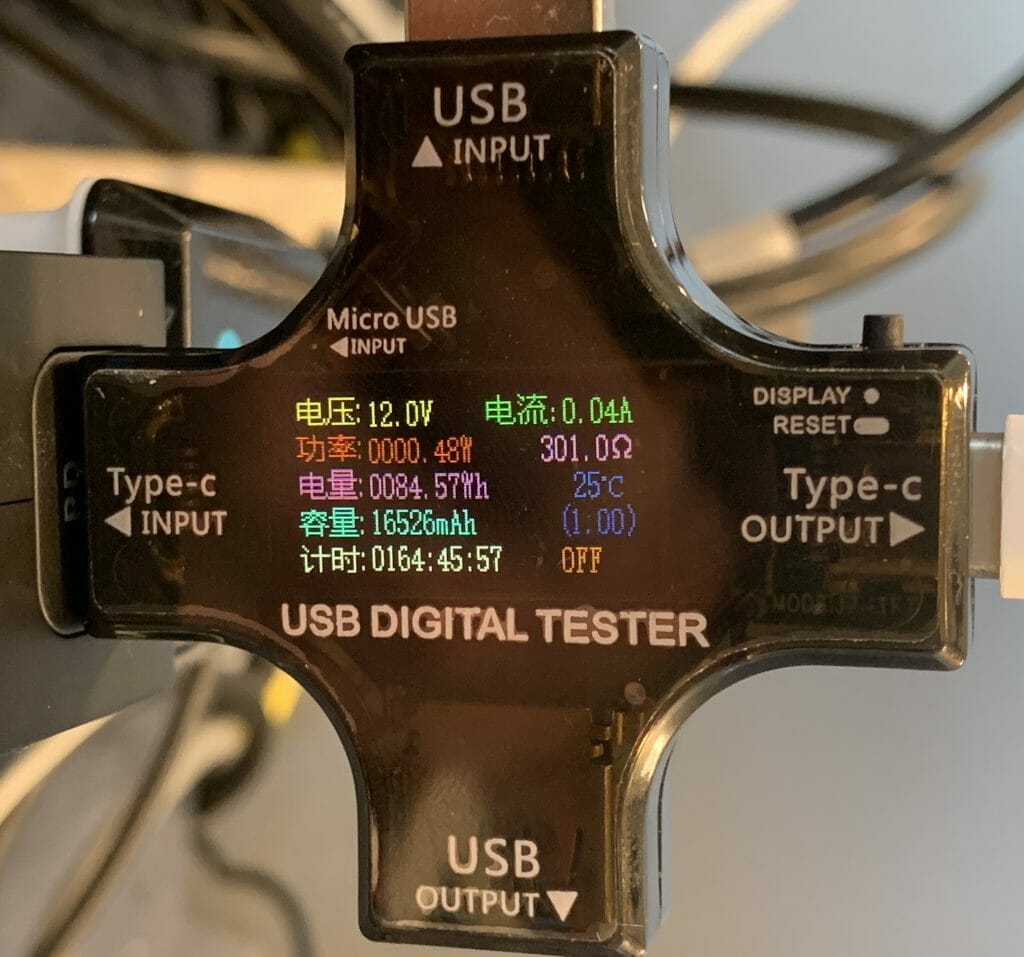
Even better it has a handy-dandy mode where it can display Chinese?
Here is a picture in my actual setup:
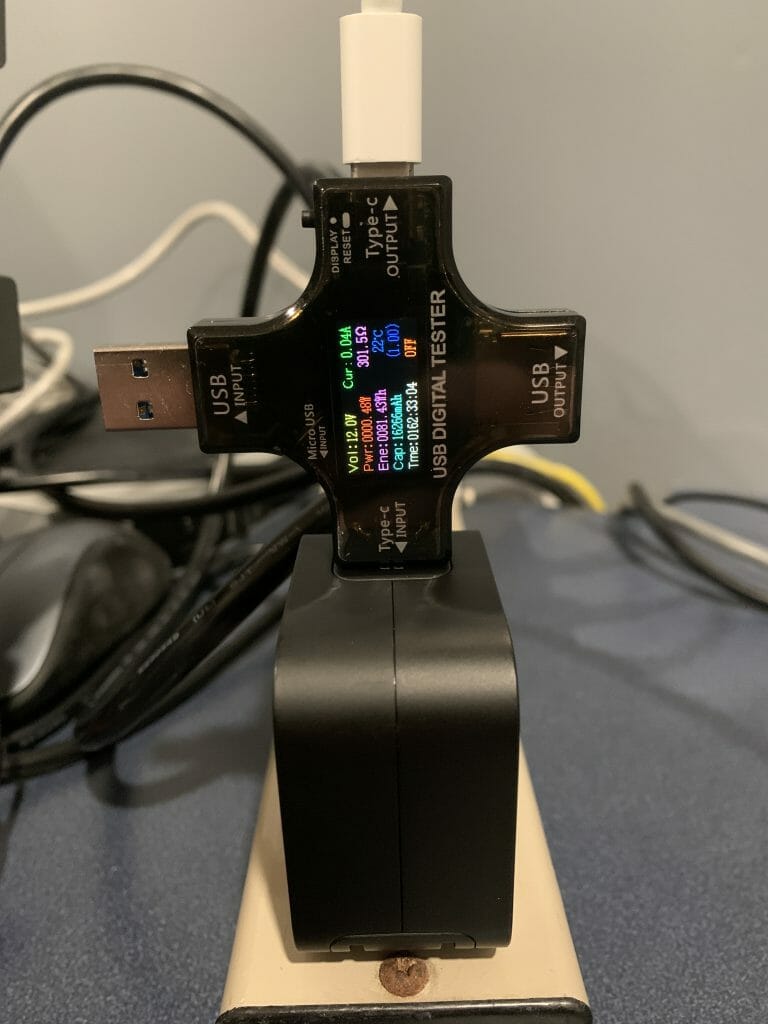
And a picture of the whole crazy setup.
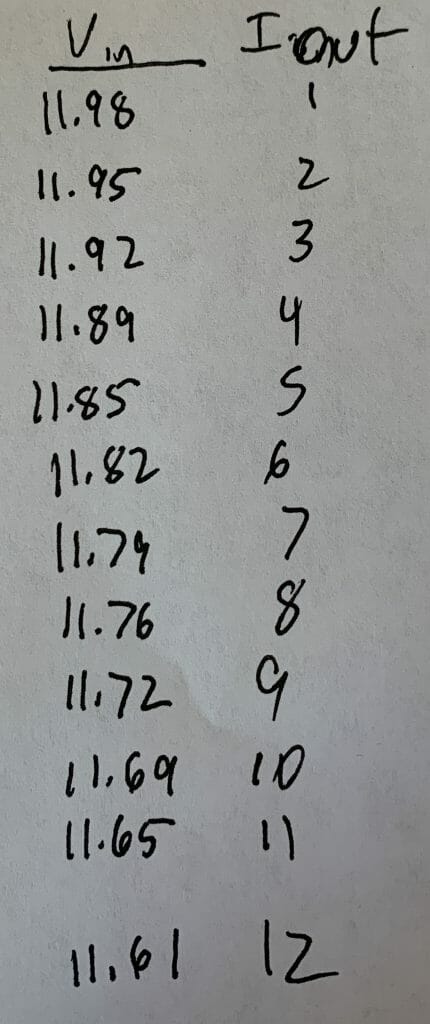
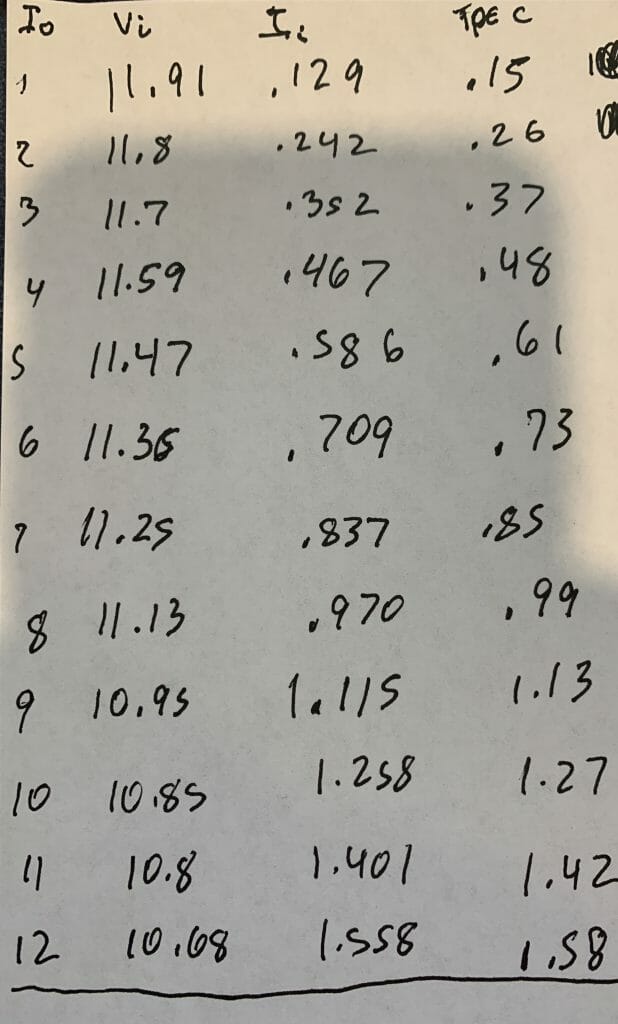
Now I step through my 12 load conditions from 1A to 12A and record the V/I from the Fluke and the USB Power Tester.
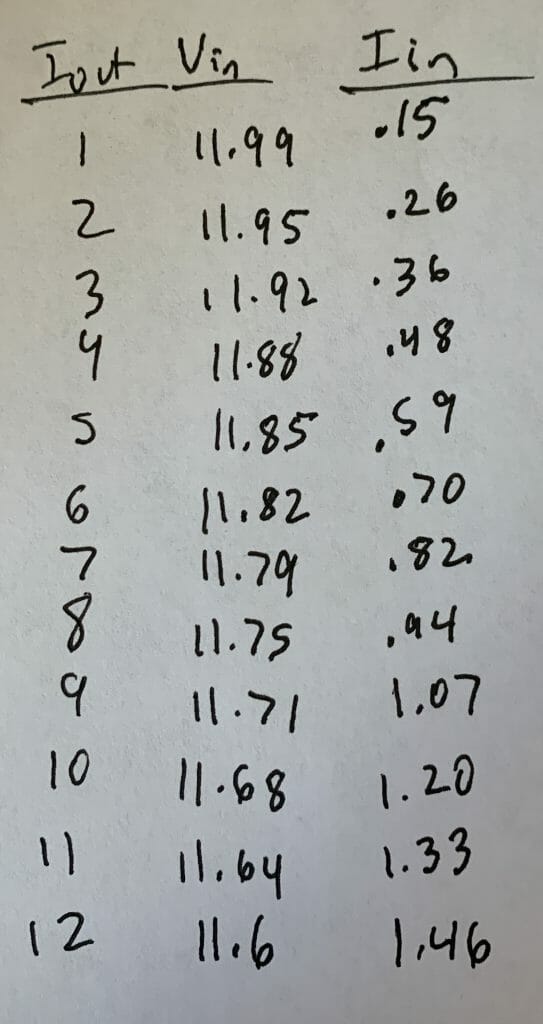
Here is the data in table form with power and efficiency added.
| Type C Power Tester | |||
| Vin | Iin | Win | Eff-No Meter |
| 11.99 | 0.15 | 1.7985 | 66.5% |
| 11.95 | 0.26 | 3.107 | 77.0% |
| 11.92 | 0.36 | 4.2912 | 83.7% |
| 11.88 | 0.48 | 5.7024 | 84.0% |
| 11.85 | 0.59 | 6.9915 | 85.7% |
| 11.82 | 0.7 | 8.274 | 86.8% |
| 11.79 | 0.82 | 9.6678 | 86.7% |
| 11.75 | 0.94 | 11.045 | 86.8% |
| 11.71 | 1.07 | 12.5297 | 86.0% |
| 11.68 | 1.2 | 14.016 | 85.5% |
| 11.64 | 1.33 | 15.4812 | 85.1% |
| 11.6 | 1.46 | 16.936 | 84.9% |
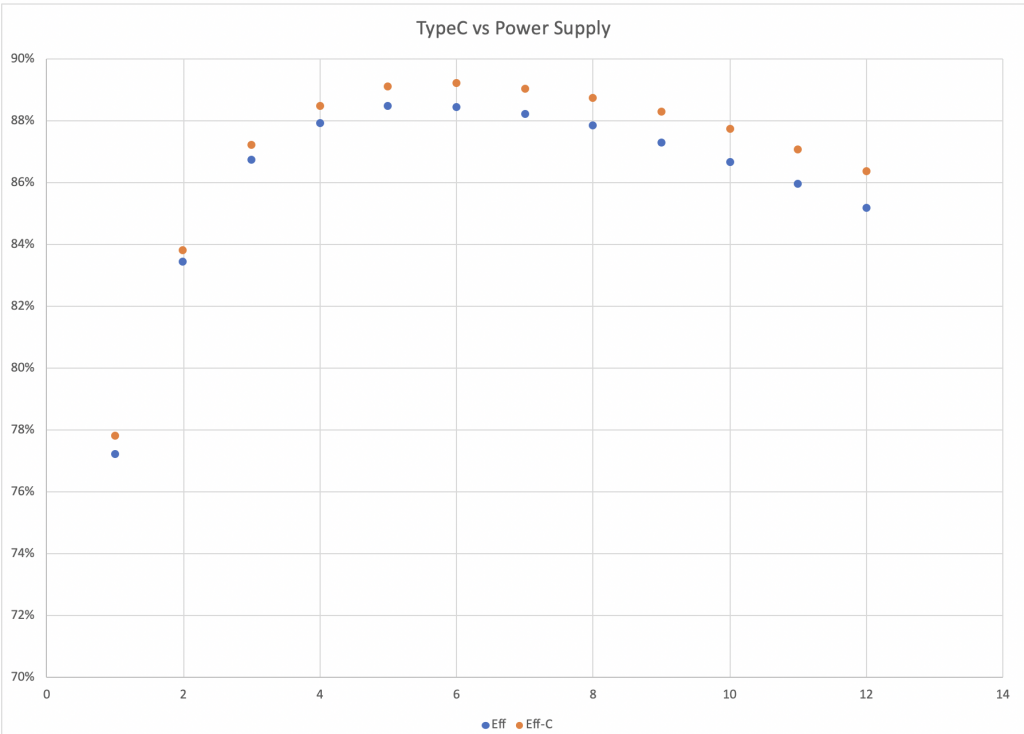
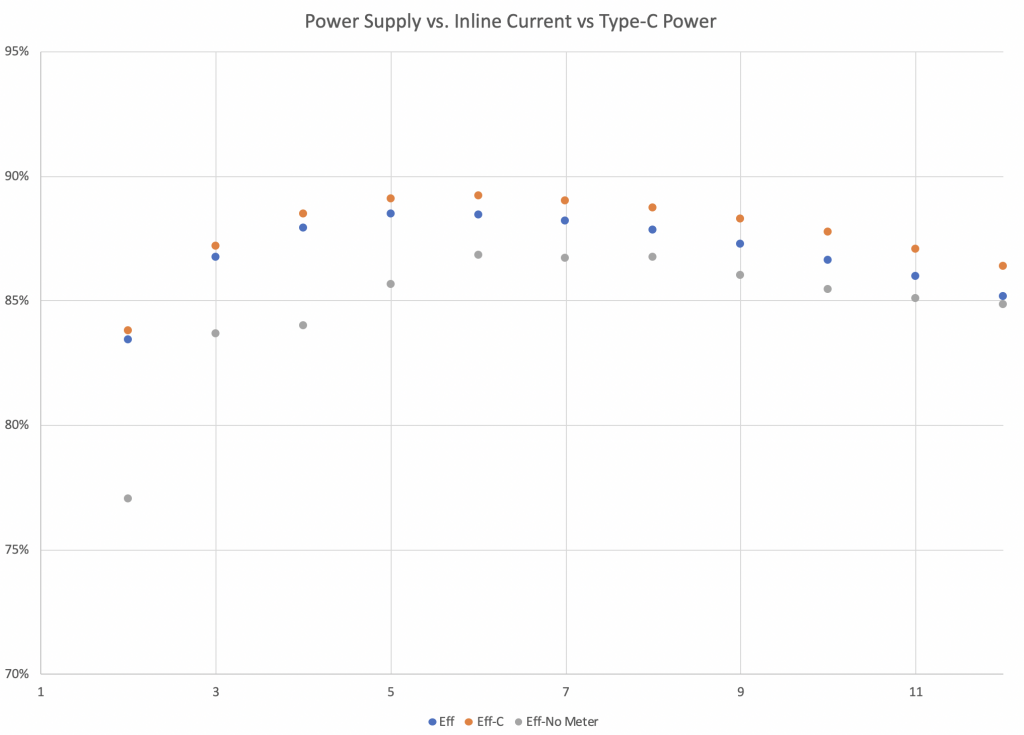
Next, I plot the new data with the previous two plots. Obviously, it is screwed up. I would bet money that the data points at 2A, 4A and 12A are wrong. But, I don’t think that it is worthwhile to take steps to figure out the real current. So, I suppose that is what you get from a $19 power meter.
Efficiency of CY4533 EZ-PD BCR
I had really wanted to measure the efficiency of the BCR setup. To do that I needed to be able to measure the output power (V/I) and the input power (V/I). Unfortunately the power meter doesn’t seem to be very good… so I suppose that I will have to wait to build my real board where I can install some power jumpers the real numbers.
No comment yet, add your voice below!