Summary
In this article I will show you how to use a Keithley 2380 (actually two different ones) to test the output of the IRDC3894 12V->1.2V 12A buck development kit.
The Story
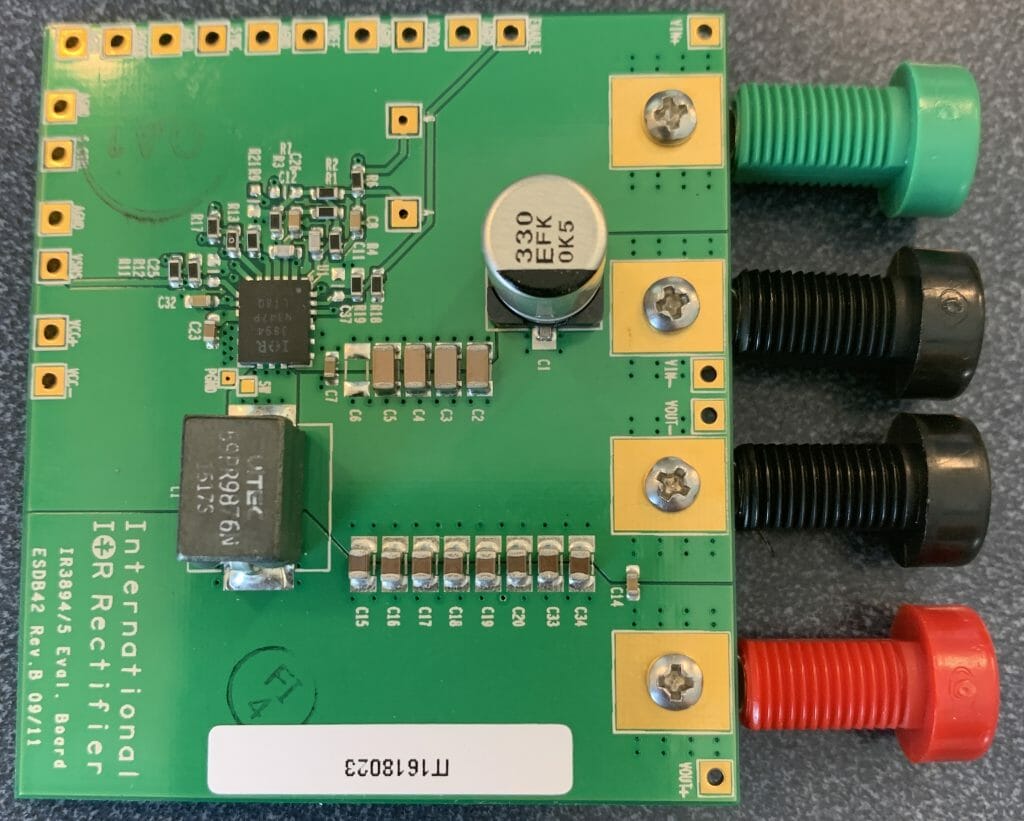
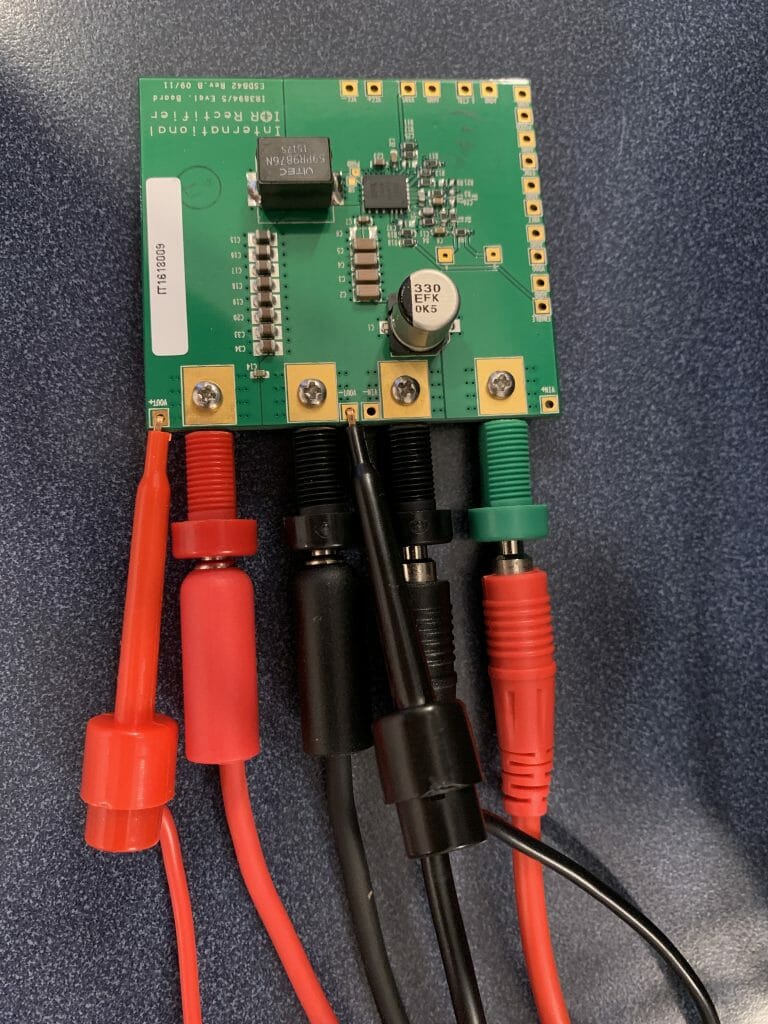
To this point I have written several articles about my process of designing a power supply for my new IoT device. It needs to provide for quite a bit of power, actually 60W is what I am planning on. I really wanted to make sure that the IR3894 chip would do what it says it would, specifically supply 12A. The development kit is pretty simple. There are two banana plug to provide power to Vin and two banana plus for the load.
For this round of tests I will Keithley 2230-30-1 to provide power and I will use my Keithley 2380-120-60 to serve as the load.
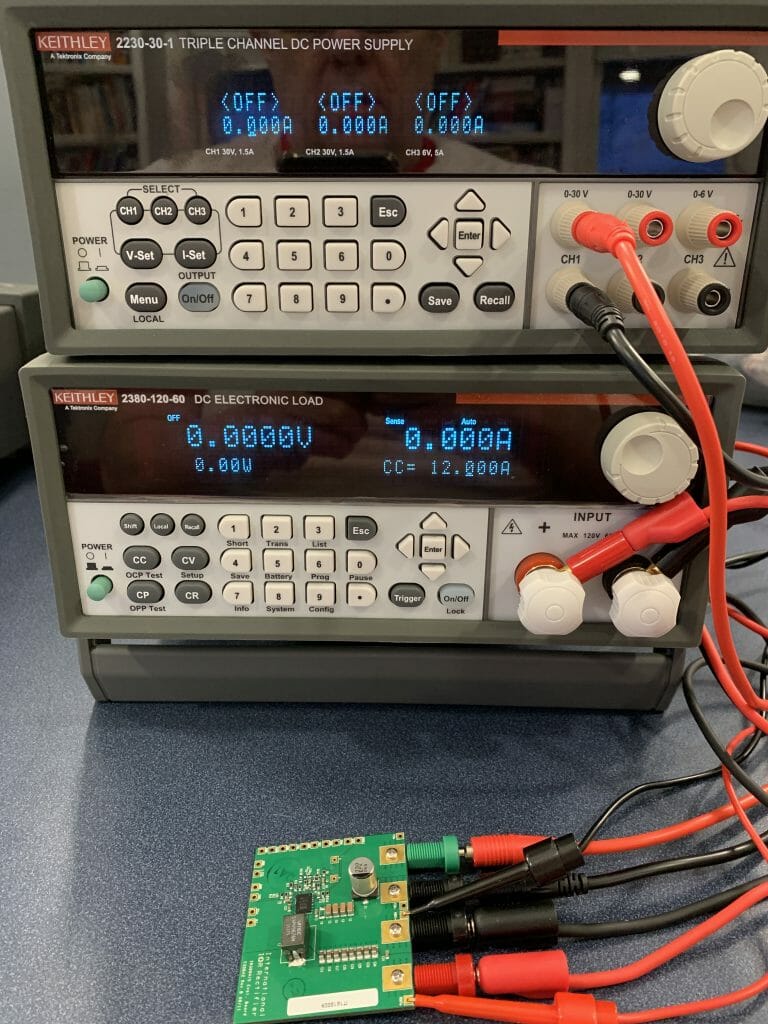
The two mini grabbers are attached to to remote sensing terminals on the Keithley 2380.
After I had it all hooked up I went in 1A increments from 0 to 12A, then I went in 0.1A increments until I ran out of input power.
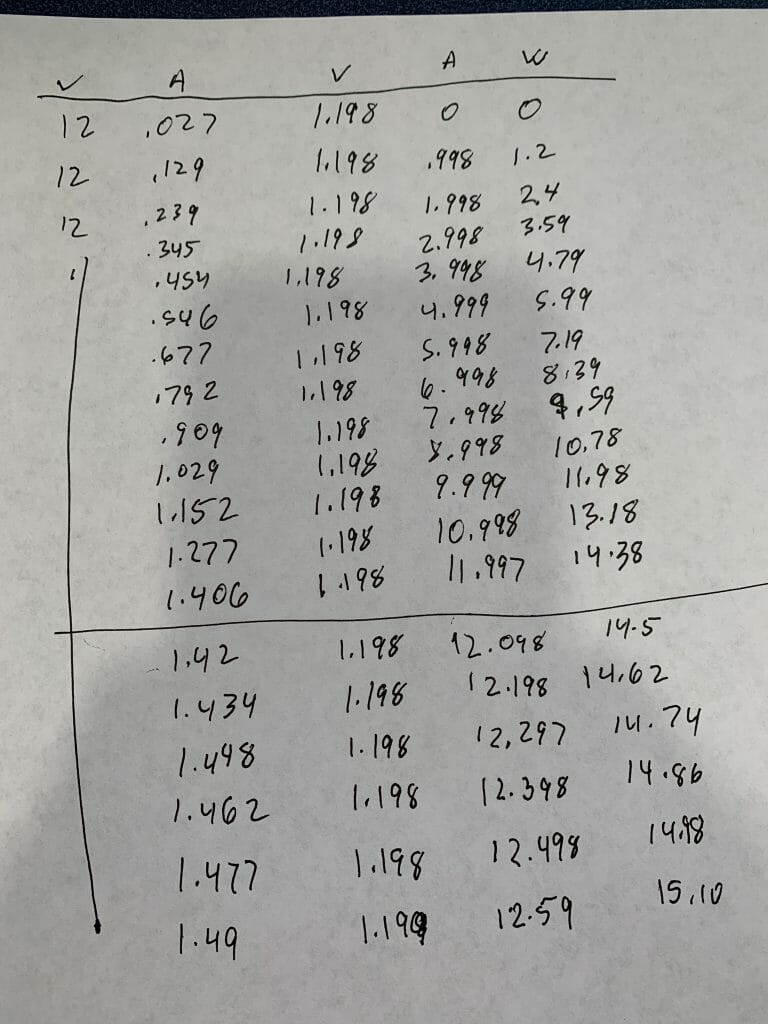
Here is the actual data table. Note that I added columns to show the calculated input power. And I calculated the efficiency of the system Wout/Win
| Vin | Iin | Win | Vout | Iout | W | Eff |
| 12 | 0.27 | 3.24 | 1.198 | 0 | 0 | 0% |
| 12 | 0.129 | 1.548 | 1.198 | 0.998 | 1.195604 | 77% |
| 12 | 0.239 | 2.868 | 1.198 | 1.998 | 2.393604 | 83% |
| 12 | 0.345 | 4.14 | 1.198 | 2.998 | 3.591604 | 87% |
| 12 | 0.454 | 5.448 | 1.198 | 3.998 | 4.789604 | 88% |
| 12 | 0.564 | 6.768 | 1.198 | 4.999 | 5.988802 | 88% |
| 12 | 0.677 | 8.124 | 1.198 | 5.998 | 7.185604 | 88% |
| 12 | 0.792 | 9.504 | 1.198 | 6.998 | 8.383604 | 88% |
| 12 | 0.909 | 10.908 | 1.198 | 7.998 | 9.581604 | 88% |
| 12 | 1.029 | 12.348 | 1.198 | 8.998 | 10.779604 | 87% |
| 12 | 1.152 | 13.824 | 1.198 | 9.999 | 11.978802 | 87% |
| 12 | 1.277 | 15.324 | 1.198 | 10.998 | 13.175604 | 86% |
| 12 | 1.406 | 16.872 | 1.198 | 11.997 | 14.372406 | 85% |
| 12 | 1.42 | 17.04 | 1.198 | 12.098 | 14.493404 | 85% |
| 12 | 1.434 | 17.208 | 1.198 | 12.198 | 14.613204 | 85% |
| 12 | 1.448 | 17.376 | 1.198 | 12.297 | 14.731806 | 85% |
| 12 | 1.462 | 17.544 | 1.198 | 12.398 | 14.852804 | 85% |
| 12 | 1.477 | 17.724 | 1.198 | 12.498 | 14.972604 | 84% |
| 12 | 1.49 | 17.88 | 1.198 | 12.59 | 15.08282 | 84% |
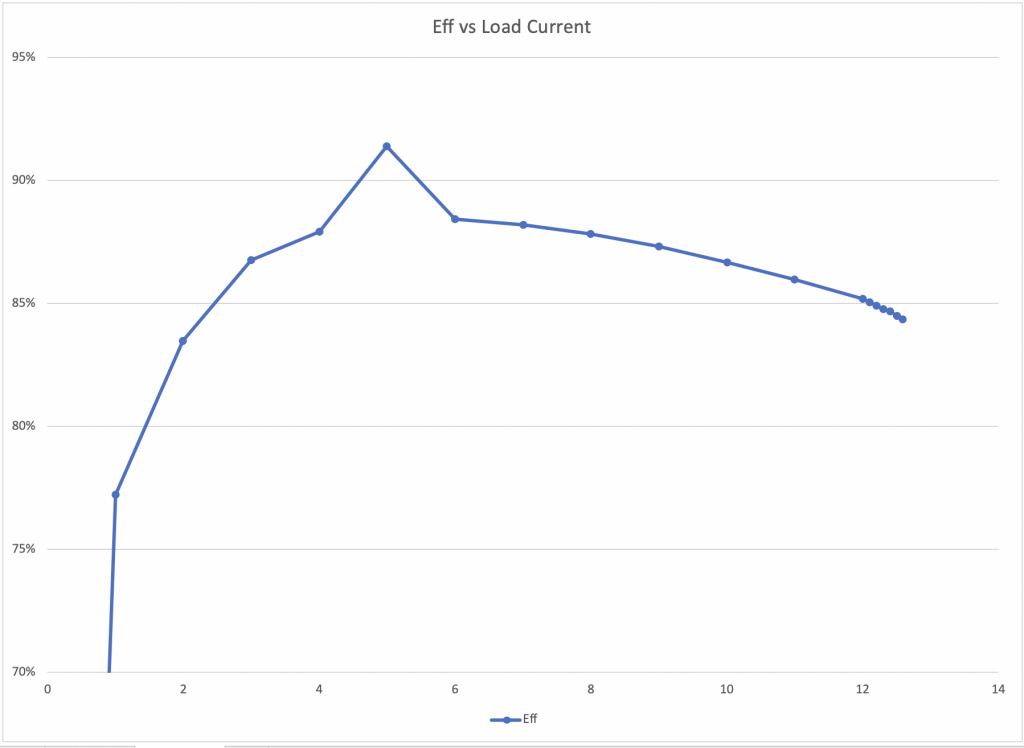
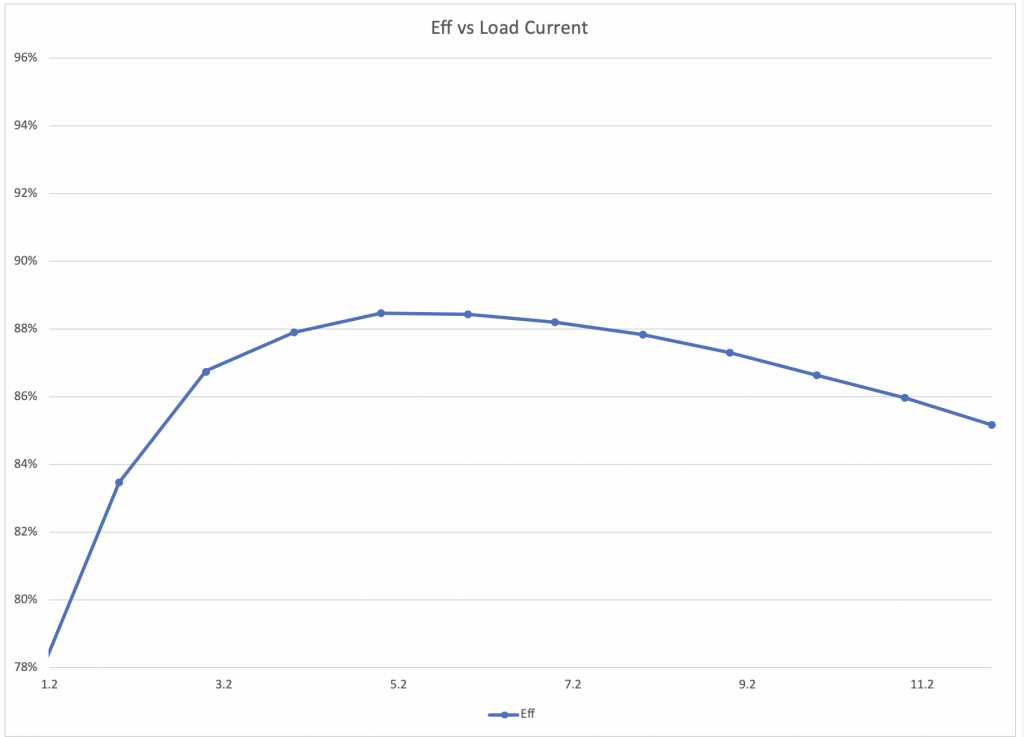
When I plot the data there is something sticking out like a sore thumb. WTF? At first I assume that I typed in the wrong number when I transposed the hand written data to the spreadsheet. So I went and looked at the data table where it appears that I typed it in correctly. Does the efficiency really have a peak like that?
I decided to go remeasure the 5A datapoint.
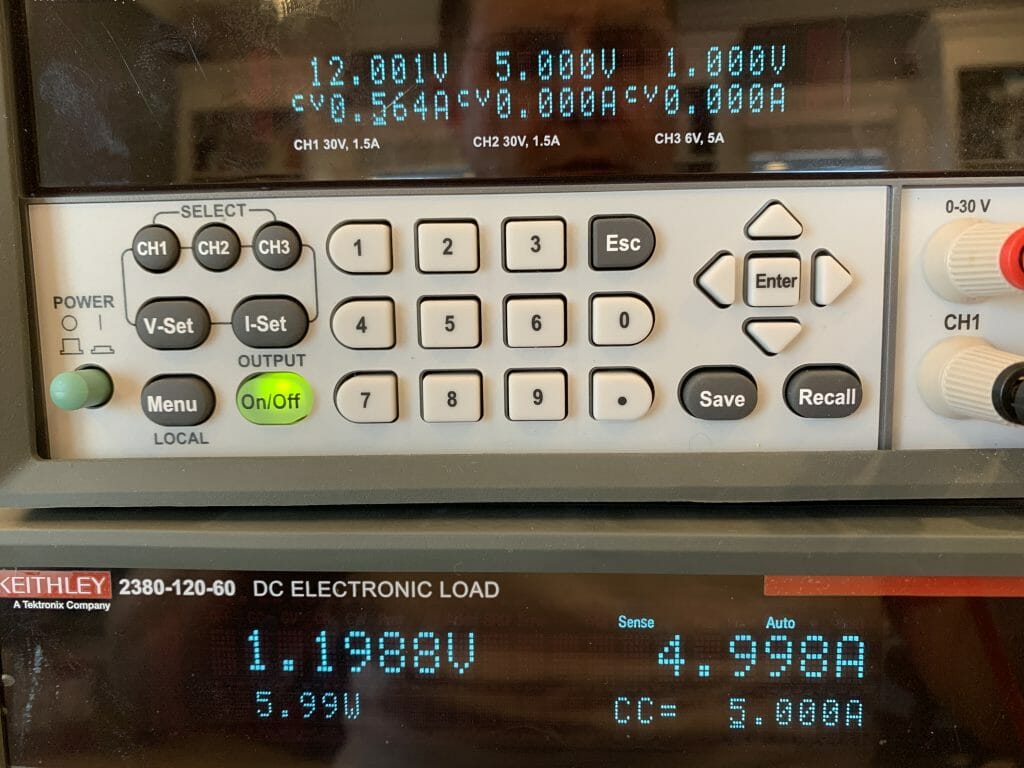
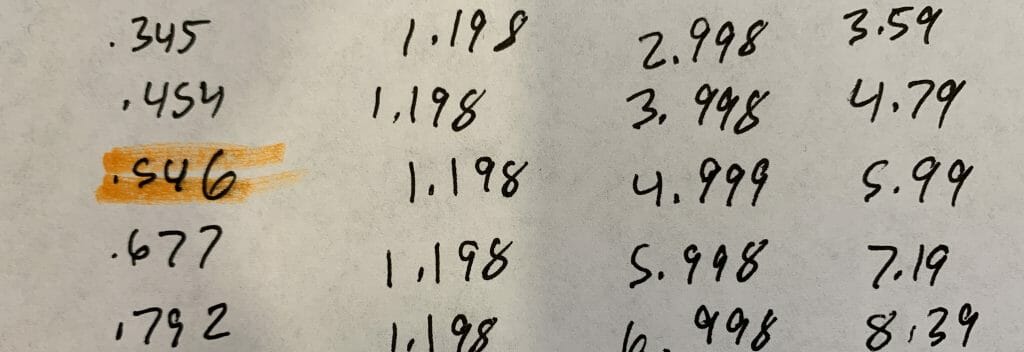
Then I looked at my handwritten data sheet where I find that I transposed the last two digits of the input current. (I definitely should automate this measurement)
OK… now the plot looks way better
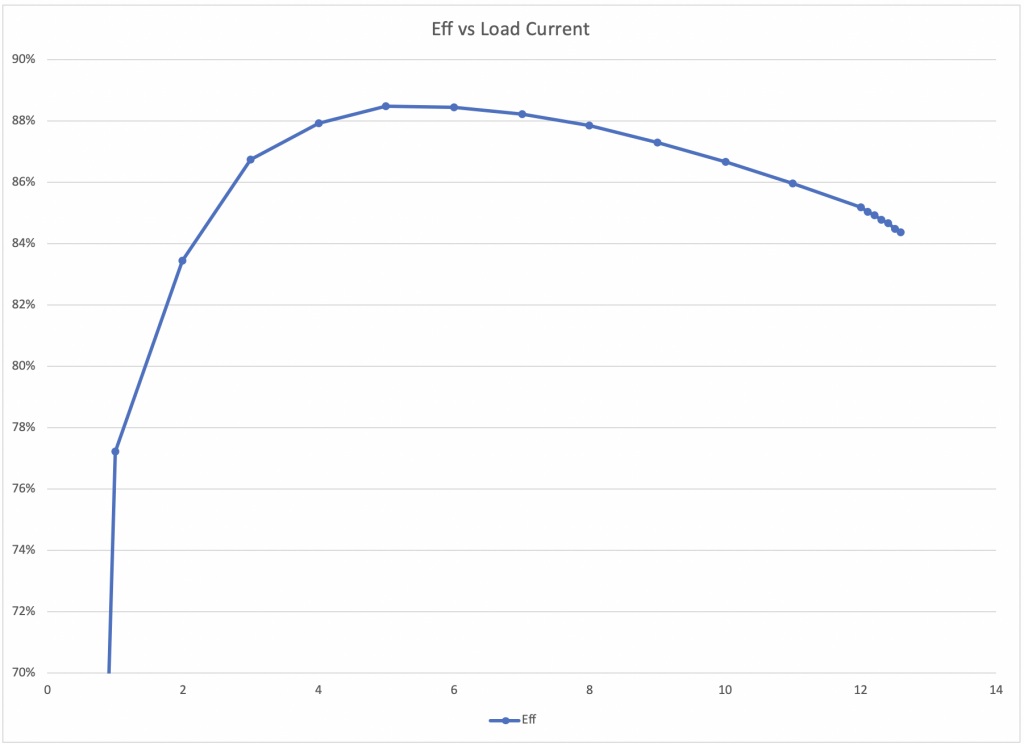
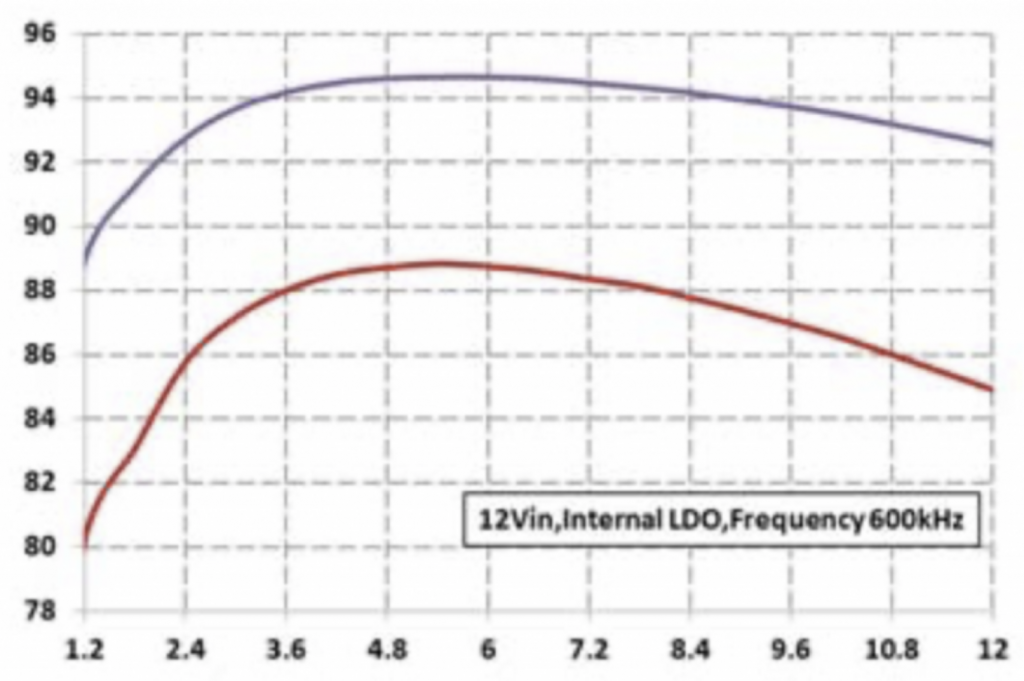
When I compare the plot from the data sheet versus my data on the same scale (about) they look very similar. All seems good.
No comment yet, add your voice below!