Keithley 2380-500-15 & 2380-120-60

Summary

In this article I discuss my ridiculous motivation for buying a new Keithley 2830-120-60 to replace my very functional Keithey 2380-500-15

2380-500-15 & 2380-120-60

While working on the IRDC3894 I spent a significant amount of time using the Keithley 2380 in Constant Current Mode.  The development kit that I was testing was configured to enable 1.2v output at 15A.  In the picture below I am pulling 1A.  You can see the Keithley set to pull 1A and it is actually drawing 0.9998A (plenty close)

While I was testing the setup I would slowly increase the current.  In the picture below you can see that I got to 5.4A with no problem.

But at 5.5A the trouble starts.  In the picture below you can see that I am asking for 5.5A but I am only getting 5.48A

And the gap gets worse as I increase the current.

So I posted on the Keithley site trying to figure out what was happening.  Was the Keithley dead?

And unfortunately there is the answer.  The load has a minimum operating voltage of 4.5v when it is in the 15A mode.

But the 2380-120-60 has a 1.8V operating voltage at 60A

And when I get it plugged in I find that it will happily deliver 16A at 1.2V

And it doesn’t start to roll over until 17A (at 1.2V)

Cypress Type-C Barrel Connector Replacement + Infineon Buck DC/DC (Part 3)

Summary

This article walks you through the steps to test the CY4533 Type-C BCR & IR3894 under the load conditions from 1A to 12A.  In the previous article, I supplied power to the IR3894 using a bench top power supply.  For this set of experiments I will use a Type-C wall wart connected to the Cypress 4533 BCR development kit to supply power.

Test the BCR

The first thing that I do is connect the whole mess together like this:

Here is how it looks on my desk.  Note that the Keithey can measure current and voltage… but that I don’t have a way in this setup to measure either the voltage/current from the power supply or the current out of the CY4533

I step the output load from 1A to 12A in 1A increments.  I am super happy to see that the output voltage of the IR3894 is perfectly regulated to 1.198V.  It is also interesting to see that the Type-C power supply is able to keep the voltage within 3.25% of nominal even when I am using 12A on the IRDC3894 output (probably around 1.5A from the Type-C)

Measure the Input Current

In the previous article I used the current measurement from the Keithley bench top power supply.  In the setup above I don’t have a way to measure the actual input current.  To fix this put my new Keithley DAQ6510 in series with the IRDC3894 board.  Like this:

Then I step through the 1A-12A load conditions.  Once again the IR3894 provide a very well regulated voltage and current (exactly the same as before so I didn’t write them down)

Here is a table with the data from the previous post (without the Type-C power supply) versus the Type-C power supply.

2230-30-1 Power Supply With 6510 current meter in input path
Vin Iin Win Vout Iout Wout Eff Vin Iin Win Eff-C Loss
12 0.27 3.24 1.198 0 0 0%
12 0.129 1.548 1.198 0.998 1.195604 77% 11.91 0.129 1.53639 77.8% -0.6%
12 0.239 2.868 1.198 1.998 2.393604 83% 11.8 0.242 2.8556 83.8% -0.4%
12 0.345 4.14 1.198 2.998 3.591604 87% 11.7 0.352 4.1184 87.2% -0.5%
12 0.454 5.448 1.198 3.998 4.789604 88% 11.59 0.467 5.41253 88.5% -0.6%
12 0.564 6.768 1.198 4.999 5.988802 88% 11.47 0.586 6.72142 89.1% -0.6%
12 0.677 8.124 1.198 5.998 7.185604 88% 11.36 0.709 8.05424 89.2% -0.8%
12 0.792 9.504 1.198 6.998 8.383604 88% 11.25 0.837 9.41625 89.0% -0.8%
12 0.909 10.908 1.198 7.998 9.581604 88% 11.13 0.97 10.7961 88.8% -0.9%
12 1.029 12.348 1.198 8.998 10.779604 87% 10.95 1.115 12.20925 88.3% -1.0%
12 1.152 13.824 1.198 9.999 11.978802 87% 10.85 1.258 13.6493 87.8% -1.1%
12 1.277 15.324 1.198 10.998 13.175604 86% 10.8 1.401 15.1308 87.1% -1.1%
12 1.406 16.872 1.198 11.997 14.372406 85% 10.68 1.558 16.63944 86.4% -1.2%

These measurements use 1A/3A range on the Keithley DAQ6510 DMM, which means that they have a 100mΩ shunt resistor in series which drops the voltage by V=IR or about 0.1-ish volts.  This explains most of the difference from the Power Supply to the Type-C setup.

It is actually very interesting to look at the data to see the impact of lowering the input voltage on the efficiency of the IR3894.  It appears that at the highest load and lowest input voltage the efficiency is down by 1.2%

Watch the Sunrise

While I was sitting there at my desk thinking about what to do next, I decided that the best thing to do was go sit in my hottub and watch the sunrise on God’s country.

USB C Power Meter Tester

I was hoping to be able to measure the input current and voltage from the Type-C power supply so that I could calculate the efficiency of the CY4533 EZ BCR.  And as a result the efficiency of the whole system.  There wasn’t a place on the Type-C development kit to make these measurements, but the Cypress Apps manager for Type-C – Palani – said I should buy something like this from Amazon.


So I did.  You can plug it into Type-A or Type-C and it will tell you how much V/I are coming out.  In the picture below you can see 20.4v@0.11A

Even better it has a handy-dandy mode where it can display Chinese?

Here is a picture in my actual setup:

And a picture of the whole crazy setup.

Now I step through my 12 load conditions from 1A to 12A and record the V/I from the Fluke and the USB Power Tester.

Here is the data in table form with power and efficiency added.

Type C Power Tester
Vin Iin Win Eff-No Meter
11.99 0.15 1.7985 66.5%
11.95 0.26 3.107 77.0%
11.92 0.36 4.2912 83.7%
11.88 0.48 5.7024 84.0%
11.85 0.59 6.9915 85.7%
11.82 0.7 8.274 86.8%
11.79 0.82 9.6678 86.7%
11.75 0.94 11.045 86.8%
11.71 1.07 12.5297 86.0%
11.68 1.2 14.016 85.5%
11.64 1.33 15.4812 85.1%
11.6 1.46 16.936 84.9%

Next, I plot the new data with the previous two plots.  Obviously, it is screwed up.  I would bet money that the data points at 2A, 4A and 12A are wrong.  But, I don’t think that it is worthwhile to take steps to figure out the real current.  So, I suppose that is what you get from a $19 power meter.

Efficiency of CY4533 EZ-PD BCR

I had really wanted to measure the efficiency of the BCR setup.  To do that I needed to be able to measure the output power (V/I) and the input power (V/I).  Unfortunately the power meter doesn’t seem to be very good… so I suppose that I will have to wait to build my real board where I can install some power jumpers the real numbers.

Cypress Type-C Barrel Connector Replacement + Infineon Buck DC/DC (Part 2)

Summary

In this article I will show you how to use a Keithley 2380 (actually two different ones) to test the output of the IRDC3894 12V->1.2V 12A buck development kit.

The Story

To this point I have written several articles about my process of designing a power supply for my new IoT device.  It needs to provide for quite a bit of power, actually 60W is what I am planning on.  I really wanted to make sure that the IR3894 chip would do what it says it would, specifically supply 12A.  The development kit is pretty simple.  There are two banana plug to  provide power to Vin and two banana plus for the load.

For this round of tests I will Keithley 2230-30-1 to provide power and I will use my Keithley 2380-120-60 to serve as the load.

The two mini grabbers are attached to to remote sensing terminals on the Keithley 2380.

After I had it all hooked up I went in 1A increments from 0 to 12A, then I went in 0.1A increments until I ran out of input power.

Here is the actual data table.  Note that I added columns to show the calculated input power.  And I calculated the efficiency of the system Wout/Win

Vin Iin Win Vout Iout W Eff
12 0.27 3.24 1.198 0 0 0%
12 0.129 1.548 1.198 0.998 1.195604 77%
12 0.239 2.868 1.198 1.998 2.393604 83%
12 0.345 4.14 1.198 2.998 3.591604 87%
12 0.454 5.448 1.198 3.998 4.789604 88%
12 0.564 6.768 1.198 4.999 5.988802 88%
12 0.677 8.124 1.198 5.998 7.185604 88%
12 0.792 9.504 1.198 6.998 8.383604 88%
12 0.909 10.908 1.198 7.998 9.581604 88%
12 1.029 12.348 1.198 8.998 10.779604 87%
12 1.152 13.824 1.198 9.999 11.978802 87%
12 1.277 15.324 1.198 10.998 13.175604 86%
12 1.406 16.872 1.198 11.997 14.372406 85%
12 1.42 17.04 1.198 12.098 14.493404 85%
12 1.434 17.208 1.198 12.198 14.613204 85%
12 1.448 17.376 1.198 12.297 14.731806 85%
12 1.462 17.544 1.198 12.398 14.852804 85%
12 1.477 17.724 1.198 12.498 14.972604 84%
12 1.49 17.88 1.198 12.59 15.08282 84%

When I plot the data there is something sticking out like a sore thumb.  WTF?  At first I assume that I typed in the wrong number when I transposed the hand written data to the spreadsheet.  So I went and looked at the data table where it appears that I typed it in correctly.  Does the efficiency really have a peak like that?

I decided to go remeasure the 5A datapoint.

Then I looked at my handwritten data sheet where I find that I transposed the last two digits of the input current. (I definitely should automate this measurement)

OK… now the plot looks way better

When I compare the plot from the data sheet versus my data on the same scale (about) they look very similar.  All seems good.


Keithley 2380-500-15 Programmable Load Remote Sensing

Summary

In this article I will show you how to install and use the remote sensing inputs for the Keithley 238-500-15 Programmable Load.

The Problem

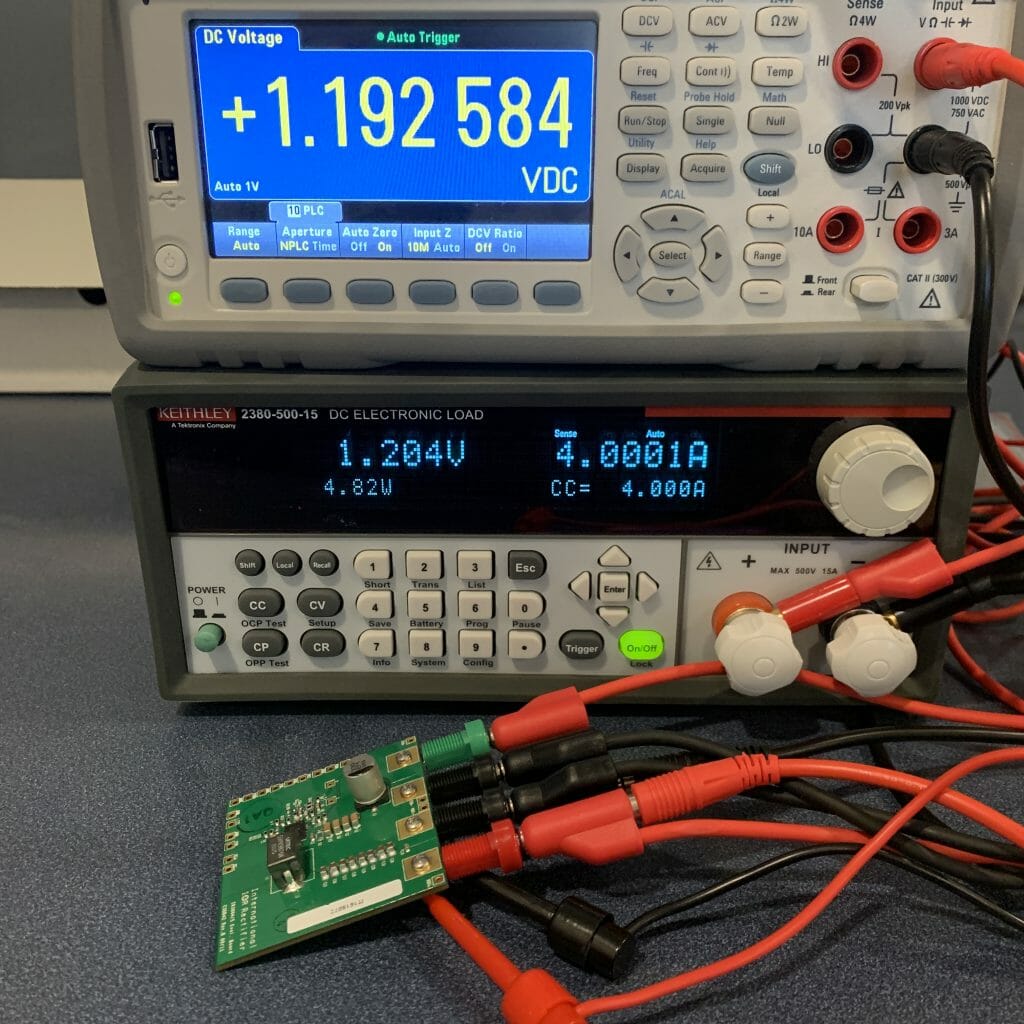
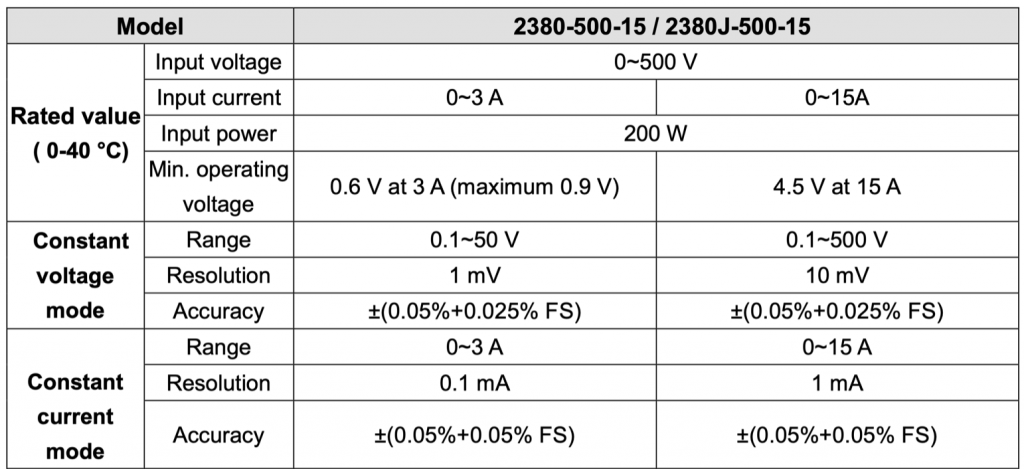
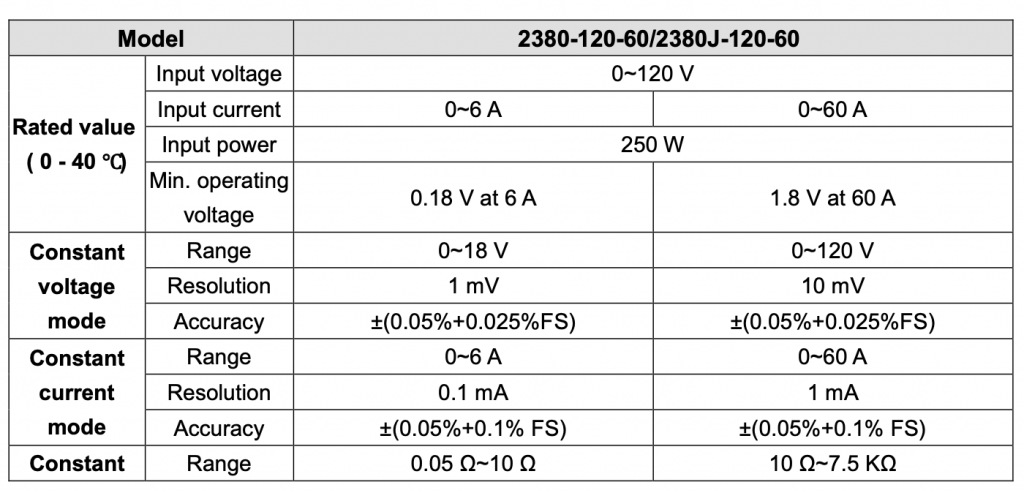
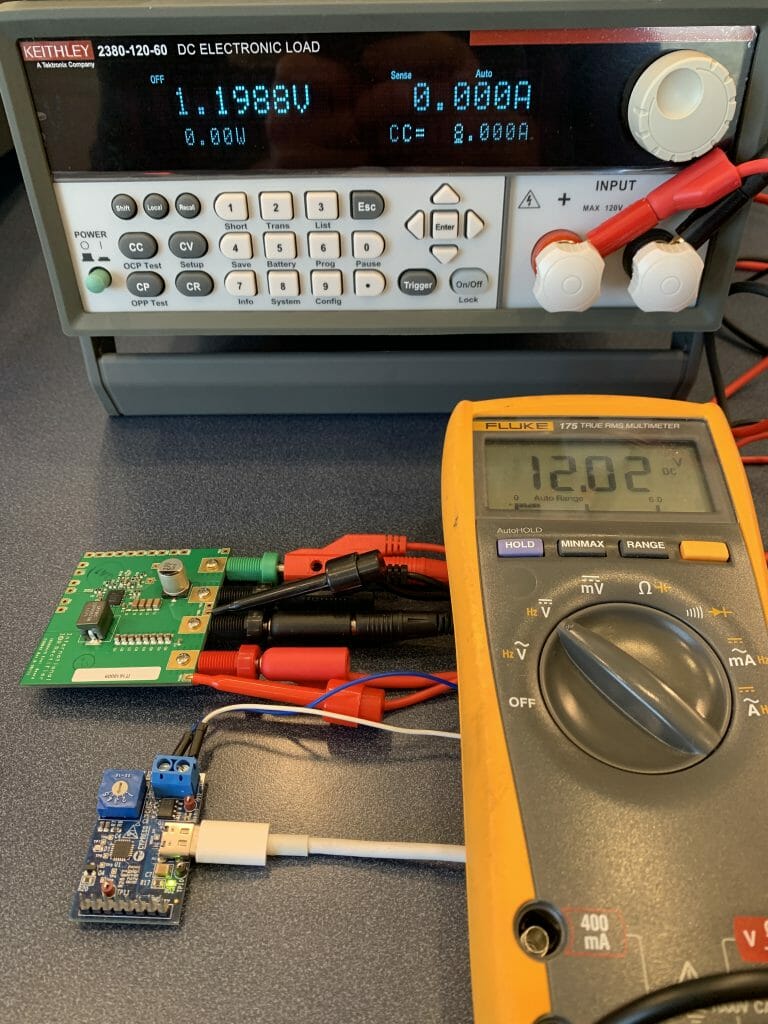
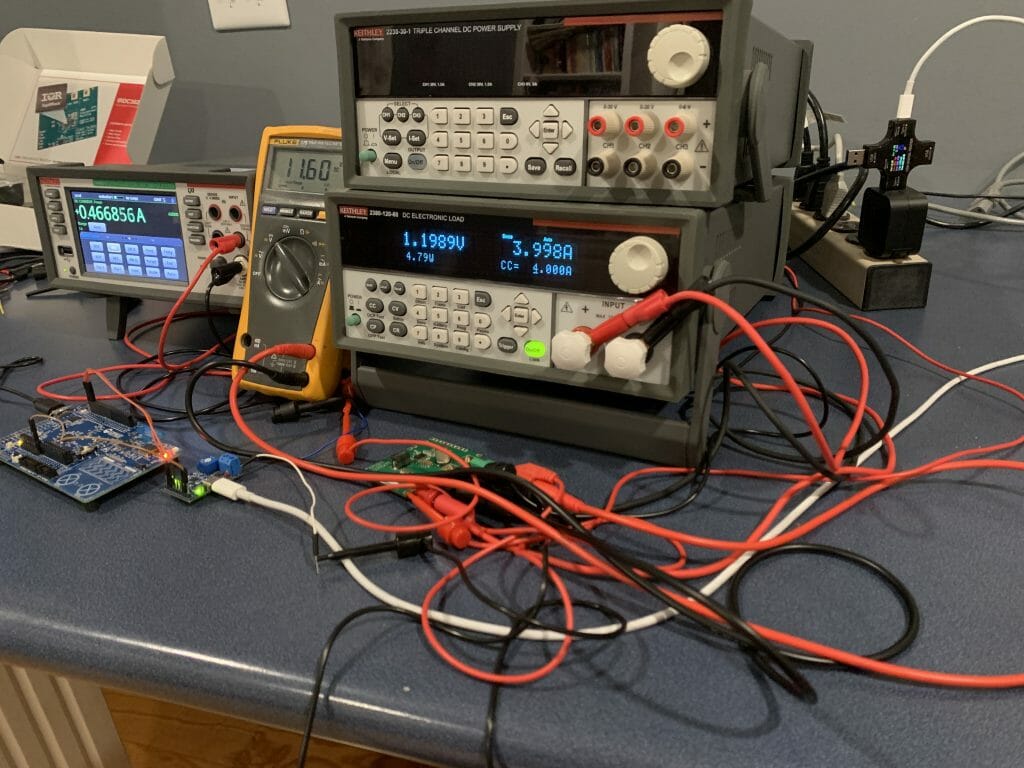
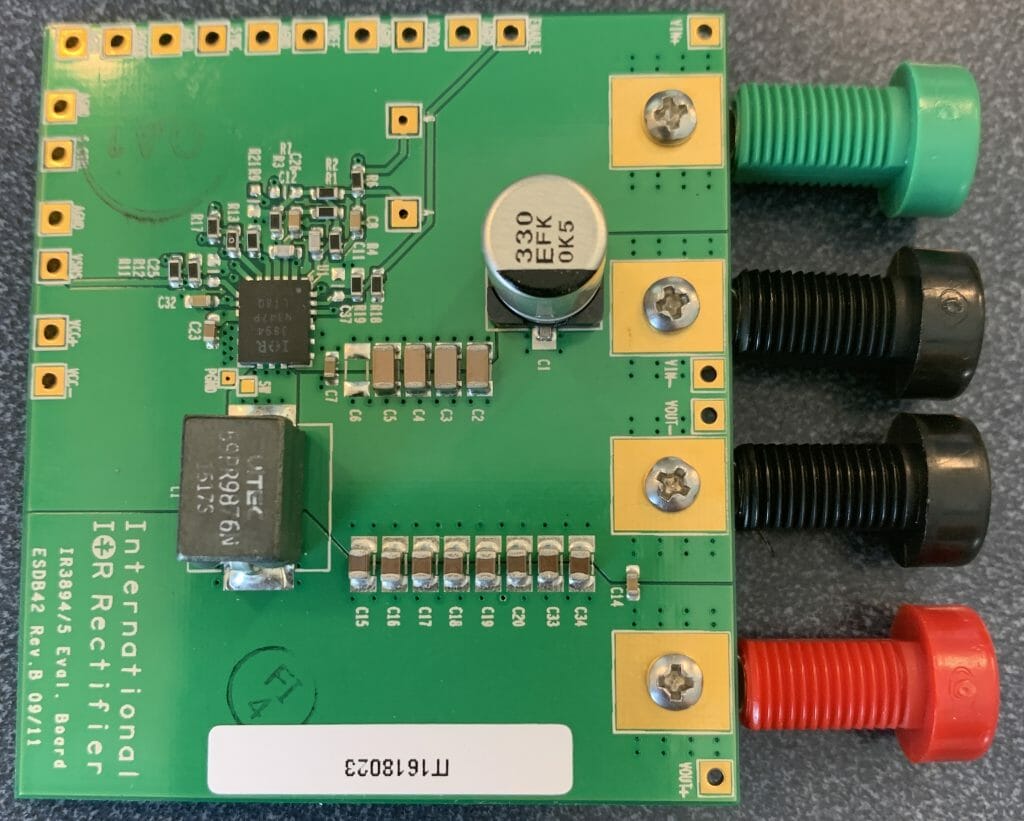
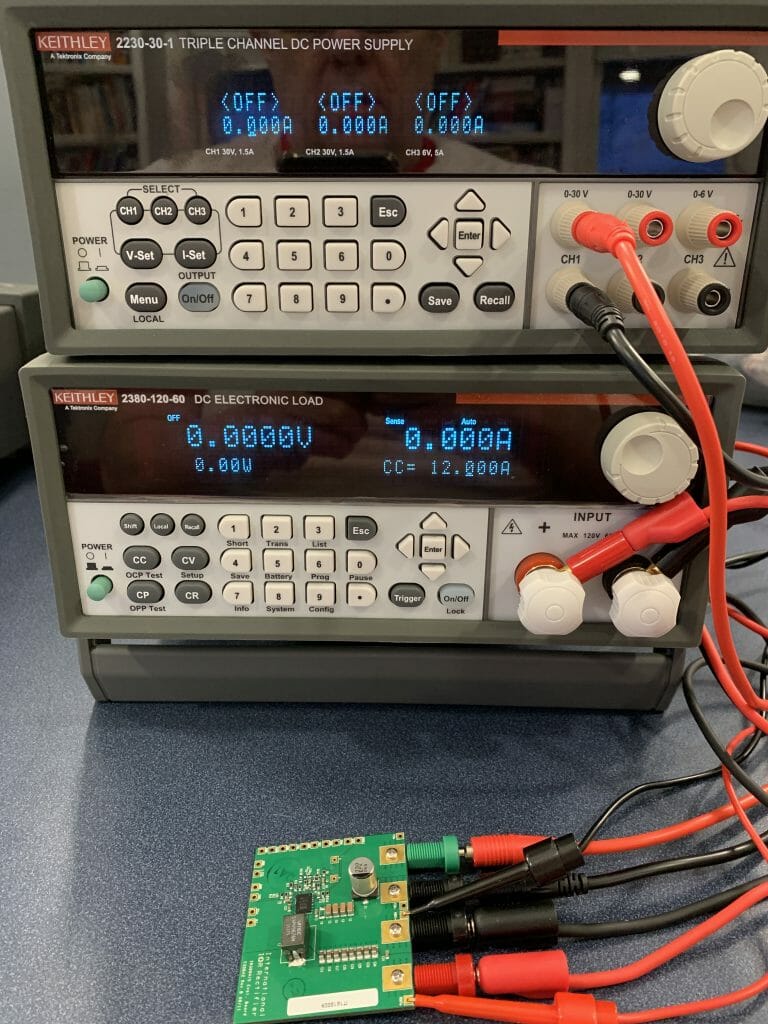
In a previous article I talked about a power supply that I was working on.  In that design, I will be taking 20V@3A from a USB Type-C power supply and turning it into 5V@12A for use to drive a PSoC and a bunch of LEDs.  For testing the setup, I use a Keithley 2380-500-15 Programmable Load that I got from Mouser.  The device is really cool as it can be programmed to provide constant current, constant resistance, constant power or constant voltage.  For this test, I am using the 2380-500-15 as constant current load to pull current out of the Infineon IRDC3894 development board which produces 1.2v@12A.

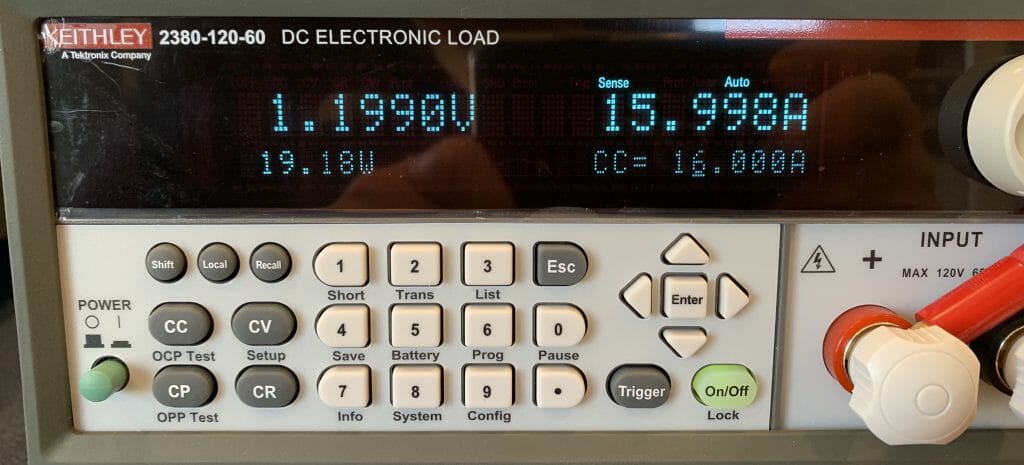
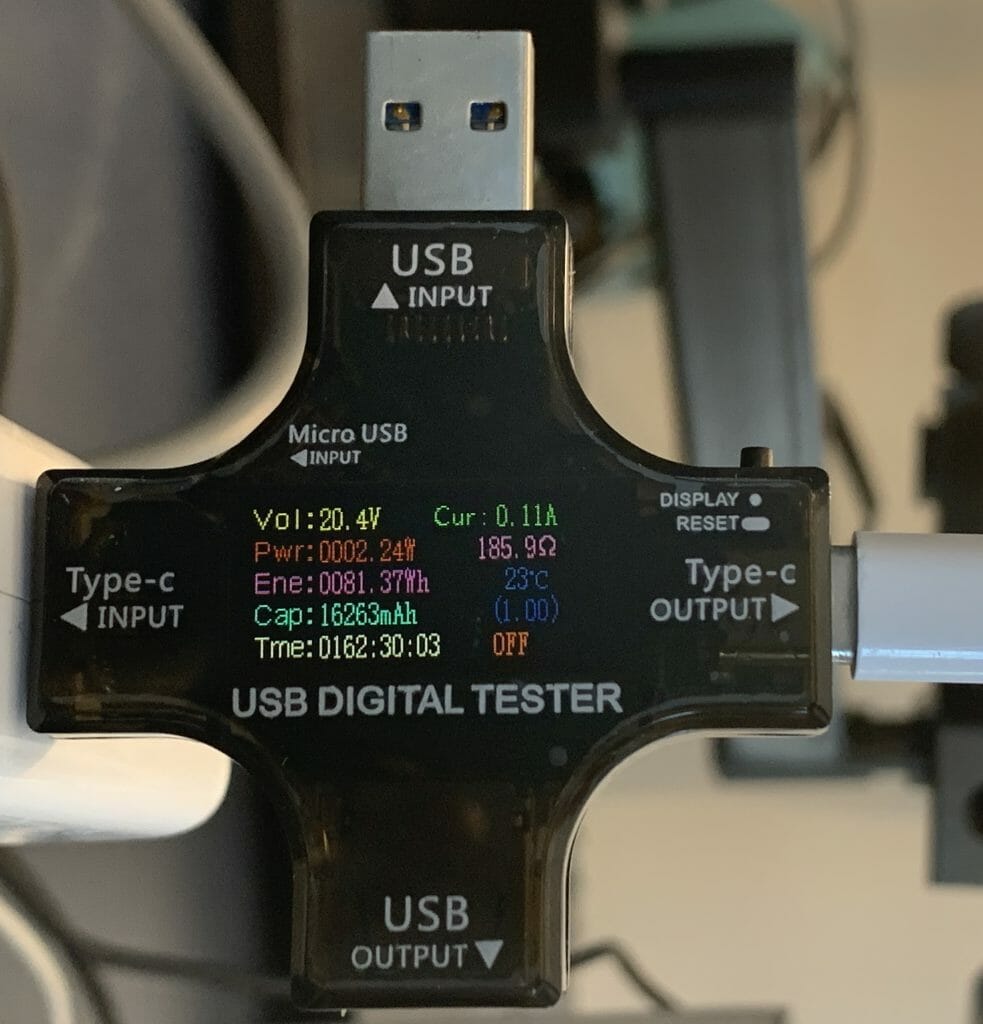
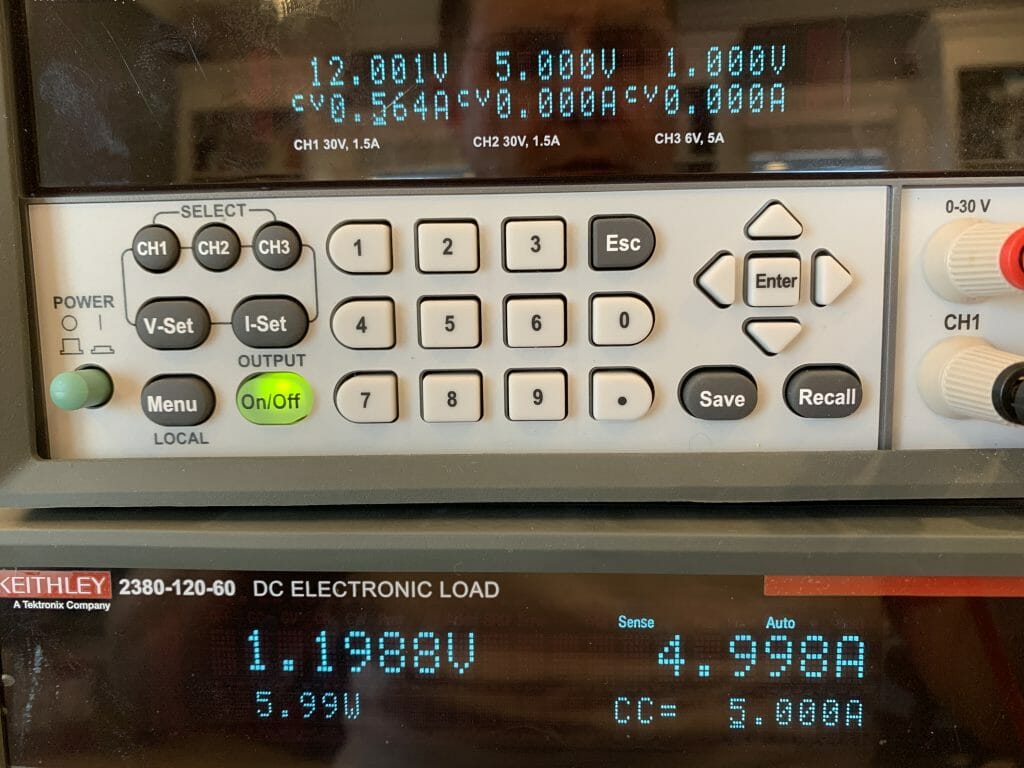
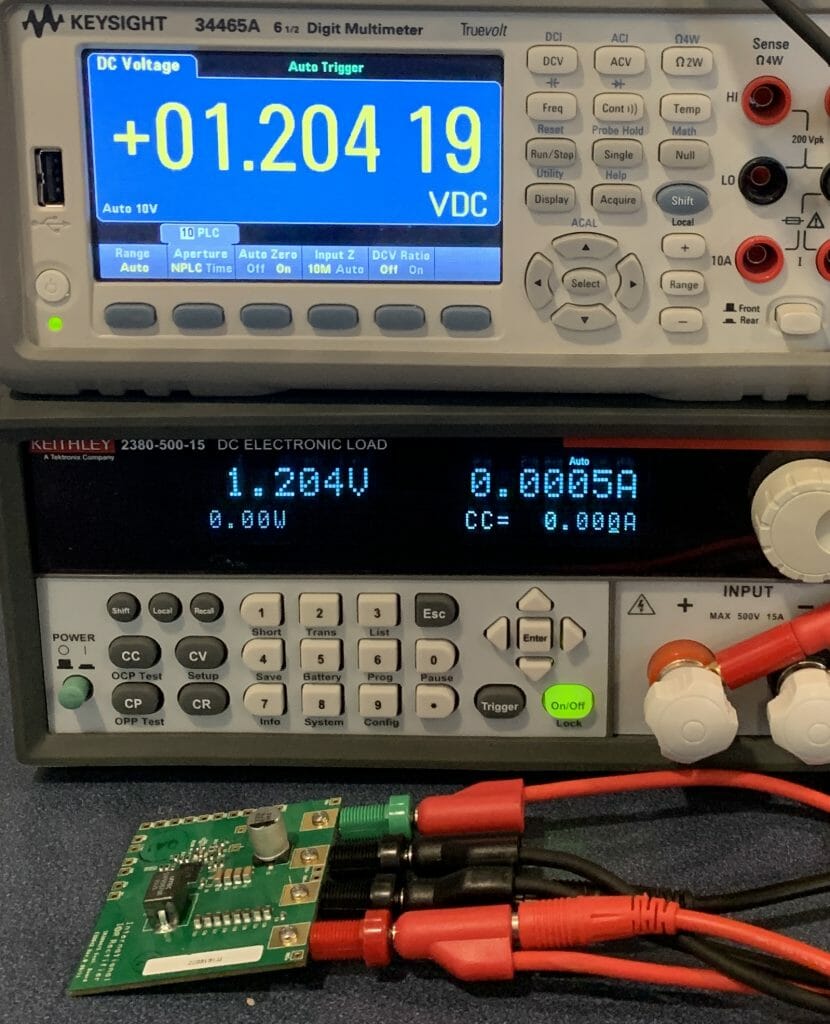
In my first setup I got this result:  The board is generating 1.2V (which you can see on the top DMM).  And the 2380-500-15 is showing 1.204V.  The same, thats good.

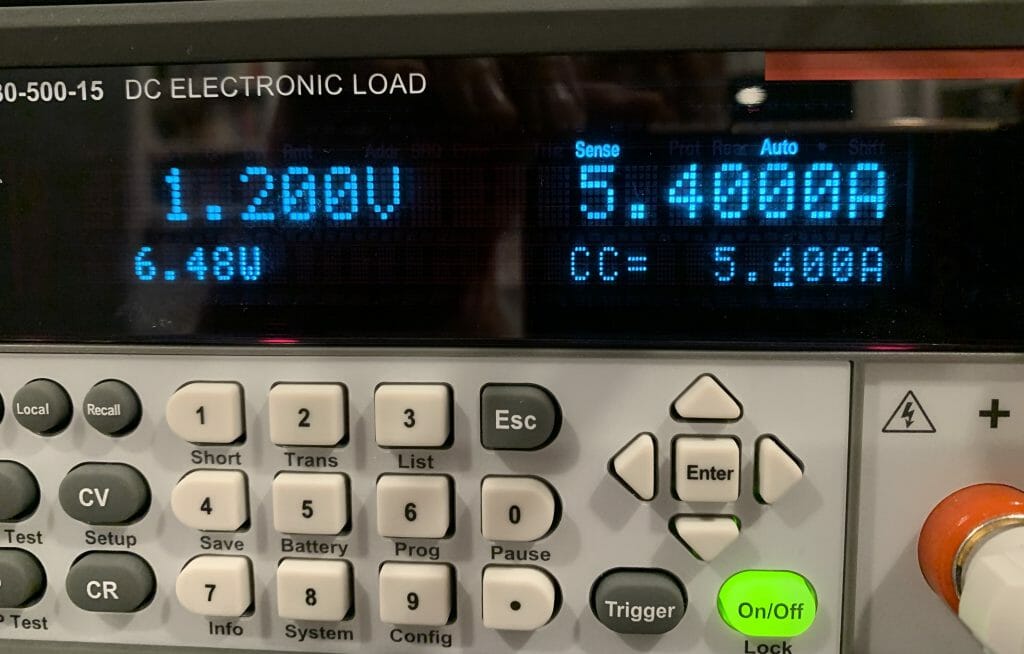
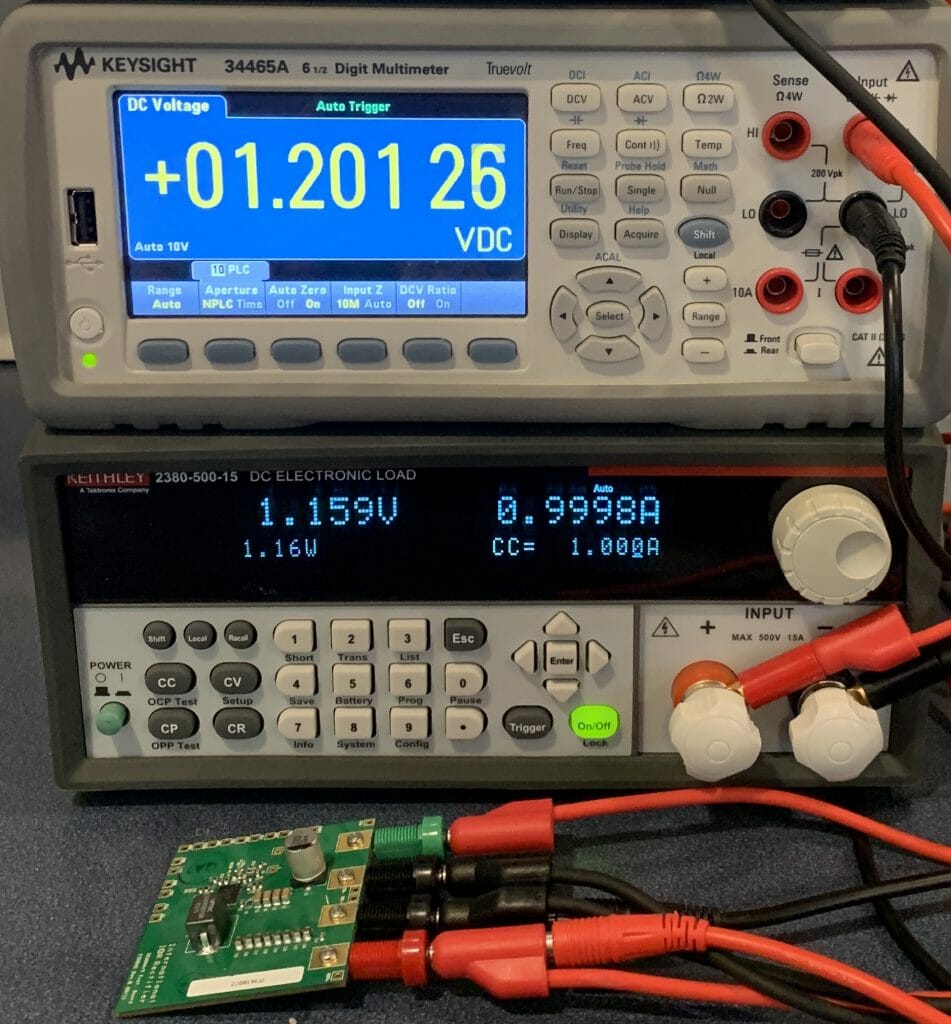
But, when I turn on the current to 1A you can see that the 2380-500-15 is showing 1.15V.  What happened?  Is the power supply drooping?

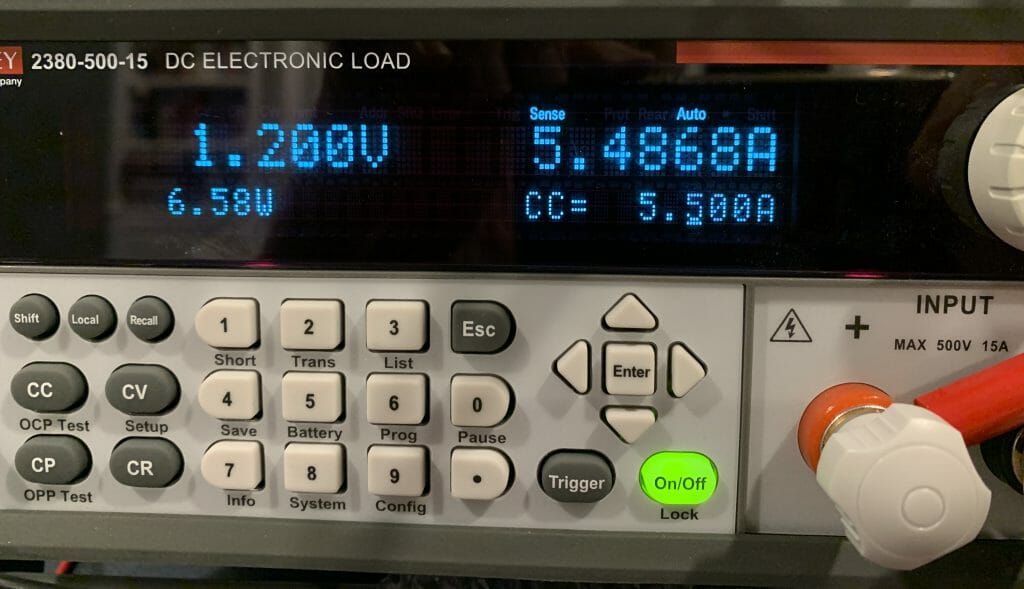
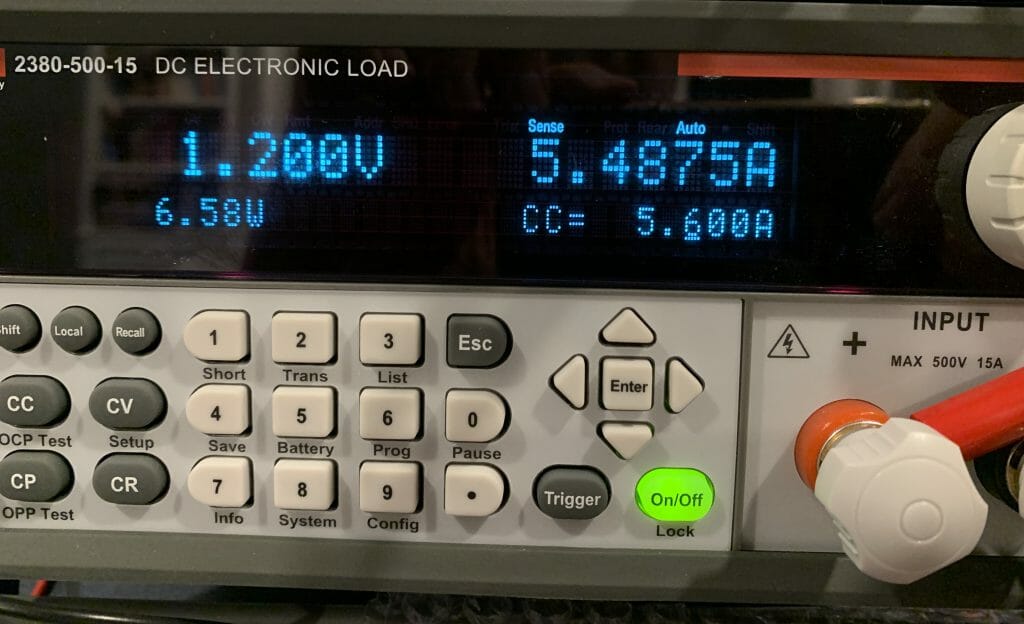
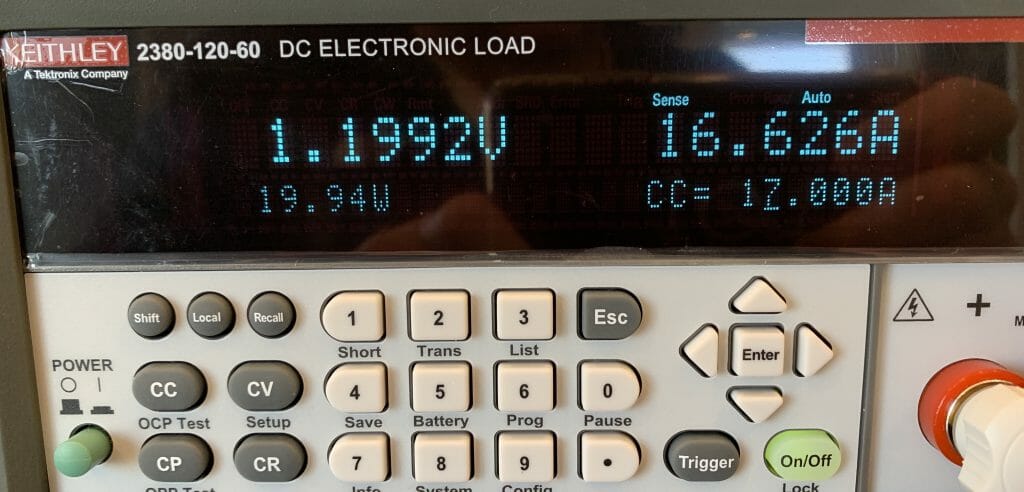
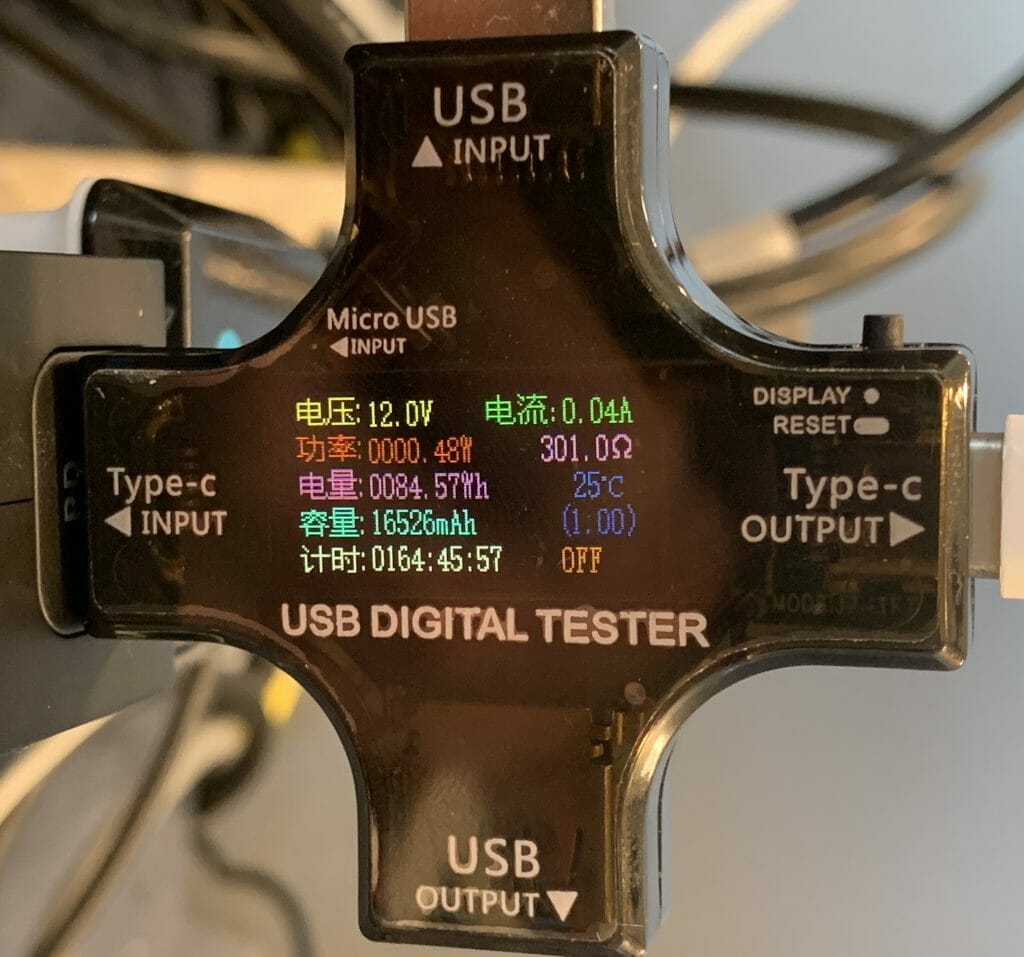
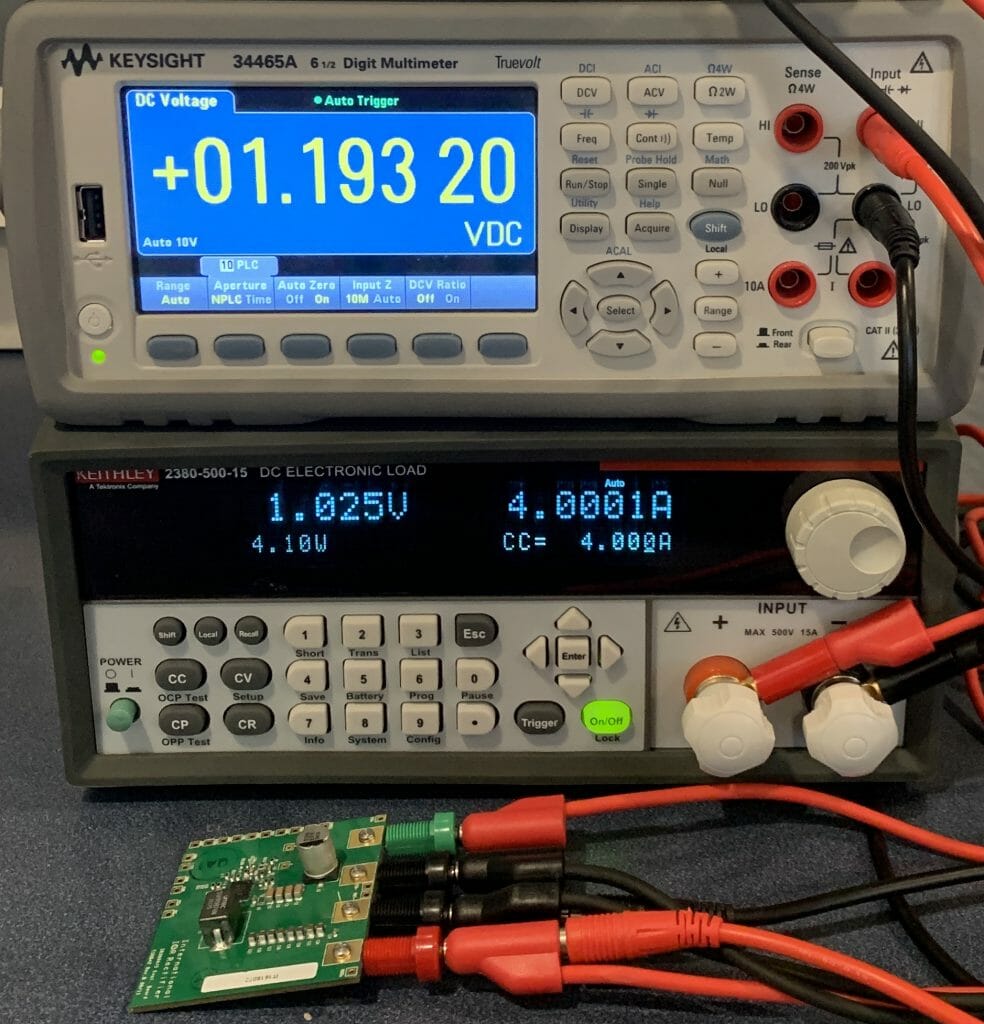
And it gets worse at 4A

So, I posted on the Tek Forum, and the excellent Tek engineer Andrea C. gave me an answer and posted a nice picture.  The problem is that my test wire to the 2380-500-15 has resistance and the voltage is dropping through the test wire.  You mean test-wires have resistance 🙂  Here is the picture that she posted.

The Solution

So, what is the answer to this problem?  Remote sensing which will display the voltage at the source instead of at the end of the wire.  In the world this method is more commonly called “4 terminal sensing” or “Kelvin Sensing”

The 2380 is capable of using this method.  And it is described (poorly) on page 52 of the user guide.  Here is the picture:

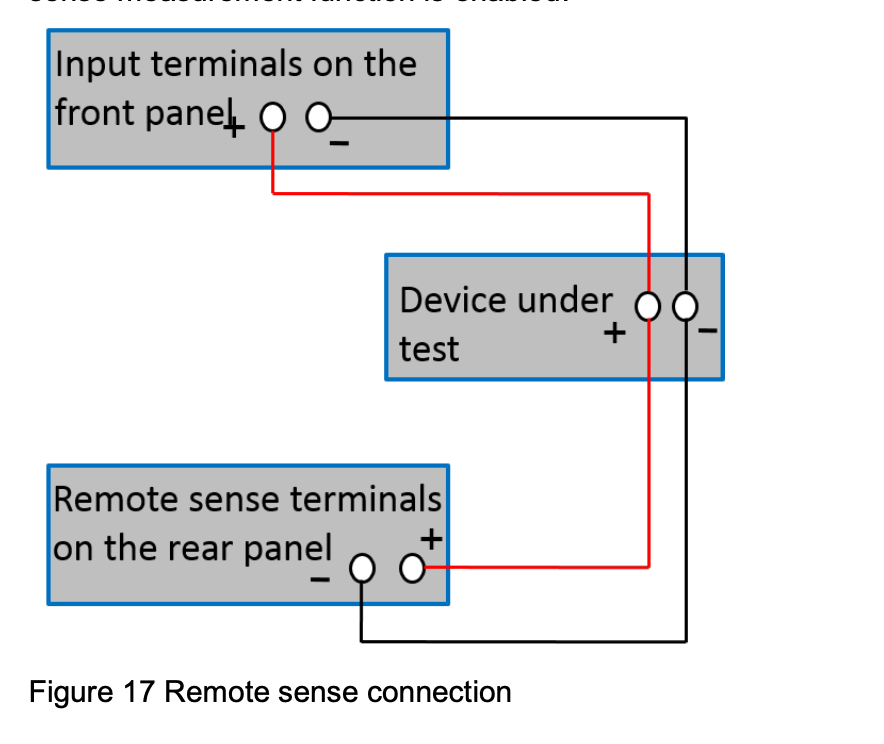
To make this work you need to do two things

  1. Attach two wires on the back panel sensing connection
  2. Switch the load into remote sensing mode.
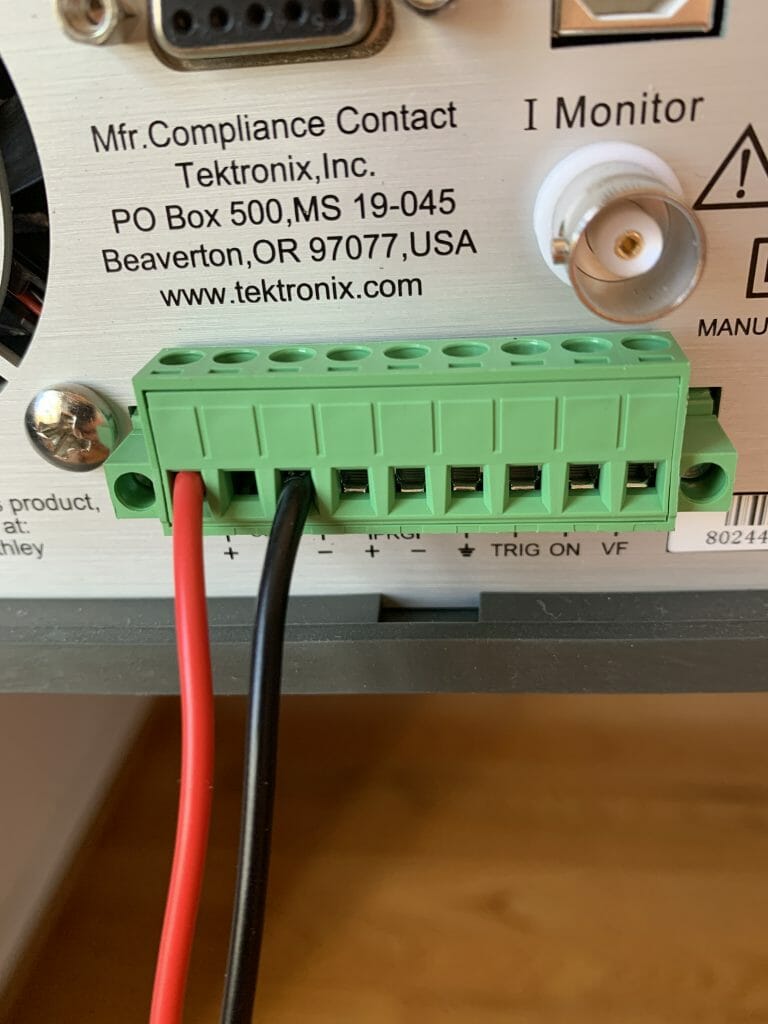
Back Panel

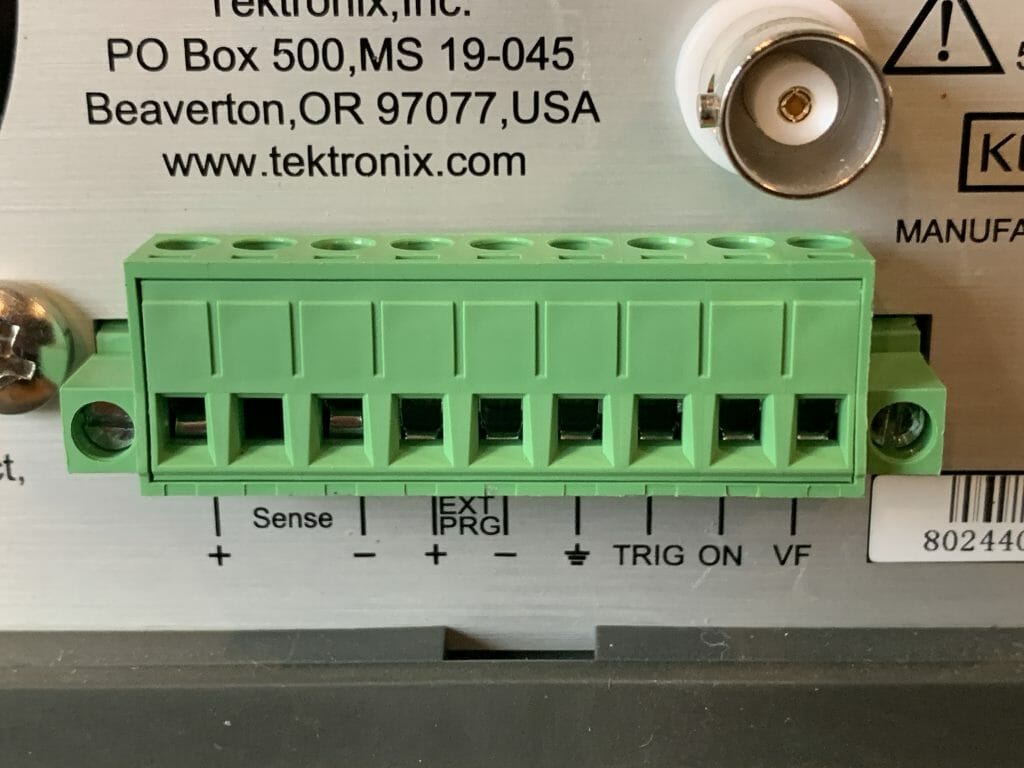
When you look at the back panel you see this crazy terminal block.  The first thing you notice is that some of the screw terminals are blocked by the BNC connector.  And the angle for putting a screw driver isn’t great.

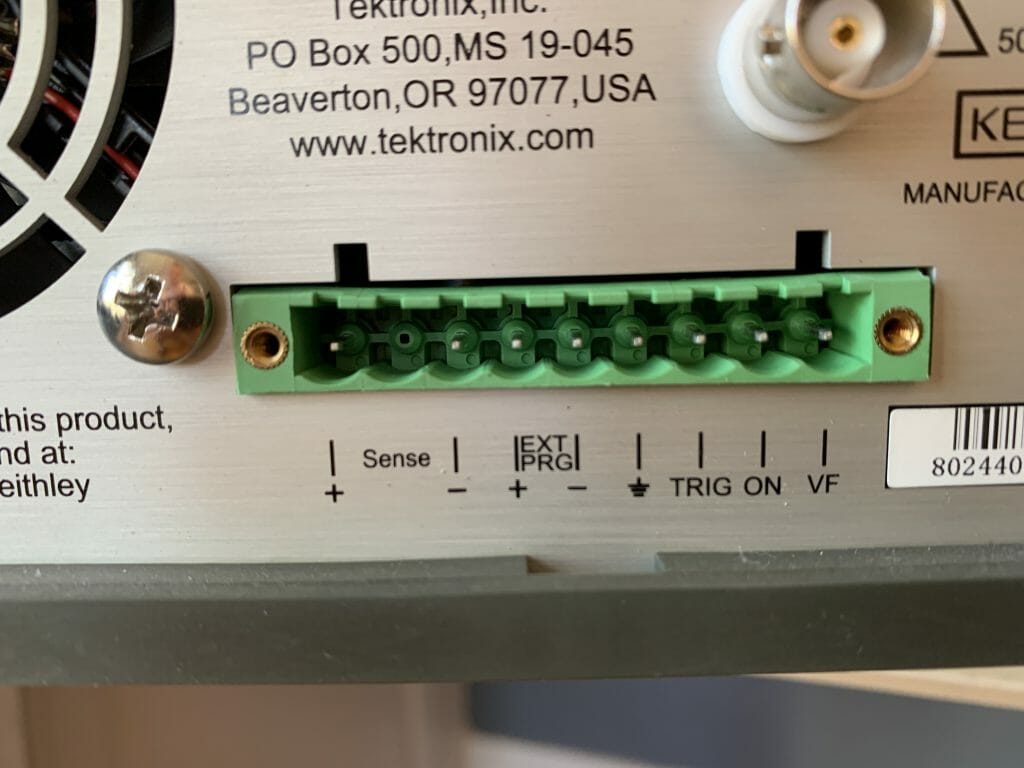
But, if you loosen the two flat head screws on the far left and right of the green connector, you will be able to pull it out.  It has a little bit of “snap” so you need to pull on it a bit (just with your fingers so you don’t break it).  You will then be able to see into the connector.

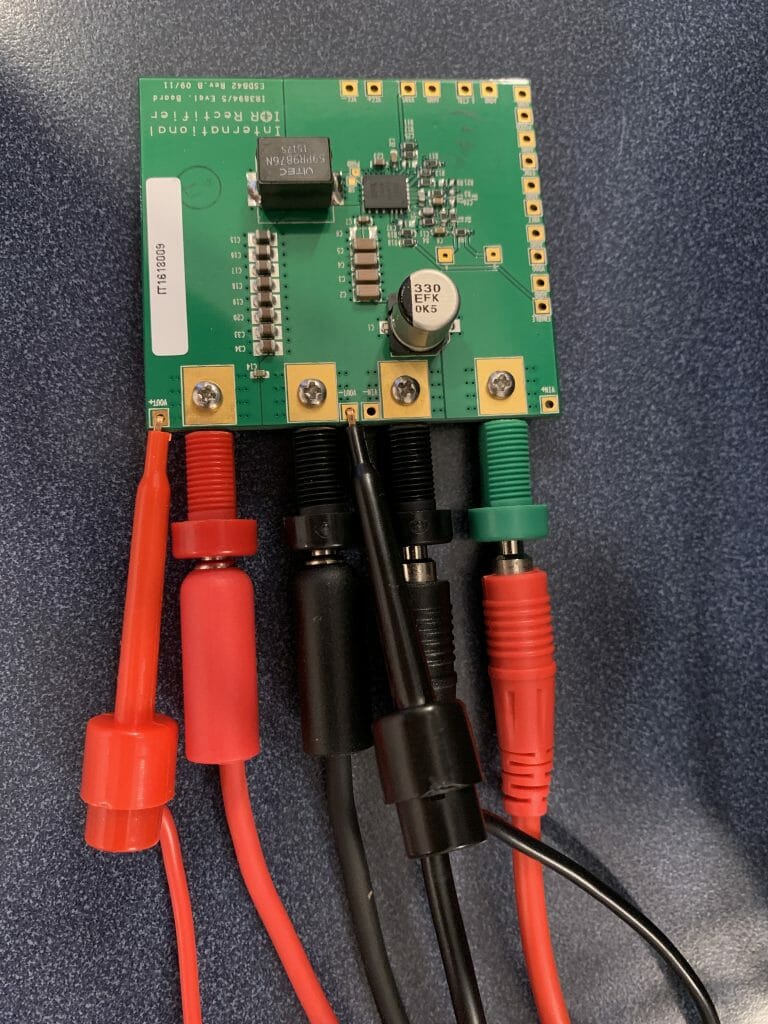
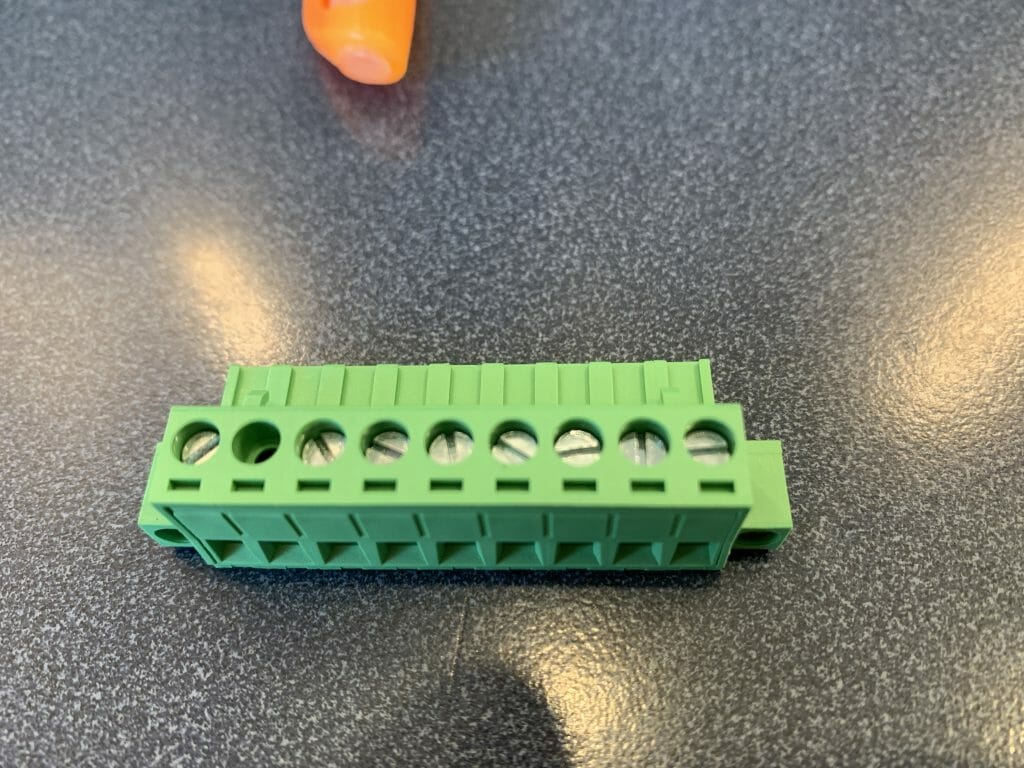
Here is what the green connector looks like once it is removed.

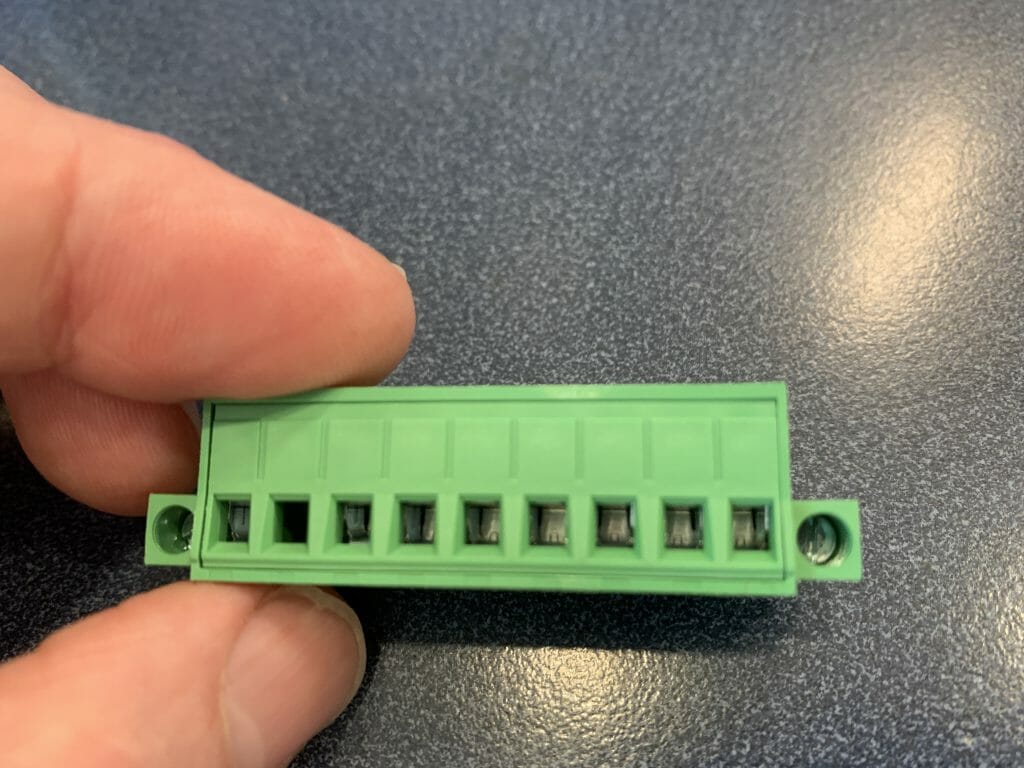
Notice that each of the terminals have a screw to tighten the corresponding wire.

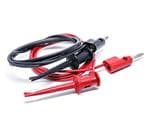
In order to hook to the screw terminals you need a cable.  I bought this one from Mouser

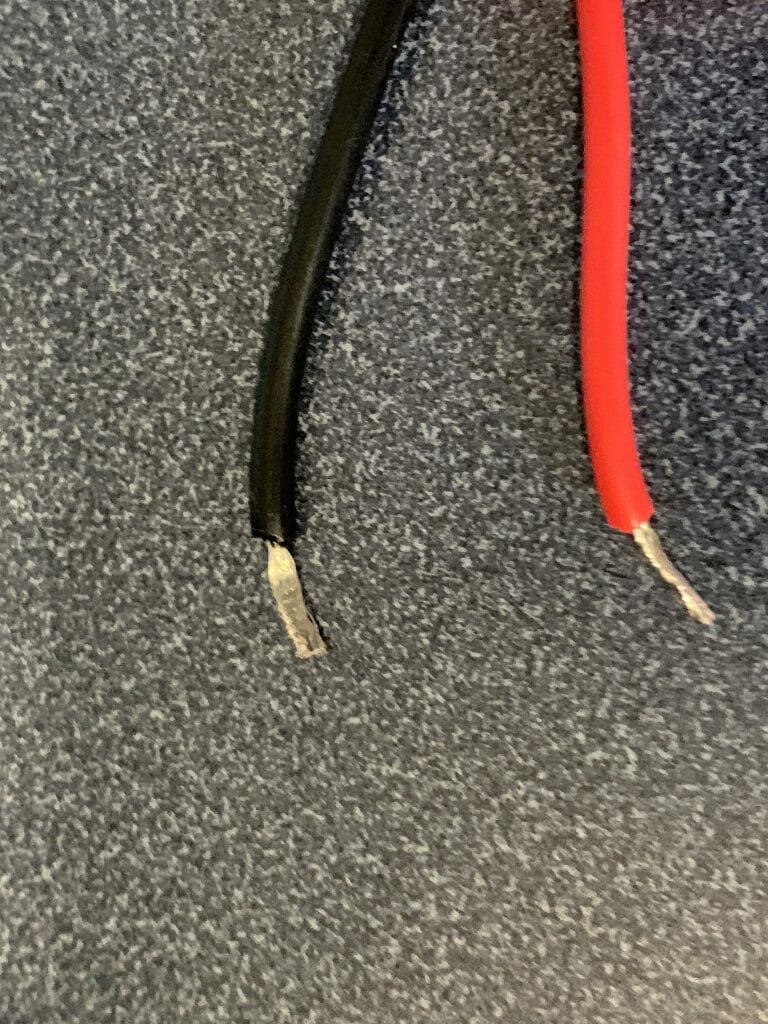
Then I clipped off the Banana plug, and tinned the ends of the wire with solder (you can see the black wire is a bit flattened because I took this picture after I unhooked the wire)

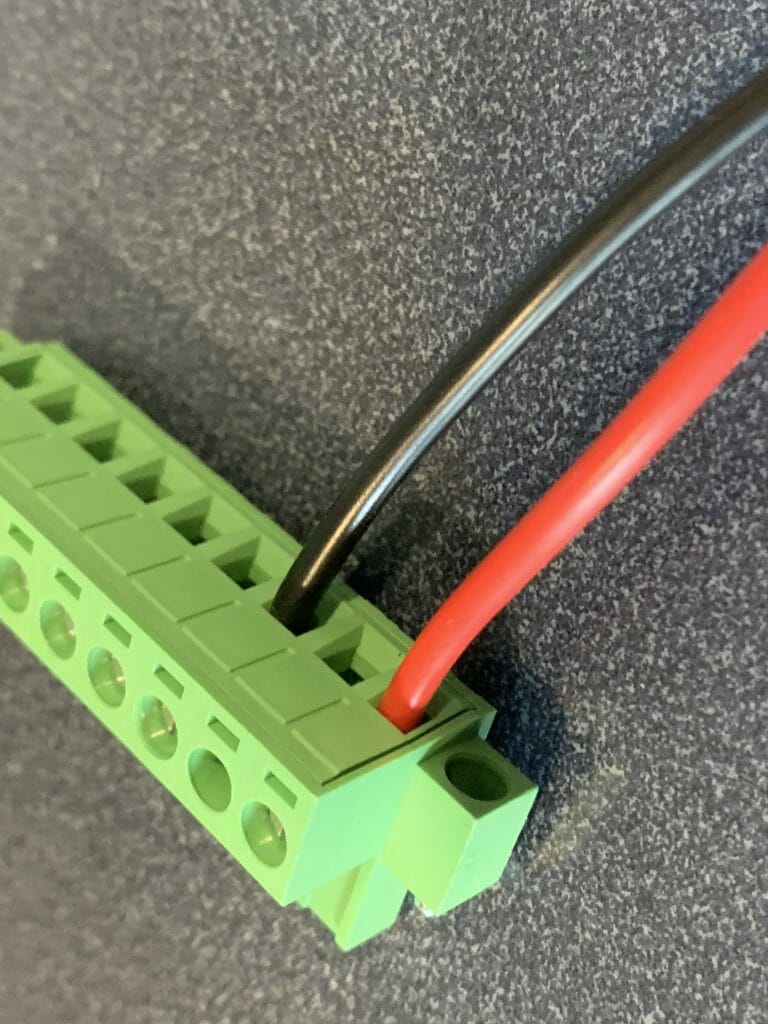
Then screwed the wires into the connector

Finally screwed the connector back into the meter.

Enable Remote Sensing

To enable remote sensing, the documentation tells you what to do:

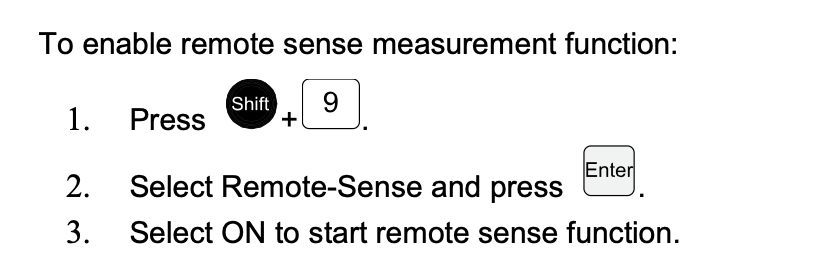
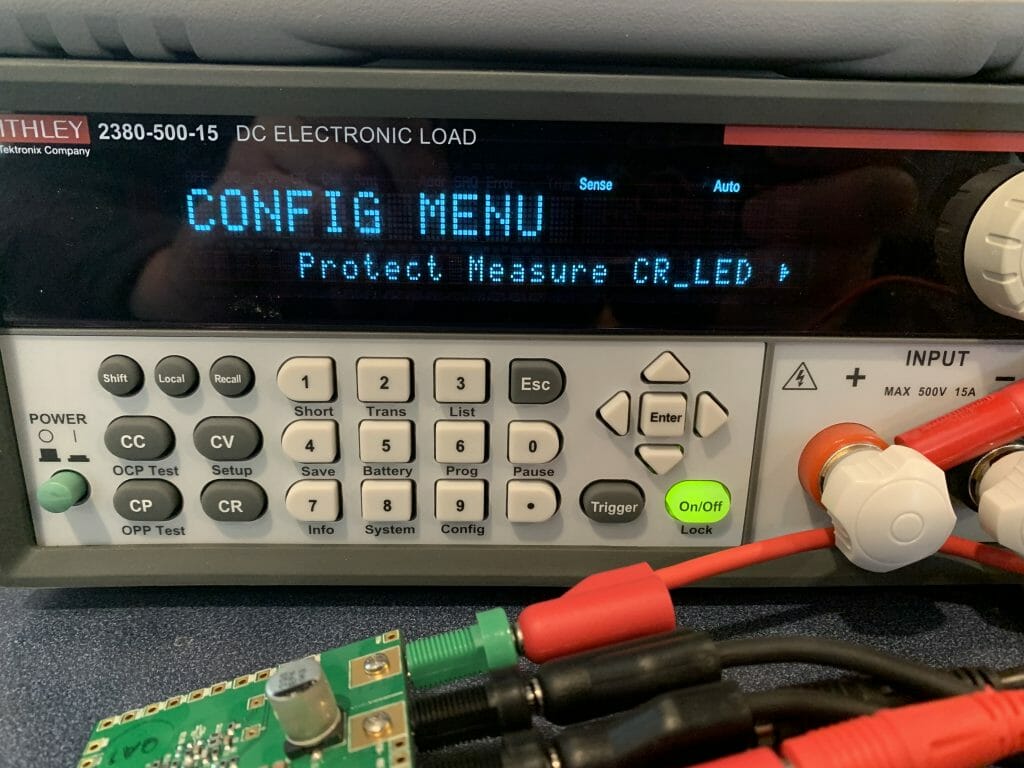
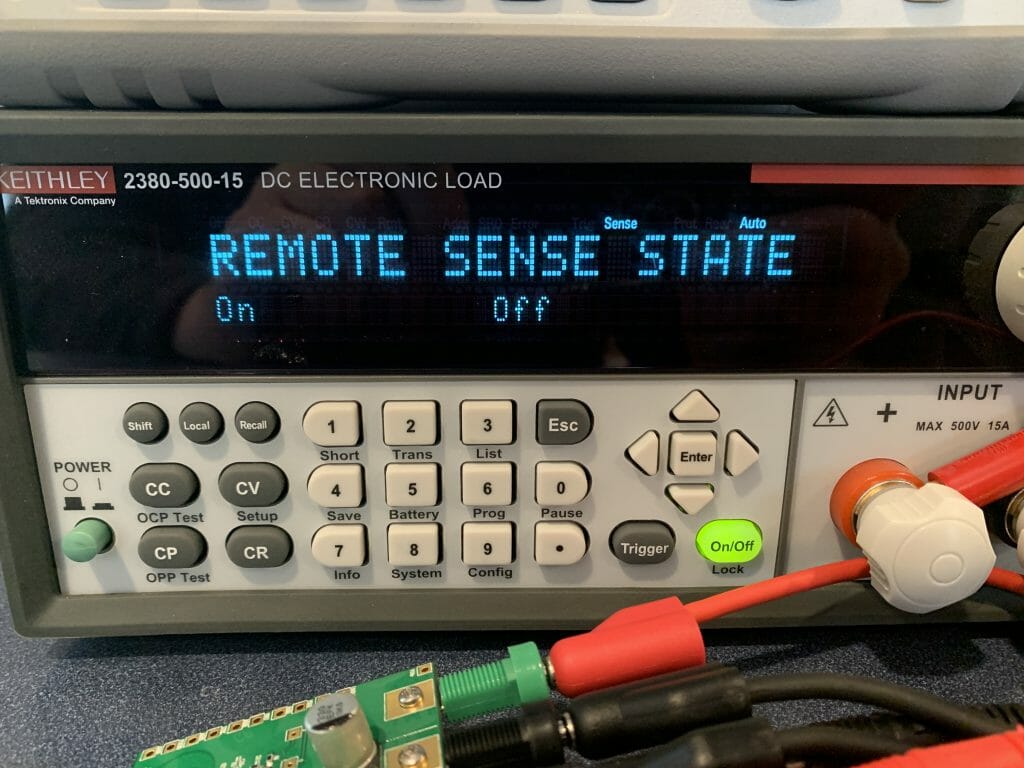
Here are pictures of the screens.  When you press Shift-9 you get this screen.  You need to press the “right arrow” to go to the next screen.

Select the “Remote-Sense” and press enter.

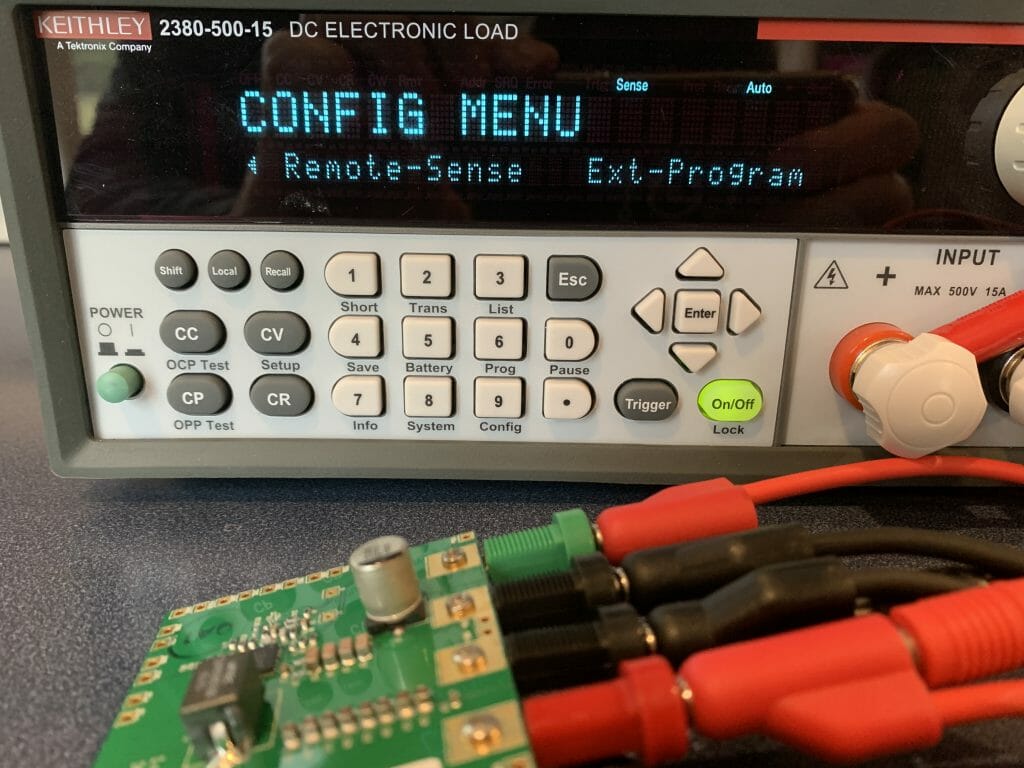
Use the left/right arrow to select “On” and press the “Enter”
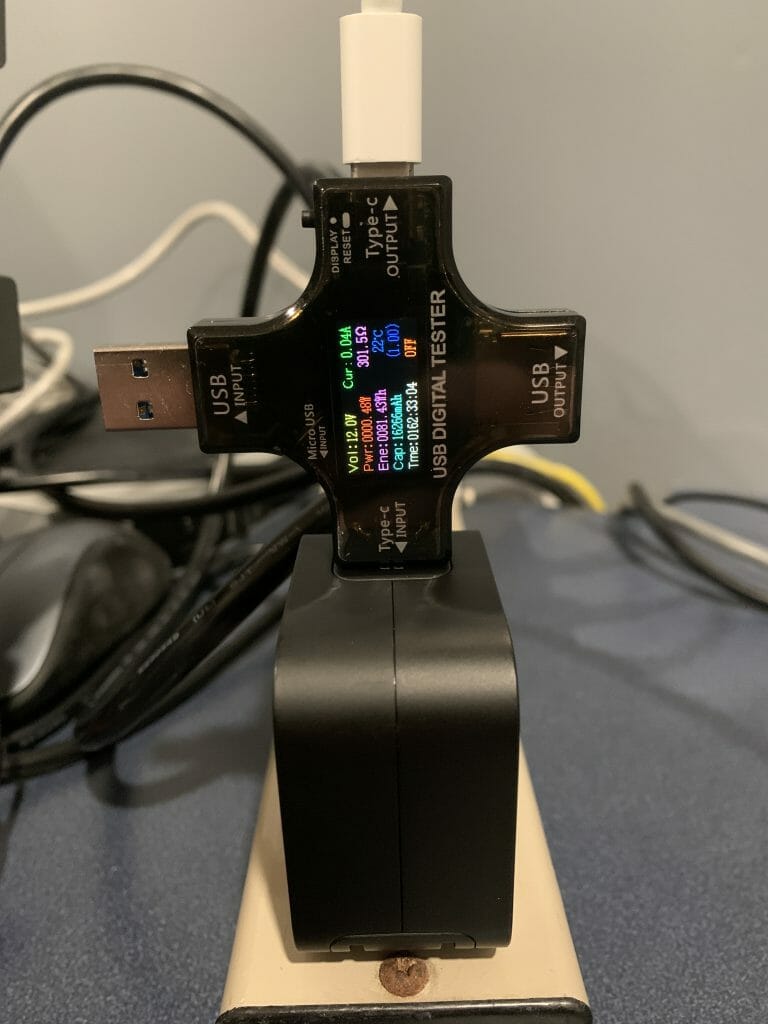
Results

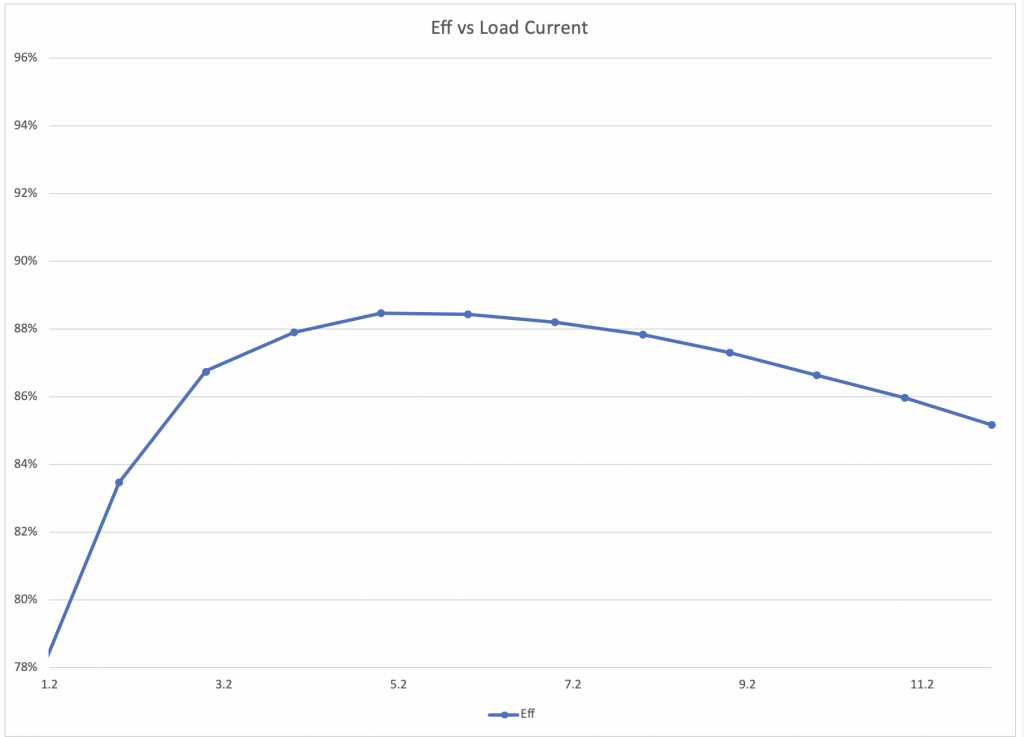
Now it displays “1.204V” which matches the DMM (well pretty close)