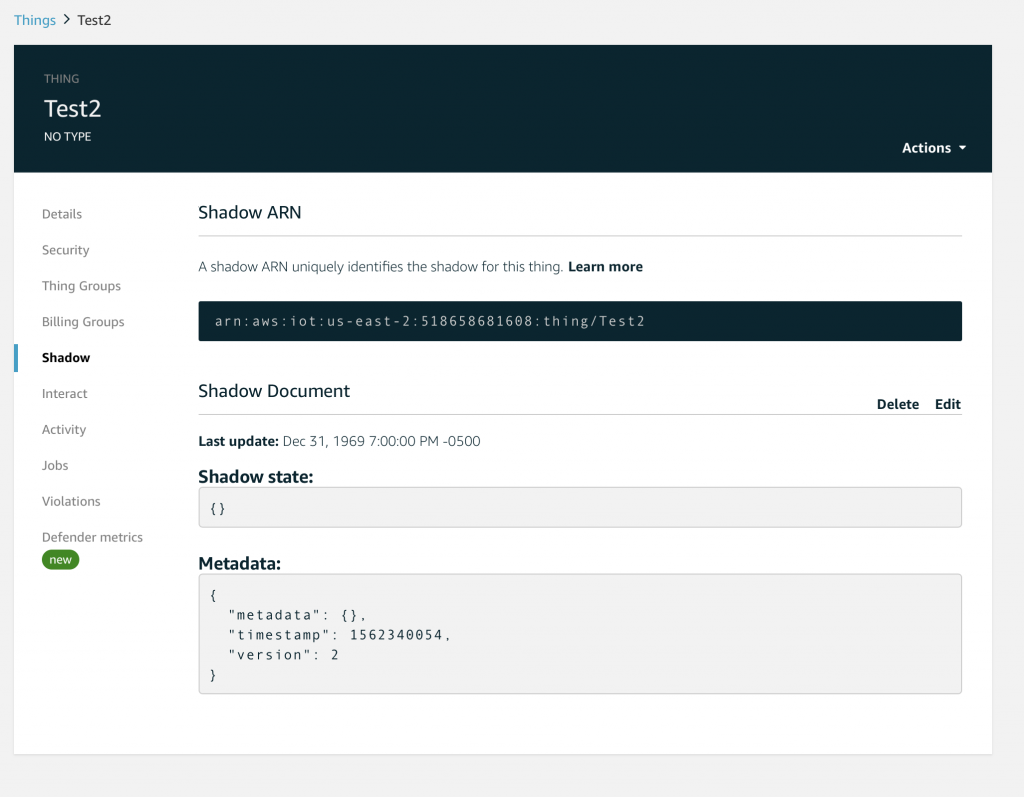
Amazon AWS Virtual Private Cloud (VPC)

Summary

In order to interact with AWS you need some basic understanding of how the Amazon Virtual Private Cloud (VPC) fits together.  I generally find that writing things down is a huge help in cementing my understanding of a topic.  For me, that is the point of this article, making sure that I understand how the AWS VPC fits together.  I will preface all of this by saying that I am hardly an AWS networking expert so your mileage may vary but I hope that it helps you understand. For some reason, I mostly dug around inside of the AWS console to figure it out before I realized that there is a huge amount of documentation and tutorials out there.  At the end of this article I will link to the documentation etc. that I thought was useful.

The sections of this article are:

  • Overview of AWS VPC Architecture
  • Region
  • VPC
  • Availability Zone
  • Subnet
  • Internet Gateway
  • Routing Table
  • Network ACLs
  • Security Group
  • Subnet group
  • A Stern Warning
  • Documentation and References

Overview of AWS VPC Architecture

Amazon Web Services (AWS) is divided into 16 Regions (for now).  In any Region, you can create a Virtual Private Cloud (VPC) essentially a private network for you to attach AWS services to e.g. EC2 or RDS.  In each Region there are several Availability Zones, which you can think of as completely independent, physically separate, redundant computer rooms.  Although these Availability Zones are independent, they are also closely linked from a network standpoint.  A subnet is just a IP address range of a related group of servers that must fit completely in one unique Availability Zone.  In your VPC you should have at least one subnet per Availability Zone .   Each subnet is connected to your VPC by a routing table which can be shared by one or more subnets.  In other words, your subnets are connected together via routers and you control the routing tables. Your VPC can be connected to the public internet via up to one Internet Gateway.   In the routing table, you optionally specify a route to the public internet, which creates a public subnet.  If there is no route to the internet then the subnet is considered a private subnet.  Each subnet has an optional Network Access Control List (ACL) which allows you to secure that subnet by IP address and IP Port number.  A security group is an instance (server) level of access control – just like a ACL but on a server by server level.  It is called security group because you can apply the same list of rules to multiple servers.  Missing from the diagram is a subnet group.  A subnet group is a just a named list of subnets.  Subnet groups are used by some of the AWS systems e.g. RDS to choose which subnets to attach to.  I will talk in more details about them in the RDS article.

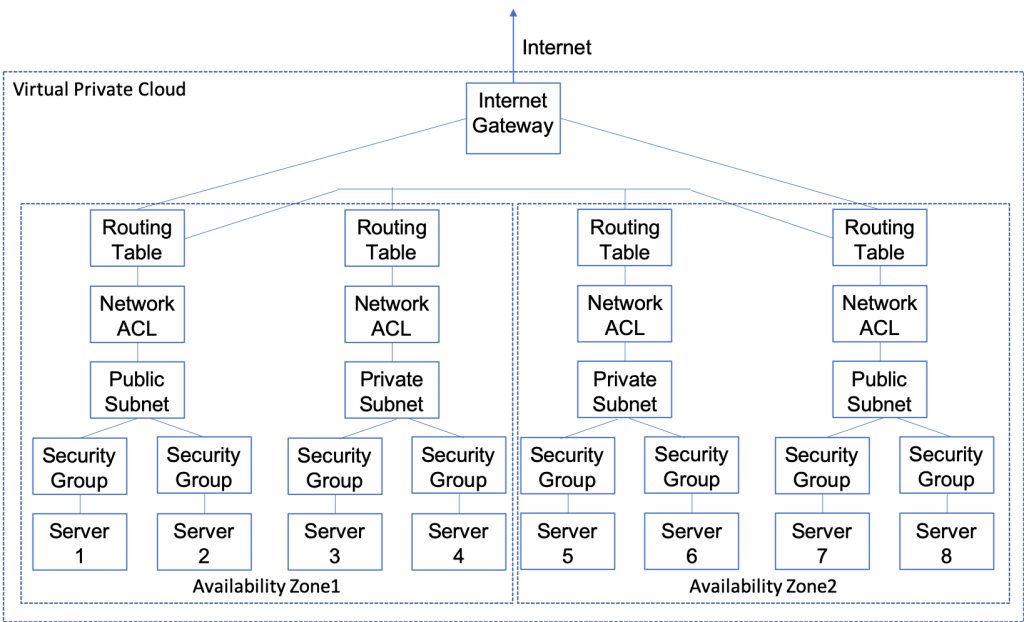
The picture below is a LOGICAL diagram to show how data flows inside of the VPC. You can see that I have two availability zones, each with a public and a private subnet.   Each subnet has it’s own routing table and network access control list.  And there is one Internet gateway which is routed to the two public subnets.  There are 8 servers which are attached two each of the subnets.  Each server has a security group.  The main point of all of this is that for devices to talk all of these things need to be configured correctly.

  • Internet gateway
  • Routing tables
  • Network ACLs
  • Security Groups

I guess the good news is that when you create an AWS account it default configures all of this stuff to a semi-sensible starting point.

Region

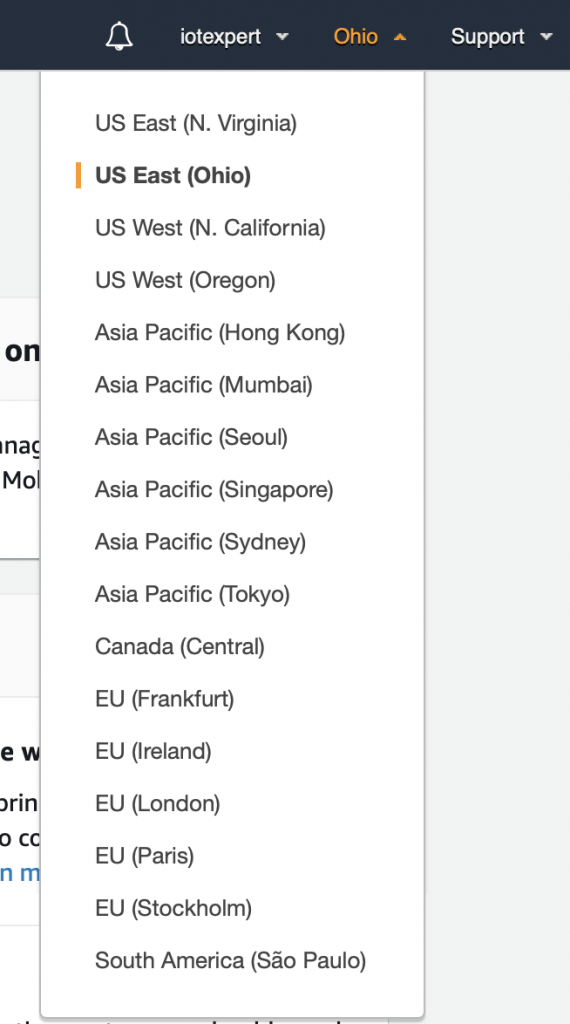
When you create your AWS account Amazon will select a default region for you.  When you are logged into the console you can see your region in the upper right.  In this case my region is Ohio.

When you click on the region you can see all of the available regions.  Currently, there are 16 of them.

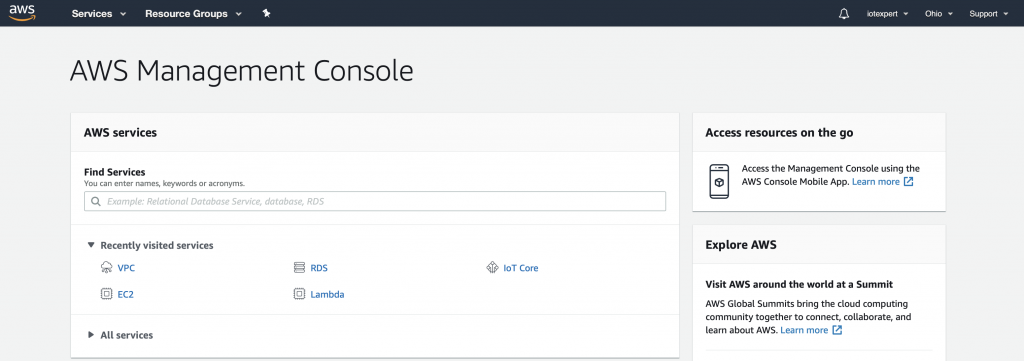
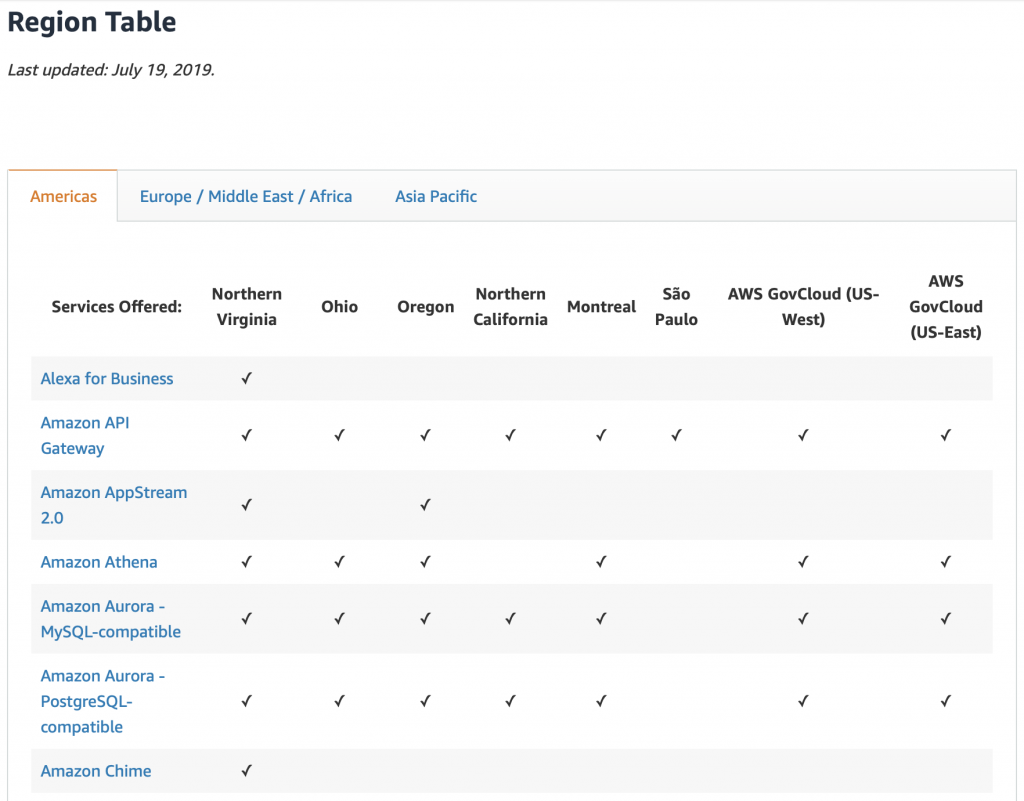
Each region has different services available.  You can see the whole list here.  But this is a snapshot of the top of that page.

Virtual Private Cloud (VPC)

The Amazon marketing material has a nice description of the VPC. “Amazon Virtual Private Cloud (Amazon VPC) lets you provision a logically isolated section of the AWS Cloud where you can launch AWS resources in a virtual network that you define. You have complete control over your virtual networking environment, including selection of your own IP address range, creation of subnets, and configuration of route tables and network gateways. You can use both IPv4 and IPv6 in your VPC for secure and easy access to resources and applications.”

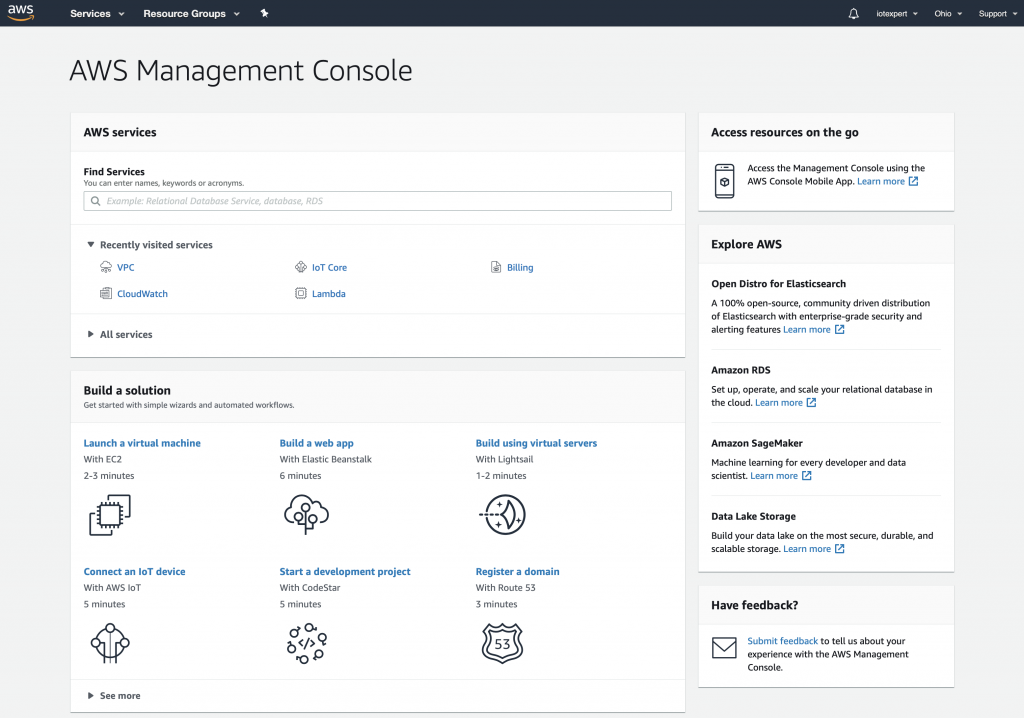
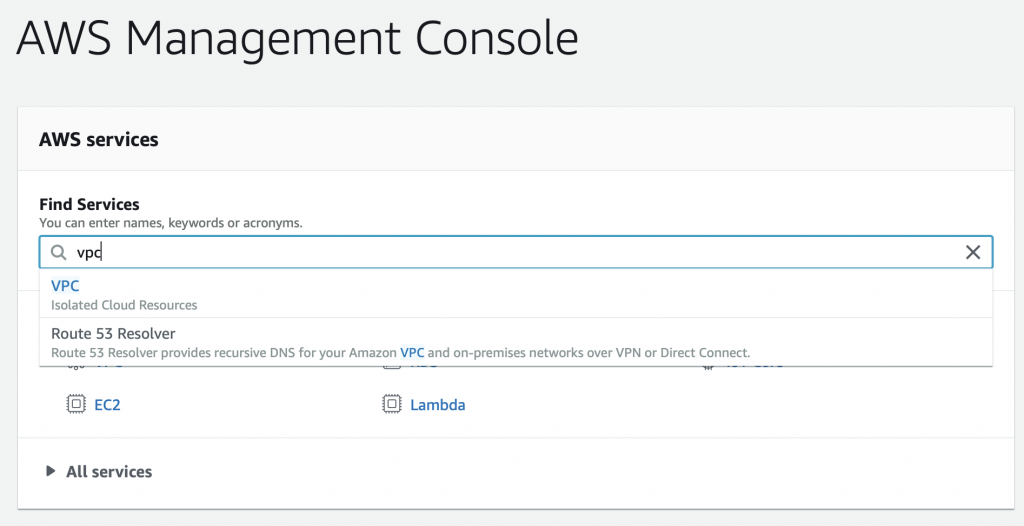
In any one region you can have up to 5 separate VPCs (at least without special $$s to Amazon).  Each VPC has a control console that lets you edit, update, and manage the configuration of your VPC.  You can get to it from the AWS management console.  Search for VPC.

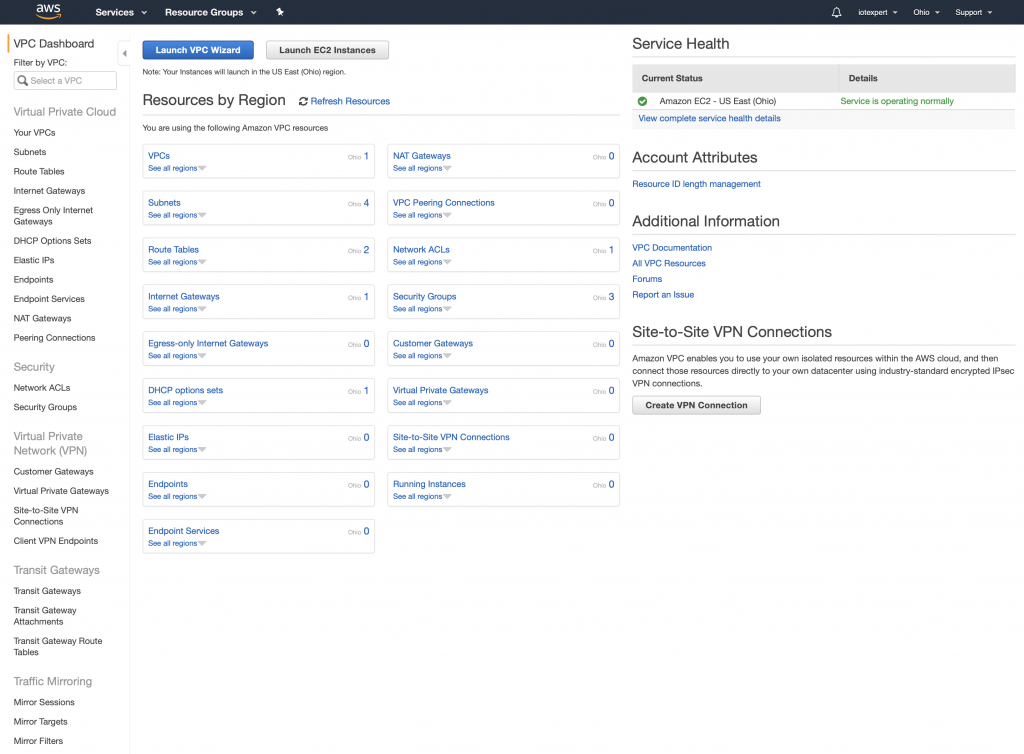
When you get there it should look something like the picture below.  Notice down the left side of the screen are the different sections to control the various attributes of your VPC.  In the picture you can see that I have 1 active VPC and it is in Ohio.  My VPC has 4 subnets, 2 routing tables, 1 internet gateway, 1 network ACL, 3 security groups etc.

In the console when you click on “Your VPCs” you will see a screen that looks like the one below.  When you signed up, Amazon automatically created a VPC for you in the region that you selected. Which you probably didn’t realize – or at least I didn’t realize at the time.  The VPC console gives you information about your VPC including

  • CIDR IPV4 Networking information (in CIDR Blocks)
  • DHCP Options
  • Routing Table (i.e. the default routing table)
  • Network ACLs

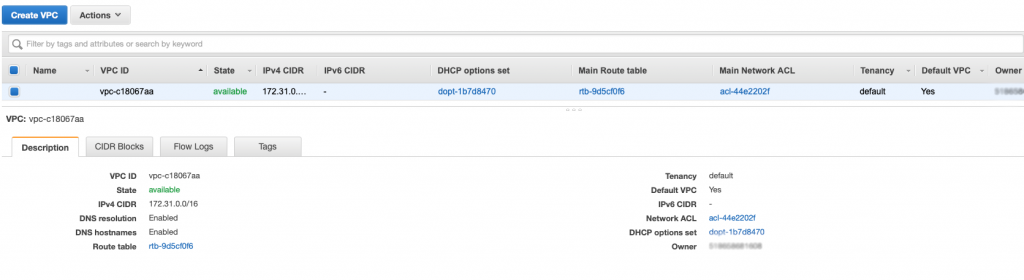
If you want to create a new VPC the only information you really need is what network do you want to use.  When the original VPC was created by Amazon, the default picks are a private network range, 172.31.0.0/16.  I know that you can also create network in the 10.0.0.0. Your network must have 16-bits of network address.

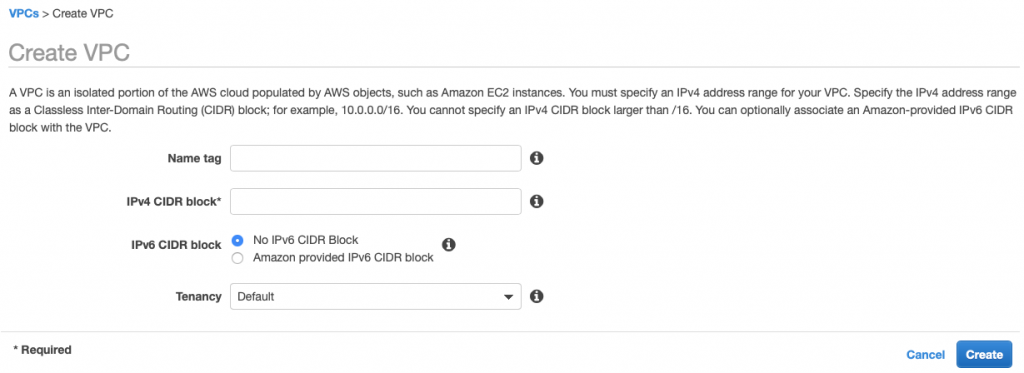
If you decide to create your own VPC you will basically only need the IPv4 CIDR (aka network) for your VPC.

Availability Zone

The AWS documentation says that  “… Availability Zones are the core of our infrastructure architecture and they form the foundation of AWS’s and customers’ reliability and operations. Availability Zones are designed for physical redundancy and provide resilience, enabling uninterrupted performance, even in the event of power outages, Internet downtime, floods, and other natural disasters.”

Each Region has several availability zone that are closely connected but isolated.  I am using the Ohio Region (aka us-east-2) which has three availability zones:

  • us-east-2a
  • us-east-2b
  • us-east-2c

There is no sub-menu for Availability Zones.  The way you control the Availability Zones is by creating subnets in the intended Availability Zone and then assigning resources to the intended subnet.  In order to control your subnets click on “Subnets”…

Subnet

… which will put you on a subnet screen that looks like this:

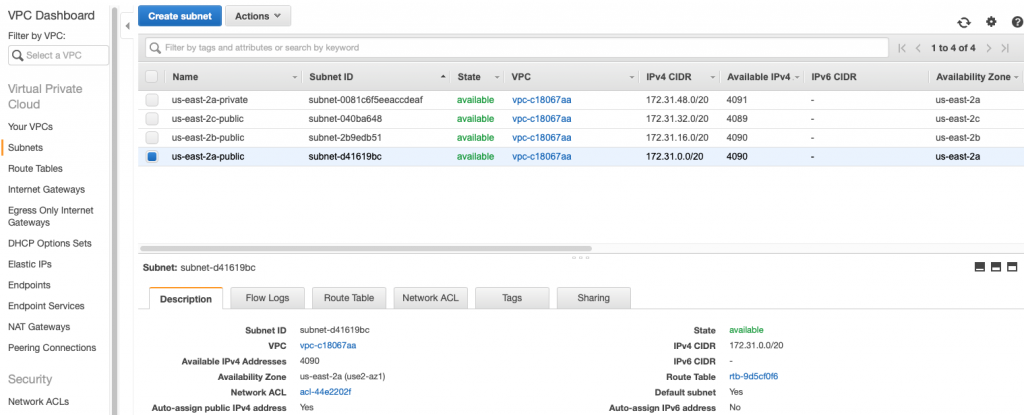
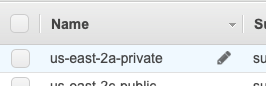
Notice that I have four subnets.  Three of them were created automatically for me by Amazon (the ones with the short Subnet IDs).  The “name” of the subnet is assigned by you, or in this case, were assigned by me.  When you hover over the name of the subnet it will put a little pencil icon on the name.  When you click it, you will be able to type a new name for the subnet.  The names don’t mean anything in the system.  They are for your use only when you are assigning resources etc.

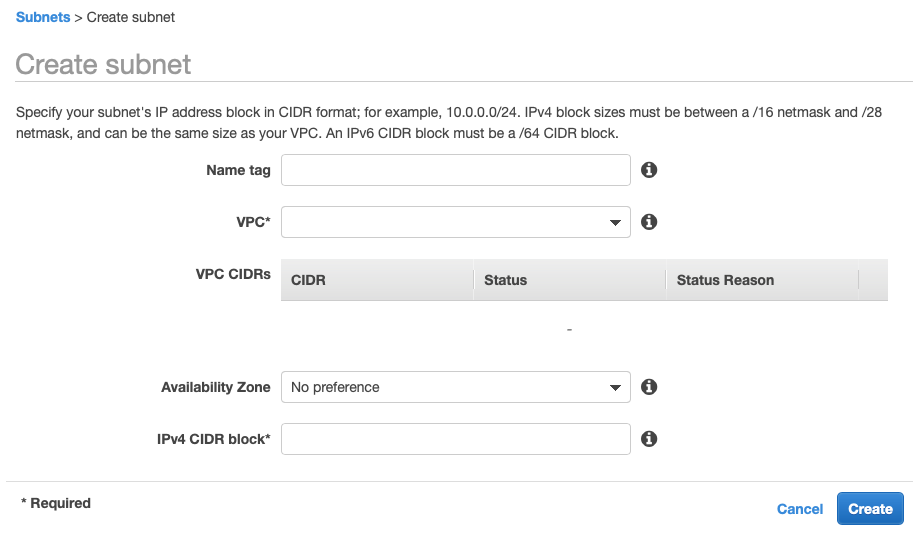
When you create a subnet you will need to specify the network CIDR range.  Notice that all of mine are 20-bit network addresses starting with 172.31.0.0 and going up from there.  To add a new subnet click on “Create Subnet” where you will brought to a screen like this.  The two really interesting things on this screen are your ability to specify the network CIDR, and the Availability Zone.  A subnet must reside completely in one Availability Zone.

Internet Gateway

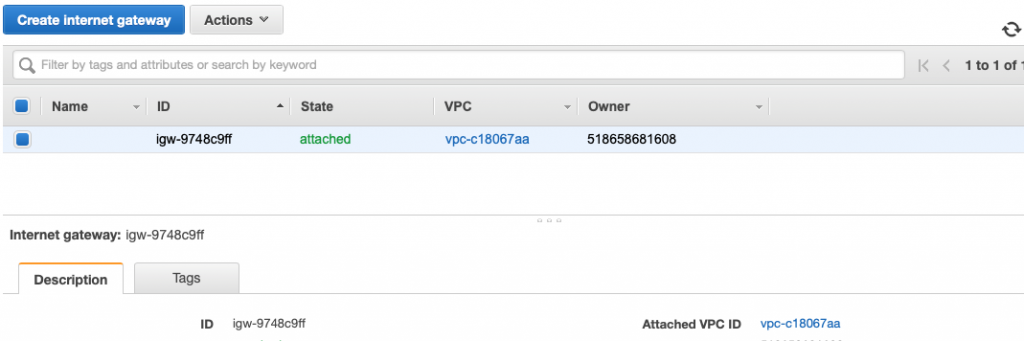
You can think of the internet gateway as a device that is attached to your VPC network.  Each of the subnets are allowed to route packets to the Internet Gateway.  When you configure the routing tables for your subnets, you will specify the internet gateway as the destination for packets that you want to go out onto the network e.g. 0.0.0.0/0 (meaning any device).  In terms of configuration, there isn’t much, just tags which are used only for your searching purposes.  The last thing of note with the internet gateway is that there can be only one attached to your VPC.

Routing Table

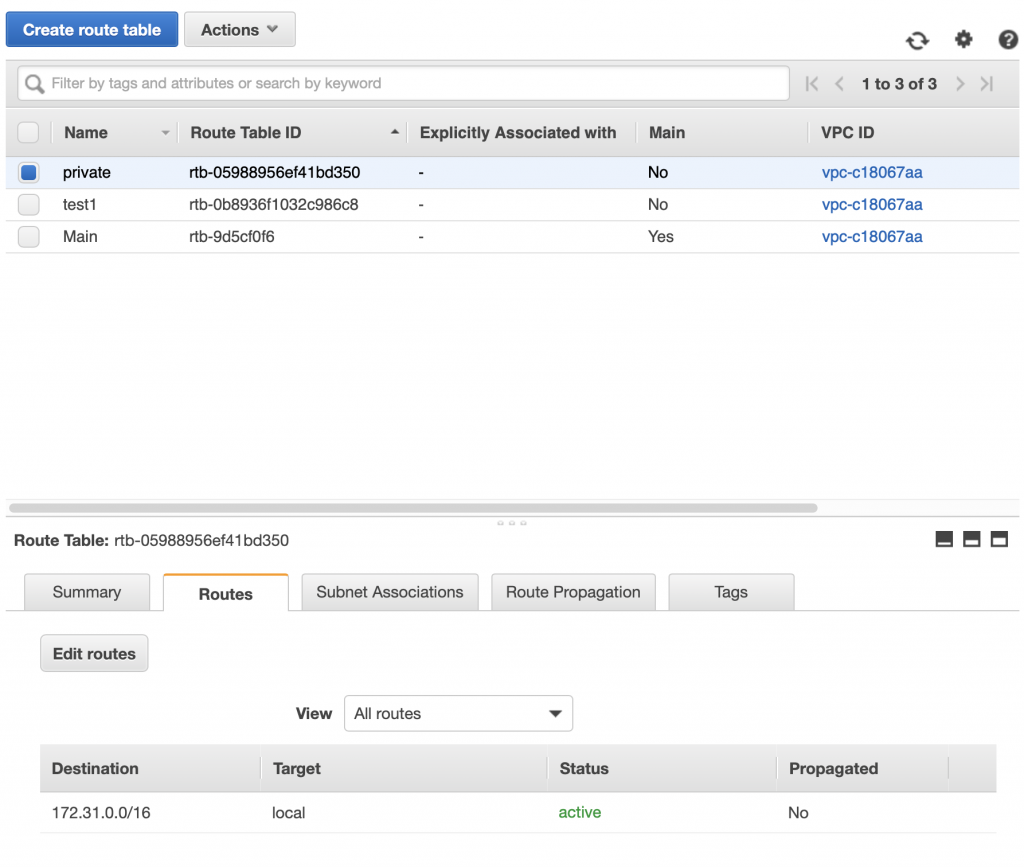
When you click on Routing Table, you will see a page like this one.  You can see in the picture that I have two routing tables.  The first one is called “Main” and is amazingly enough called the “Main” routing table, imagine that.  You can see the routes at the bottom of the picture.  The first one say that all of the 172.31.0.0/16 routes are local.  The second route says that any packets going to 0.0.0.0/0 (meaning any device on the network) should be sent to the internet gateway.

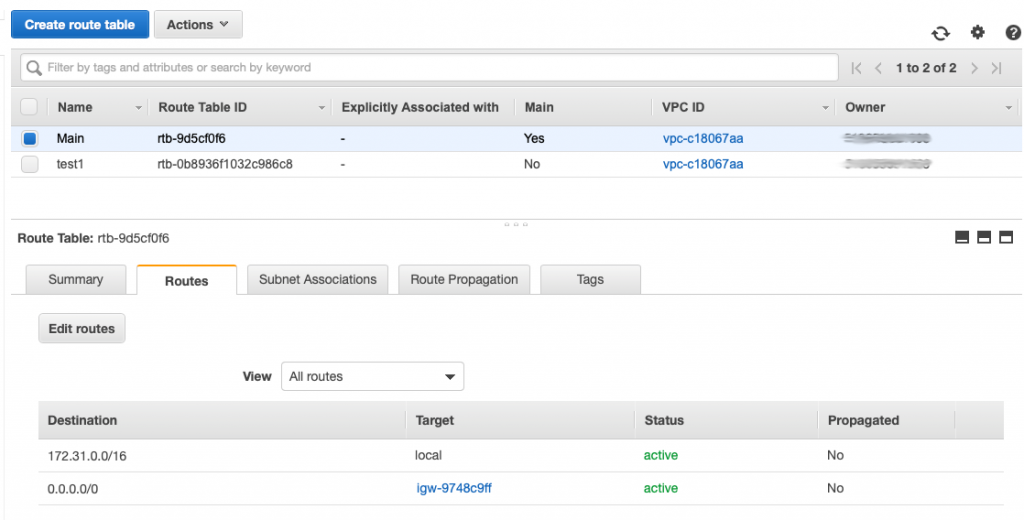
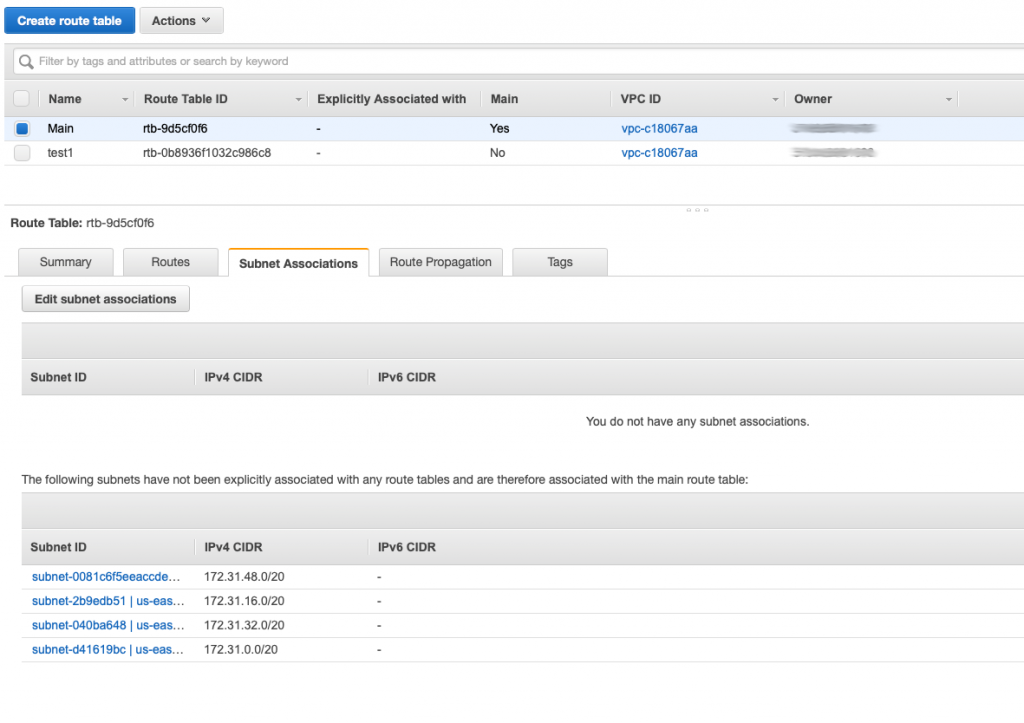
This routing table probably should have been called the default routing table as it is by default attached to all of the subnets in your network.  When you click on the “Subnet associations” you can see that it is by default attached to all of the subnets in my network.  When a subnet is not explicitly attached to a network by you then it adopts the Main routing table.

By definition any subnet that is attached to a routing table that has a route to the internet gateway is called “Public” and any subnet that doesn’t have a route to the internet is called “Private”.  Why would you want a private network?  Simple, imagine that a database server should only be accessed by servers that are in your VPC and should not be accessible by devices on the public internet.

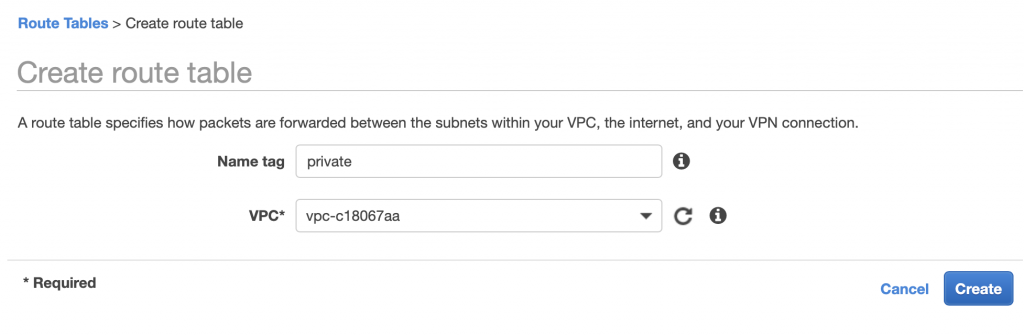
If I wanted to create a “private” routing table I would first click create and then give the new table a name.  In this case “private”

After I click “Create” I will have the net routing table.  You can see it in the picture below.

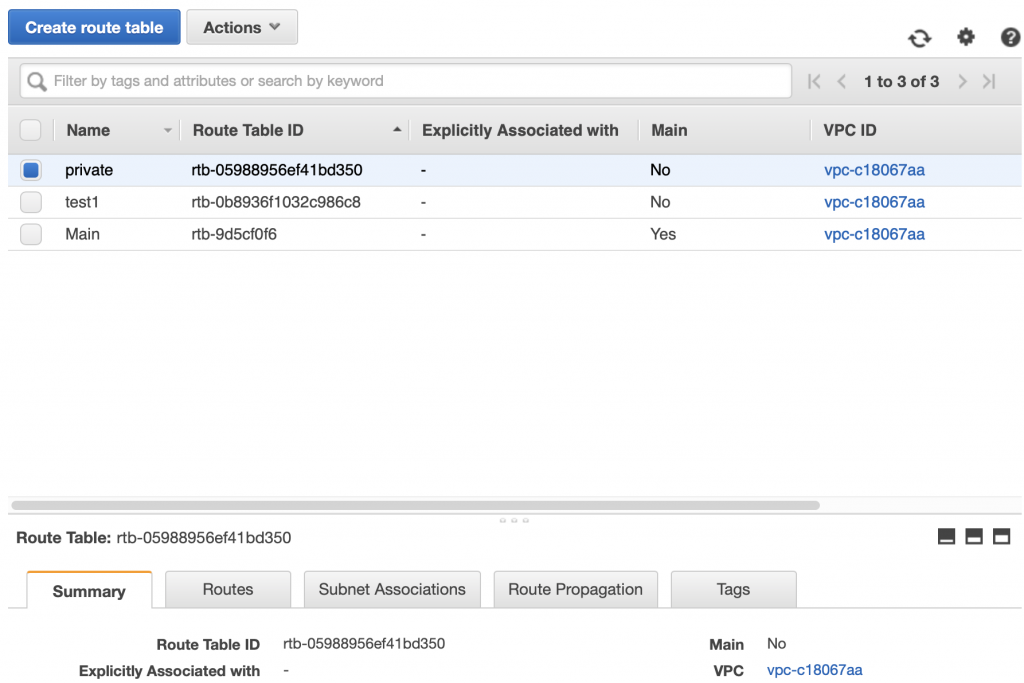
When you click on the routes, you can see that be default it creates a “local” only route.  Giving this subnet access to only the local subnets.

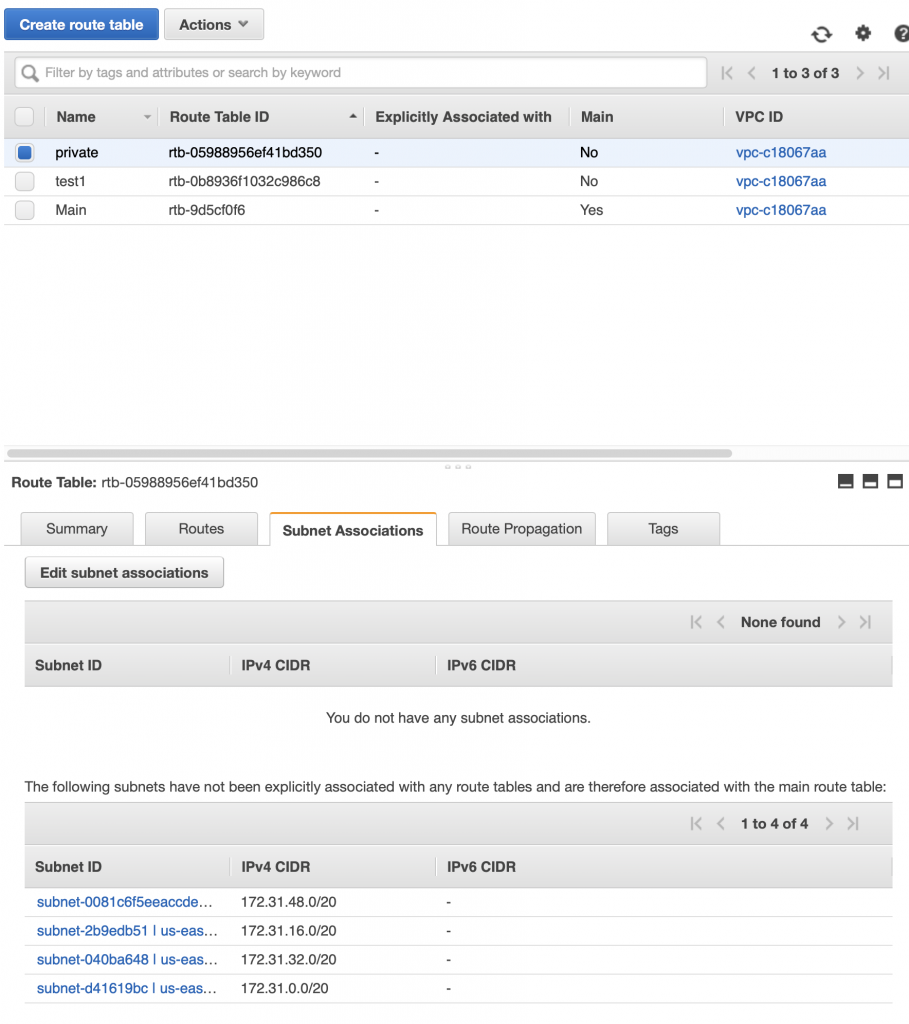
By default a subnet is not associated with any routing table.  Which means that by default it uses the “Main” routing table. If you want to associate the subnet with a specific routing table then you click on the “Subnet Associates” tab then “Edit subnet associations”


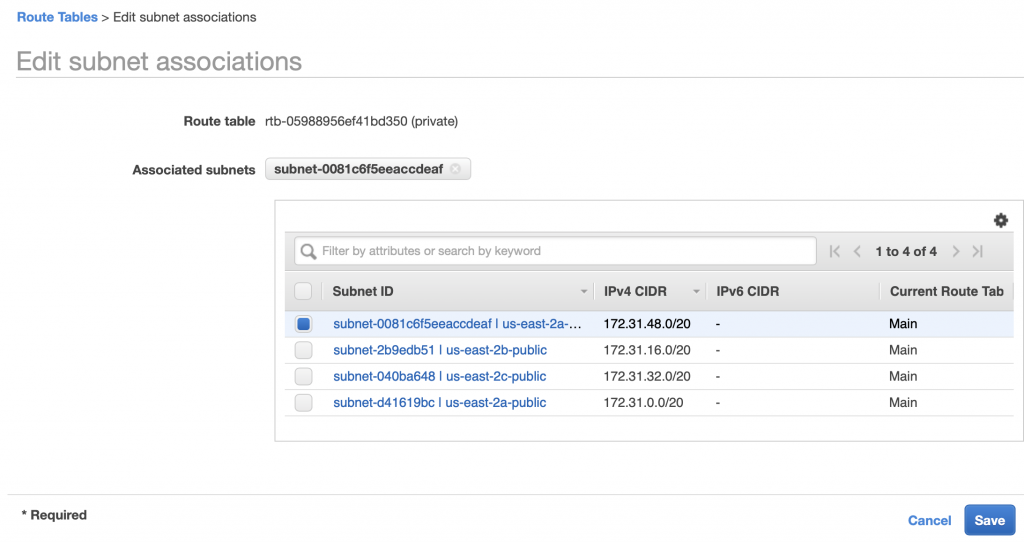
Now you can select a subnet to associate with the routing table, then “Save”

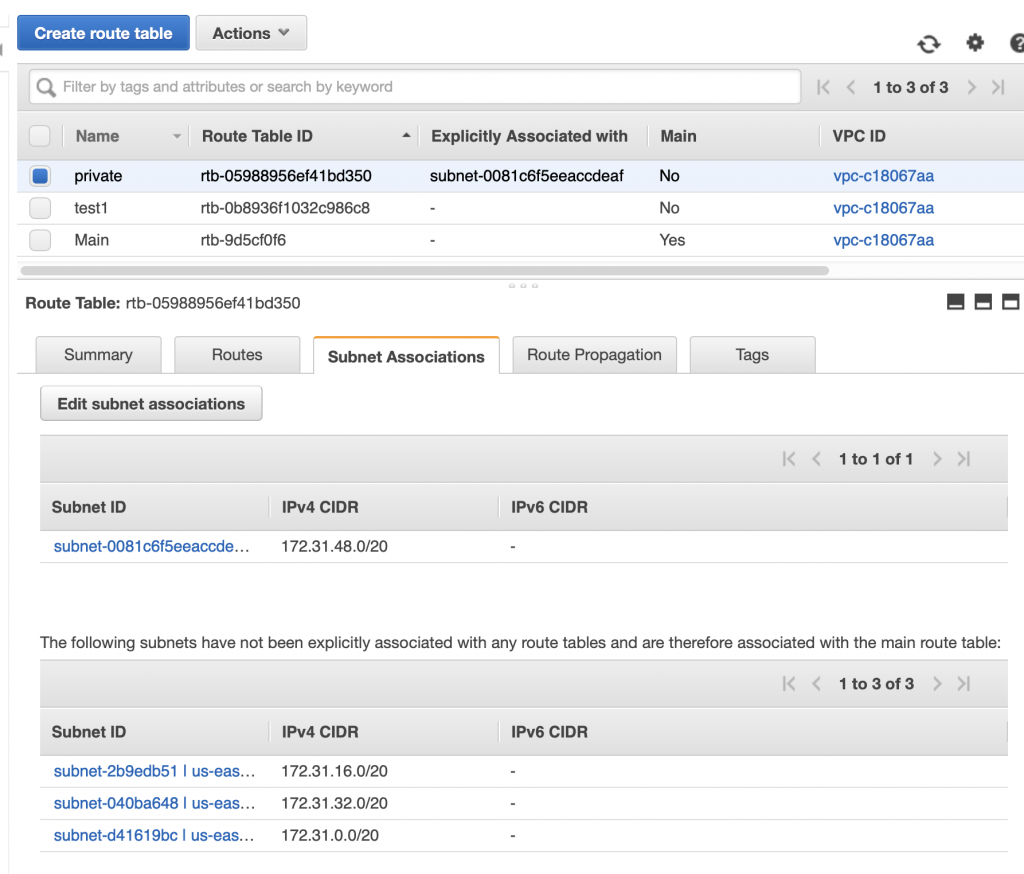
When it comes back to the main routing table page you can see that “private” is now associated with subnet “subnet-0081…”.  To bad that the interface doesn’t show the name of the subnet instead of the subnet id.

Network ACLs

After the routing table, which limits outgoing traffic on a subnet, the next layer of security is the Network Access Control List (ACL or NACL).  The ACL is just a list of IP addresses/Port pairs that are legal (allowed) or illegal (deny).  You can think of the ACL as a firewall for the subnet.  When a packet is inbound or outbound from a subnet, the ACL rules are evaluated one by one, starting with the lowest number, and going until a rule is matched.  The final rule is a “deny” meaning, if there isn’t a match then the packet is by default a deny. Some features of the ACL include:

  • NACLs are optional
  • NACLs are applied to 0 or more subnets (you can use the same NACL for more than one subnet)
  • There is a default NACL which is by default associated with every subnet
  • You can control access with BOTH routing tables and/or NACLs and/or Security Groups
  • There are separate inbound rules and outbound rules

The default has ALLOW for everything on Inbound and Outbound … here is what it looks like in the control panel.

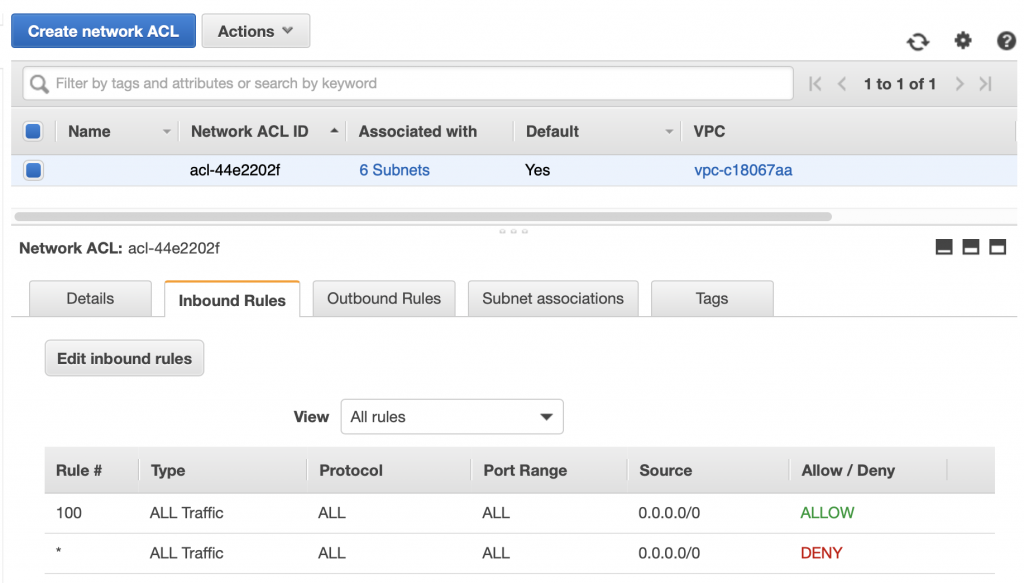
You can add/edit/change the rules by clicking on Edit Inbound Rules.

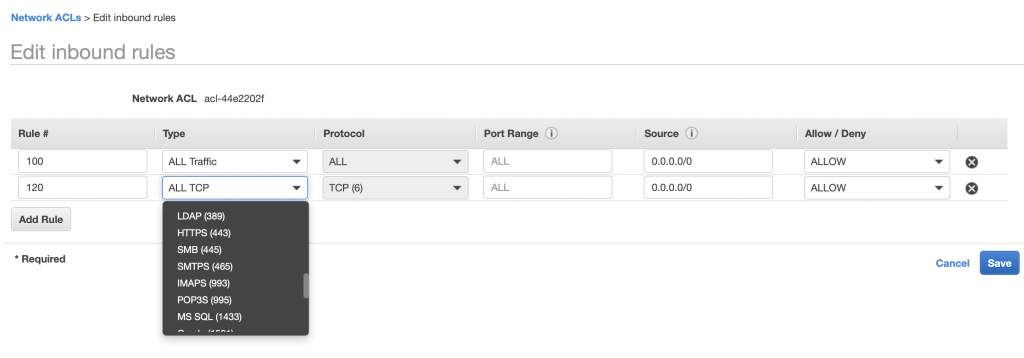
You need to specify a:

  • Rule # which much be less than 32768 and is used to specify the execution order (lowest–>highest)
  • The Rule #s should increase and you leave gaps so you can come back and add more
  • The Type – there is a big list of Types (which will automatically fill out the port) or you can completely specify it
  • The Source address

It is tempting to make these rules very promiscuous.  Don’t do it.  You should make them as constrained as possible.

Security Group

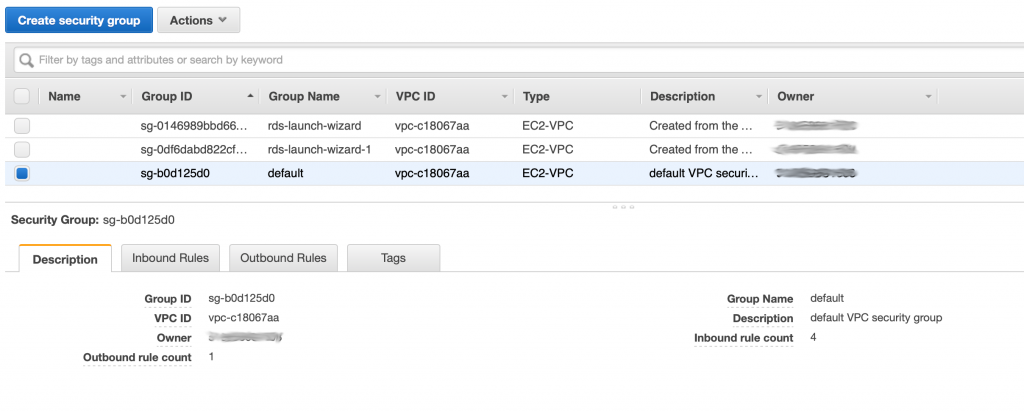
The last level of security in the AWS VPC architecture is the Security Group.  A security group is an instance level firewall.  Meaning you can write inbound and outbound port level rules that apply to a SPECIFIC server instance in your system.  A security group can be applied to more than one server, meaning it can be generic to a function.  For example you might make a security group for MySQL servers that restricts all incoming connections to port 3306.  Every server instance in your VPC belongs to a security group by default when you create it.

The security groups has a a console in the VPC console.  In the picture below you can see that I have three security groups.  The interesting thing is that the first two security groups were created automatically by the Relational Database Server system when I made two MySQL databases.

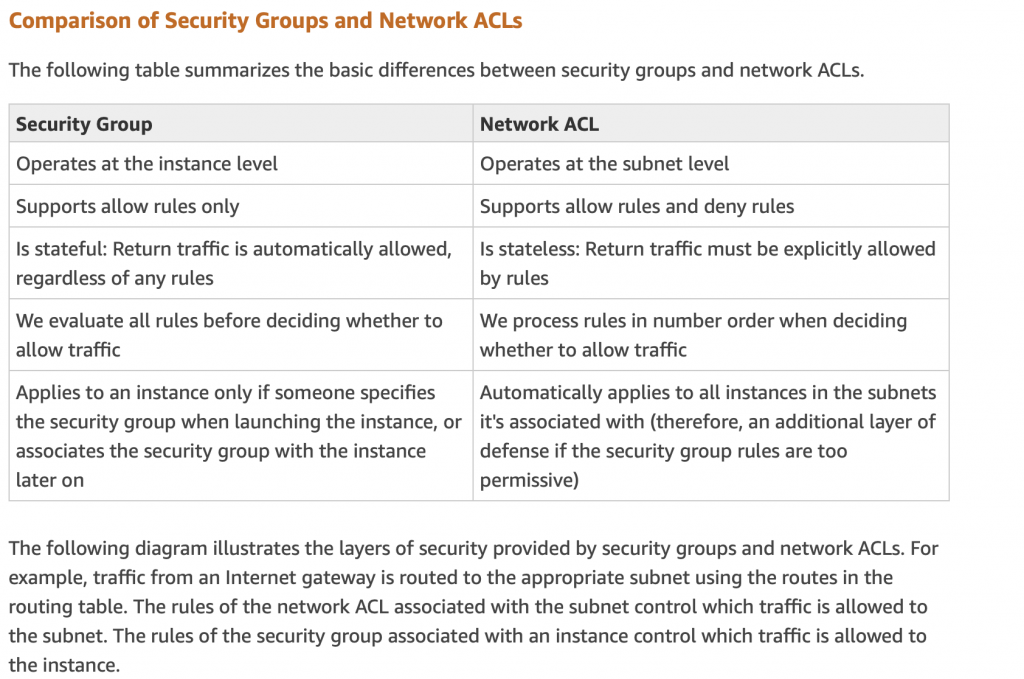
When I looked at all of this originally I wondered what is the difference between Security Group and NACL.  Amazon answers this question nicely in their documentation:

Subnet Group

A subnet group is just a list of subnets from one up to the total list of subnets in your VPC.   The subnet group is NOT listed as an attribute of the VPC on the console.  However, it is used by the the Relational Database Server (RDS) setup screens.  When you create a new RDS MySQL database it will ask you which subnet group to assign the server to.  RDS will then pick one of the subnets and attach your server.  You need to think about the subnet groups in advance or you will end up with an RDS instance on the wrong subnet.

There is a default subnet group which has all of the subnets in your VPC at the time of creation.  It does NOT add subnets to your “default” subnet group when you add new subnets.

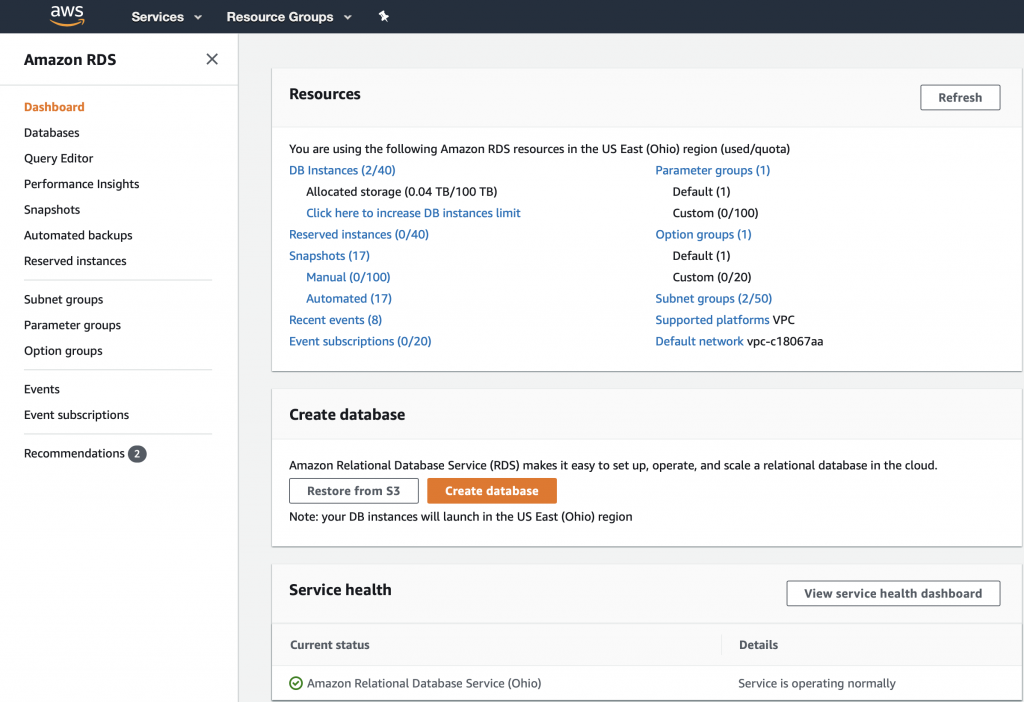
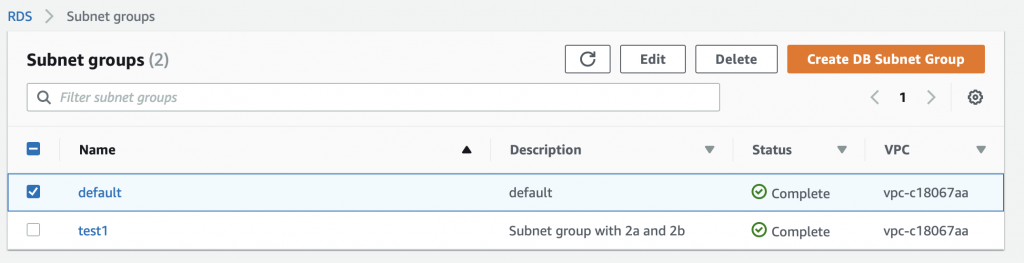
To edit the Subnet Groups you need to go to the Amazon RDS dashboard.  Then you click “Subnet groups”.  You can see in the picture below that I currently have 2 subnet groups.

On the subnet group screen you can edit or create subnet groups.

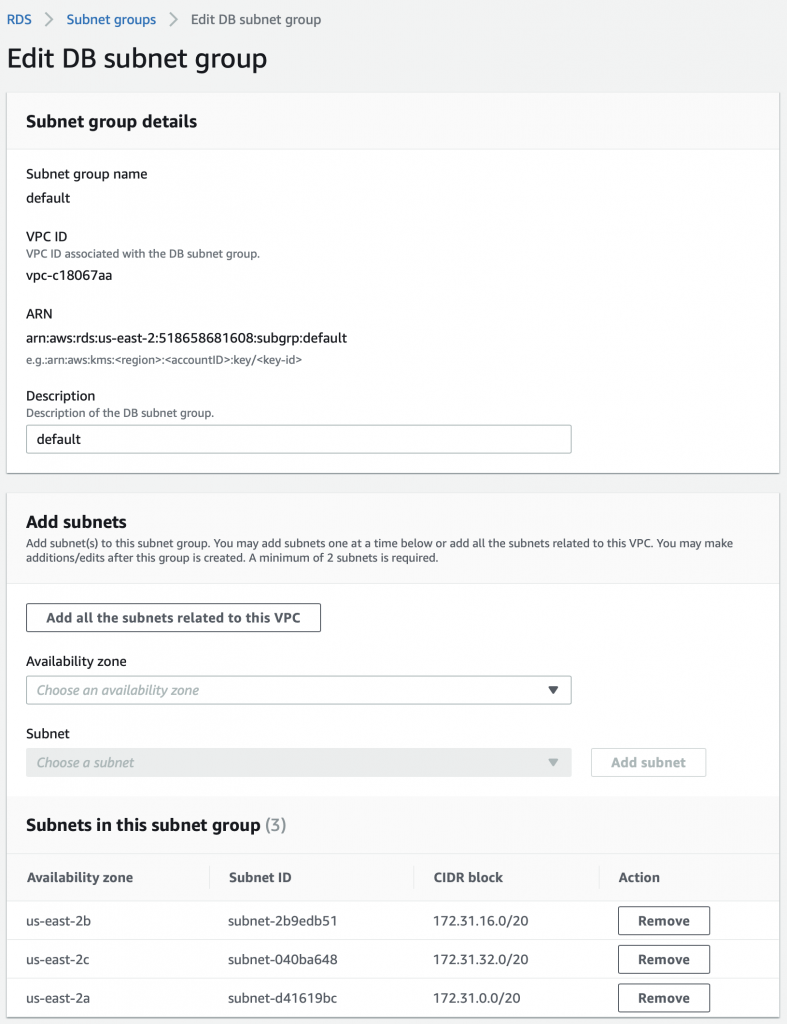
On the Edit screen you can Add or Remove subnets (or potentially filter the list to regions)

A Stern Warning

Although it seems like a terrible idea to put a section called “A Stern Warning” at the very end of a discussion, I did this because without understanding everything else the warning doesn’t make sense.

It is almost impossible to move servers between subnets once they are created.  That means YOU HAD BETTER PLAN YOUR SUBNETS BEFORE YOU CREATE SERVERS or you will find yourself roasting in HELL. 

I got lulled into a sense of security because Amazon did such a good job setting things up by default.  But, when I decided to have Public/Private subnets I already had servers turned on in subnets.  This made getting everything unwound a real pain in the ass.  On the internet there is quite a bit of conversation about how to move RDS MySQL servers and EC2 instances.  All of the options suck so it is better to design it right from the outset.  Imagine that.

Documentation and References

PSoC 6 BLE Events

Edit: It turns out that I wrote this article in February of 2018 and never published it.  But it has good stuff… so here it is.

Summary

Over the last several weeks I have been spending time working with the PSoC 6 BLE.  Specifically the BLE part of the system.  Last weekend I found myself having problems with my design and I was really struggling to figure them out.  I realized that I “knew” what was happening with the BLE callbacks… but that I didn’t really “KNOW!”.  So I decided to build a simple project to show what events were happening and why.

In this article I will show/tell you how (to):

  1. The BLE is supposed to work
  2. The PSoC 6 BLE example project
  3. Write the firmware
  4. Test the system

You can “git” this workspace at git@github.com:iotexpert/PSoC-6-BLE-Events.git or GitHub.

How the PSoC 6 BLE is supposed to work

Honestly, the first time I started looking at the BLE (in my case it was the PSoC 4 BLE), it felt overwhelming.  But, it is actually pretty simple.  You, the firmware developer, send commands to the BLE stack using the Cypress PDL BLE middleware API.  Then, when “something” happens, the BLE stack sends you back an “event” in the callback.  That “something” can either be an acknowledgement that your API call has done something, or, it can be that something has happened on the radio side (e.g. you have been connected to by a client).  When you write a PSoC 6 BLE program you need to provide an event handler function (so that the BLE stack can send you events).  The function prototype for that handler is:

void CyBle_AppCallback( uint32 eventCode, void *eventParam )

This function has two arguments.

  1. An integer that is an eventCode (which you can put into the switch).  All of the event codes will look like “CYBLE_EVT_”
  2. A void pointer, that you will cast into a specific pointer based on the event code.

Your event handler code will then be a big switch statement, where you will look at the events, and do something (or not).

void CyBle_AppCallback( uint32 eventCode, void *eventParam )
{
    switch( eventCode )
    {
        /* Generic events */

        case CYBLE_EVT_STACK_ON:
            /* CyBle_GappStartAdvertisement( CYBLE_ADVERTISING_FAST ); */
        break;

When you look in the PDL BLE Middleware documentation you can see the APIs and what events happen based on your API calls.  For example Cy_BLE_GAPP_StartAdvertisement tell the PSoC BLE Stack to start advertising.  You can see that it will generate 4 possible events i.e. CY_BLE_EVT_GAPP_START_STOP

When you click on the event in the documentation it will tell you the meaning of the event, and what the eventParameter means (i.e. what you should cast it to in order to figure out the data passed to you)

Build the project

To build the project, first make a new PSoC 63 BLE project.  Then edit the schematic to have a BLE and a UART.

PSoC 6 BLE Events Schematic

Assign the UART pins to the KitProg UART bridge pins (aka P50/P51)

PSoC 6 BLE Events Pin Assignment

Configure the BLE to be a GAP Peripheral.

PSoC 6 BLE Events Configuration

Add a custom service to the project by loading the LED Service.  It doesn’t really matter what service you add for this project.  I just picked this one because I am using it for another project.  You could have just as easily picked one of the pre-existing definitions or made your own.

PSoC 6 BLE Events Configuration

This is what the LED Service looks like.

PSoC 6 BLE Events - LED Service

Configure the GAP settings.  Specifically name your device – in this case I named mine “mytest”

PSoC 6 BLE Events GAP Configuration

Edit the advertising packet to include the name and the service.

PSoC 6 BLE Events Advertising Configuration

Write the Firmware

Remember the main event in this example project is the BLE Event Handler.  I created this event handler with the events that I normally used (i.e. CY_BLE_EVT_STACK_ON) and then kept adding events until I had them all defined.  The way that I knew an event was missing from the “switch” was by the default case printing out the event number.

void customEventHandler(uint32_t event, void *eventParameter)
{
    
    /* Take an action based on the current event */
    switch (event)
    {
        /* This event is received when the BLE stack is Started */
        case CY_BLE_EVT_STACK_ON:
            printf("CY_BLE_EVT_STACK_ON\r\n");
            Cy_BLE_GAPP_StartAdvertisement(CY_BLE_ADVERTISING_FAST, CY_BLE_PERIPHERAL_CONFIGURATION_0_INDEX);
        break;
            
        case CY_BLE_EVT_GAP_DEVICE_DISCONNECTED:
            printf("CY_BLE_EVT_GAP_DEVICE_DISCONNECTED: bdHandle=%x, reason=%x, status=%x\r\n-------------\r\n",
            (unsigned int)(*(cy_stc_ble_gap_disconnect_param_t *)eventParameter).bdHandle,
            (unsigned int)(*(cy_stc_ble_gap_disconnect_param_t *)eventParameter).reason,
            (unsigned int)(*(cy_stc_ble_gap_disconnect_param_t *)eventParameter).status);
        
            Cy_BLE_GAPP_StartAdvertisement(CY_BLE_ADVERTISING_FAST, CY_BLE_PERIPHERAL_CONFIGURATION_0_INDEX);
    
        break;
            
        case CY_BLE_EVT_GATT_CONNECT_IND:
            printf("CY_BLE_EVT_GATT_CONNECT_IND bdHandle=%x\r\n",((cy_stc_ble_conn_handle_t *)eventParameter)->bdHandle);
           
        break;
            
        case CY_BLE_EVT_GAP_ENHANCE_CONN_COMPLETE:
             printf("CY_BLE_EVT_GAP_ENHANCE_CONN_COMPLETE\r\n");
        break;
            
        case CY_BLE_EVT_TIMEOUT:
            printf("CY_BLE_EVT_TIMEOUT\r\n");
        break;
                
        case CY_BLE_EVT_GATTS_READ_CHAR_VAL_ACCESS_REQ:
            printf("CY_BLE_EVT_GATTS_READ_CHAR_VAL_ACCESS_REQ\r\n");
        break;
                
        case CY_BLE_EVT_GATTS_XCNHG_MTU_REQ:
            printf("CY_BLE_EVT_GATTS_XCNHG_MTU_REQ\r\n");
        break;
            
        case CY_BLE_EVT_SET_DEVICE_ADDR_COMPLETE:
            printf("CY_BLE_EVT_SET_DEVICE_ADDR_COMPLETE\r\n");
        break;
            
        case CY_BLE_EVT_LE_SET_EVENT_MASK_COMPLETE:
            printf("CY_BLE_EVT_LE_SET_EVENT_MASK_COMPLETE\r\n");
        break;
            
        case CY_BLE_EVT_SET_TX_PWR_COMPLETE:
            printf("CY_BLE_EVT_SET_TX_PWR_COMPLETE\r\n");
        break;
            
        case CY_BLE_EVT_GATT_DISCONNECT_IND:
            printf("CY_BLE_EVT_GATT_DISCONNECT_IND\r\n");
        break;
            
        case CY_BLE_EVT_GAPP_ADVERTISEMENT_START_STOP:
            printf("CY_BLE_EVT_GAPP_ADVERTISEMENT_START_STOP = ");
            if(Cy_BLE_GetAdvertisementState() == CY_BLE_ADV_STATE_STOPPED)
                printf("CY_BLE_ADV_STATE_STOPPED");
            if(Cy_BLE_GetAdvertisementState() == CY_BLE_ADV_STATE_ADV_INITIATED)
                printf("CY_BLE_ADV_STATE_ADV_INITIATED");
            if(Cy_BLE_GetAdvertisementState() == CY_BLE_ADV_STATE_ADVERTISING)
                printf("CY_BLE_ADV_STATE_ADVERTISING");
            if(Cy_BLE_GetAdvertisementState() == CY_BLE_ADV_STATE_STOP_INITIATED)
                printf("CY_BLE_ADV_STATE_STOP_INITIATED");
             printf("\r\n");
        break;
            
        case CY_BLE_EVT_GATTS_INDICATION_ENABLED:
            printf("CY_BLE_EVT_GATTS_INDICATION_ENABLED\r\n");
        break;
   
        case CY_BLE_EVT_GAP_DEVICE_CONNECTED:
            printf("CY_BLE_EVT_GAP_DEVICE_CONNECTED\r\n");
        break;
                
        default:
            printf("Unknown Event = %X\n",(unsigned int)event);
        break;
    }
}

Now you need a task to run the BLE.  It just runs the Cy_BLE_ProcessEvents each time an event needs to be handled.

void bleTask(void *arg)
{
    (void)arg;
    printf("3[2J3[H"); // Clear Screen
    printf("Started BLE Task\r\n");
    #ifdef USE_RTOS
    bleSemaphore = xSemaphoreCreateCounting(2^32-1,0);
    printf("Using RTOS\r\n");
    #else
        printf("Bare Metal\r\n");
    #endif
 
    printf("Cy_SysLib_GetDeviceRevision() %X \r\n", Cy_SysLib_GetDeviceRevision());
    
    Cy_BLE_Start(customEventHandler);
    #ifdef USE_RTOS
        
    Cy_BLE_IPC_RegisterAppHostCallback(bleInterruptNotify);
    //Cy_BLE_RegisterInterruptCallback(2^32-1,bleInterruptNotify);
    while(Cy_BLE_GetState() != CY_BLE_STATE_ON)
    {
        Cy_BLE_ProcessEvents();
    }
    #endif
   
    for(;;)
    {
        #ifdef USE_RTOS
            xSemaphoreTake(bleSemaphore,portMAX_DELAY);
        #endif
        Cy_BLE_ProcessEvents();         
    }
}

int main(void)
{
    __enable_irq(); /* Enable global interrupts. */
    UART_1_Start();
    printf("Started Project\r\n");
    #ifndef USE_RTOS
    bleTask(0);
    #endif
    
    xTaskCreate(bleTask,"bleTask",4*1024,0,1,0);
    vTaskStartScheduler();
 
}

Test the System

Finally program the CY8CKIT-062-BLE and attach with it to CySmart or LightBlue.  There are three phases

  1. The stack turns on and starts advertising (CY_BLE_EVT_STACK_ON –> CY_BLE_EVT_GAPP_ADVERTISMENT)
  2. A connection is made and eventually disconnected (CY_BLE_EVT_CONNECT_IND –> CY_BLE_EVT_GAP_DEVICE_DISCONNECTED
  3. You start advertising again CY_BLE_EVT_GAPP_ADVERTISEMENT_START_STOP

PSoC 6 BLE Events


The Creek 2.0: Read Sensor Data Send to AWS IoT via MQTT

Summary

In this article I will show you how to use Python to read from the I2C bus and then send the data to the AWS IoT Cloud via MQTT.  This will include the steps to install the two required libraries.  I will follow these steps:

  • Install the SMBUS Python Library
  • Create pyGetData.py to test the I2C
  • Install the AWS IoT Python Library
  • Create  pyGetData.py to send data to AWS IoT
  • Add the pyGetData.py to runI2C (which is run every 2 minutes)
  • Verify that everything is functioning

Install the SMBUS Python Library & Test

In order to have a Python program talk to the Raspberry Pi I2C you need to have the “python3-smbus” library installed.  To do this run “sudo apt-get install python3-smbus”

pi@iotexpertpi:~ $ sudo apt-get install python3-smbus
Reading package lists... Done
Building dependency tree       
Reading state information... Done
The following NEW packages will be installed:
  python3-smbus
0 upgraded, 1 newly installed, 0 to remove and 426 not upgraded.
Need to get 0 B/9,508 B of archives.
After this operation, 58.4 kB of additional disk space will be used.
Selecting previously unselected package python3-smbus.
(Reading database ... 136023 files and directories currently installed.)
Preparing to unpack .../python3-smbus_3.1.1+svn-2_armhf.deb ...
Unpacking python3-smbus (3.1.1+svn-2) ...
Setting up python3-smbus (3.1.1+svn-2) ...
pi@iotexpertpi:~ $ 

I like to make sure that everything is working with the I2C bus.  There is a program called “i2cdetect” which can probe all of the I2C addresses on the bus.  It was already installed on my Raspberry Pi, but you can install it with “sudo apt-get install i2c-tools”.  There are two I2C busses in the system and the PSoC 4 is attached to bus “1”.  When I run “i2cdetect -y 1” I can see that address ox08 ACKs.

pi@iotexpertpi:~/pyGetData $ i2cdetect -y 1
     0  1  2  3  4  5  6  7  8  9  a  b  c  d  e  f
00:          -- -- -- -- -- 08 -- -- -- -- -- -- -- 
10: -- -- -- -- -- -- -- -- -- -- -- -- -- -- -- -- 
20: -- -- -- -- -- -- -- -- -- -- -- -- -- -- -- -- 
30: -- -- -- -- -- -- -- -- -- -- -- -- -- -- -- -- 
40: -- -- -- -- -- -- -- -- -- -- -- -- -- -- -- -- 
50: -- -- -- -- -- -- -- -- -- -- -- -- -- -- -- -- 
60: -- -- -- -- -- -- -- -- -- -- -- -- -- -- -- -- 
70: -- -- -- -- -- -- -- --                         
pi@iotexpertpi:~/pyGetData $ 

You might recall from an earlier article that I setup the register map of the PSoC4 as follows:

typedef  struct DataPacket {
    uint16 pressureCounts;
    int16 centiTemp; // temp in degree C / 100
    float depth;
    float temperature;
} __attribute__((packed)) DataPacket;

If I use the i2ctools to read some data from the PSoC4 like this:

pi@iotexpertpi:~/pyGetData $ i2cget -y 1 8 0 w
0x0196
pi@iotexpertpi:~/pyGetData $

I get 0x196 which is 406 in decimal.  In my ADC I have it setup as 12-bits into 0-2.048v which means that it is 0.5mv per count in other words the ADC is reading .204v which is about .204V/51.1 ohm = 4mA also knowns as 0 PSI.  OK that makes sense.

Now I create a program called testI2C.py.

import smbus

######################################################
#Read the data from the PSoC 4
######################################################
bus = smbus.SMBus(1)
address = 0x08

# The data structure in the PSOC 4 is:
# uint16_t pressureCount ; the adc-counts being read on the pressure sensor
# int16_t centiTemp ; the temperaure in 10ths of a degree C
# float depth ; four bytes float representing the depth in Feet
# float temperature ; four byte float representing the temperature in degrees C

numBytesInStruct = 12
block = bus.read_i2c_block_data(address, 0, numBytesInStruct)
print(block)

What I will do next is run the program to see what data it gets back from the Raspberry Pi.  Then I will use the i2ctools to get the same data and compare to make sure that things are working.

pi@iotexpertpi:~/pyGetData $ python3 testI2C.py 
[150, 1, 236, 14, 0, 0, 0, 0, 204, 204, 24, 66]
pi@iotexpertpi:~/pyGetData $ i2cget -y 1 8 0 w
0x0196
pi@iotexpertpi:~/pyGetData $ 

Hang on 150,1 isn’t 0x0196.  Well yes it is because the data is in decimal and is little endian.  When you switch it to hex and display it the same way you get 0x0196 same answer.  Good.

The next problem is that a list of bytes isn’t really that useful and you need to convert it to an array of bytes using the function “bytearray”.  A bytearray also isn’t that helpful, but, Python has a library called “struct” which can convert arrays of bytes into their equivalent values.  Think converting a packed  C-struct of bytes into the different fields.  You have to describe the struct using this ridiculous text format.

The first part of the code is as before.  The only really new things are:

  • On line 20 I convert and array of bytes into a bytearray
  • On line 26 I unpack the byte array using the format string.  You can see in the table above “h” is a signed 16-bit int.  “H” is a unsigned 16-bit int. “f” is a four byte float.

The unpack method turns the bytes into a tuple.  Here is the whole code.

import struct
import smbus

######################################################
#Read the data from the PSoC 4
######################################################
bus = smbus.SMBus(1)
address = 0x08

# The data structure in the PSOC 4 is:
# uint16_t pressureCount ; the adc-counts being read on the pressure sensor
# int16_t centiTemp ; the temperaure in 10ths of a degree C
# float depth ; four bytes float representing the depth in Feet
# float temperature ; four byte float representing the temperature in degrees C

numBytesInStruct = 12
block = bus.read_i2c_block_data(address, 0, numBytesInStruct)
print(block)
# convert list of bytes returned from sensor into array of bytes
mybytes = bytearray(block)
# convert the byte array into
# H=Unsigned 16-bit int
# h=Signed 16-bit int
# f=Float 
# this function will return a tuple with pressureCount,centiTemp,depth,temperature
vals = struct.unpack_from('Hhff',mybytes,0)
# prints the tuple
print(vals)

When I run the program I get the raw data.  Then the unpacked data.  Notice the 406 which is the same value from the ADC as earlier.

pi@iotexpertpi:~/pyGetData $ python3 testI2C.py
[150, 1, 76, 14, 0, 0, 0, 0, 214, 71, 18, 66]
(406, 3660, 0.0, 36.570152282714844)
pi@iotexpertpi:~/pyGetData $ 

Install the AWS IoT Python Library

Now I want to send the data to AWS IoT using MQTT.  All the time I have been using Python I have been questioning my sanity as Python is an ugly ugly language.  However, one beautiful thing about Python is the huge library of code to do interesting things.  Amazon is no exception, they have built a Python library based on the Eclipse Paho library.  You can read about the library in the documentation.

To get this going I install using “sudo pip3…”

pi@iotexpertpi:~ $ sudo pip3 install AWSIoTPythonSDK
Downloading/unpacking AWSIoTPythonSDK
  Downloading AWSIoTPythonSDK-1.4.7.tar.gz (79kB): 79kB downloaded
  Running setup.py (path:/tmp/pip-build-ajpr2imp/AWSIoTPythonSDK/setup.py) egg_info for package AWSIoTPythonSDK
    
Installing collected packages: AWSIoTPythonSDK
  Running setup.py install for AWSIoTPythonSDK
    
Successfully installed AWSIoTPythonSDK
Cleaning up...
pi@iotexpertpi:~ $ 

To use the library to connect to AWS you need to know your “endpoint”.  The endpoint is just the DNS name of the virtual server that Amazon setup for you.  This can be found on the AWS IoT management console.  You should click on the “Settings” on the left.  Then you will see the name at the top of the screen in the “Custom endpoint”

The next thing that you need is

  • Your Thing Certificate (I hope you downloaded them when you had the chance)
  • Your Thing Private Key
  • The Amazon Root CA which you can get on this page You should choose “Amazon Root CA 1”

The program is really simple.  On lines 7-13 I just setup variables with all of the configuration information.  Then I create a JSON message by concatenating all of the stuff together that I read from the PSoC 4.  Lines 18-20 setup an MQTT endpoint with your credentials.  Line 22 opens the MQTT connection.  And finally line 21 Publishes the message.

from AWSIoTPythonSDK.MQTTLib import AWSIoTMQTTClient

######################################################
# Send Data to AWS
######################################################

host = "a1c0l0bpd6pon3-ats.iot.us-east-2.amazonaws.com"
rootCAPath = "../aws-keys/AmazonRootCA1.pem"
certificatePath = "../aws-keys/a083ad1cff-certificate.pem.crt"
privateKeyPath = "../aws-keys/a083ad1cff-private.pem.key"
port = 8883
clientId = "applecreek"
topic = "$aws/things/Test1/shadow/update"

# Shadow JSON Message formware
messageJson = '{"state":{"reported":{"temperature":' + str(vals[3]) +',"depth": ' + str(vals[2]) + ',"thing":"applecreek"}}}'

myAWSIoTMQTTClient = AWSIoTMQTTClient(clientId)
myAWSIoTMQTTClient.configureEndpoint(host, port)
myAWSIoTMQTTClient.configureCredentials(rootCAPath, privateKeyPath, certificatePath)

myAWSIoTMQTTClient.connect()
myAWSIoTMQTTClient.publish(topic, messageJson, 1)

Now that I have the Python program, I want to plumb it into the rest of my stuff.  On my RPI I run “crontab -l” to figure out what my collect data program is.  That turns out to be “runI2C” which appears to run every two minutes.

0,2,4,6,8,10,12,14,16,18,20,22,24,26,28,30,32,34,36,38,40,42,44,46,48,50,52,54,56,58 * * * * /home/pi/getCreek/runi2c

I edit the runI2C shell script and add on my python program.

#!/bin/sh
cd ~pi/getCreek
sudo java -cp build/jar/getCreek.jar:classes:./lib/* CreekServer GetData
cd ~pi/pyGetData
python3 pyGetData.py

Finally we are ready for the moment of truth.  Log into the console and start the test client.  Subscribe to “#” and after a bit of time I see that my publish happened and it was accepted into the Device Shadow of my Thing.

Here is the device shadow

Here is the whole program

import struct
import sys
import smbus
from AWSIoTPythonSDK.MQTTLib import AWSIoTMQTTClient

######################################################
#Read the data from the PSoC 4
######################################################
bus = smbus.SMBus(1)
address = 0x08

# The data structure in the PSOC 4 is:
# uint16_t pressureCount ; the adc-counts being read on the pressure sensor
# int16_t centiTemp ; the temperaure in 10ths of a degree C
# float depth ; four bytes float representing the depth in Feet
# float temperature ; four byte float representing the temperature in degrees C

numBytesInStruct = 12
block = bus.read_i2c_block_data(address, 0, numBytesInStruct)

# convert list of bytes returned from sensor into array of bytes
mybytes = bytearray(block)
# convert the byte array into
# H=Unsigned 16-bit int
# h=Signed 16-bit int
# f=Float 
# this function will return a tuple with pressureCount,centiTemp,depth,temperature
vals = struct.unpack_from('Hhff',mybytes,0)
# prints the tuple
print(vals)

######################################################
# Send Data to AWS
######################################################

host = "a1c0l0bpd6pon3-ats.iot.us-east-2.amazonaws.com"
rootCAPath = "../aws-keys/AmazonRootCA1.pem"
certificatePath = "../aws-keys/a083ad1cff-certificate.pem.crt"
privateKeyPath = "../aws-keys/a083ad1cff-private.pem.key"
port = 8883
clientId = "applecreek"
topic = "$aws/things/applecreek/shadow/update"

# Shadow JSON Message formware
messageJson = '{"state":{"reported":{"temperature":' + str(vals[3]) +',"depth": ' + str(vals[2]) + ',"thing":"applecreek"}}}'

myAWSIoTMQTTClient = AWSIoTMQTTClient(clientId)
myAWSIoTMQTTClient.configureEndpoint(host, port)
myAWSIoTMQTTClient.configureCredentials(rootCAPath, privateKeyPath, certificatePath)

myAWSIoTMQTTClient.connect()
myAWSIoTMQTTClient.publish(topic, messageJson, 1)


The Creek 2.0: AWS IoT MQTT Message Broker

Summary

In this article I will explain the fundamentals of the Amazon Web Service IoT Device Cloud.  I will show you how to:

  • Create a “Thing” in the AWS IoT Core
  • Create and attach secret keys in the form of a X.509 Certificate
  • Create and attach an access Policy to the Certificate
  • Publish and Subscribe use a Message Queuing Telemetry Transport (MQTT) Message Broker (that Amazon creates for you)
  • Use MQTT to update the cached “state” of your device, also called the Device Shadow

There are 5 fundamental concepts that you need in order to understand the AWS IoT system, specifically, Thing, Certificate, Policy, MQTT and Device Shadow.

A Thing is Amazon’s word for some device out in the world that attaches to the AWS IoT cloud.  In my case, Thing means the Elkhorn Creek in Georgetown, Kentucky.  But, it could be a garage door, dishwasher or whatever other ridiculous thing you want to connect to the internet.  The AWS IoT Cloud allows you to create a Thing, setup and manage security, receive data from it, send data to it, and keep track of its state.  In my case the state is the water level of the Creek and the temperature in my barn.

A Certificate is an X.509 document that has a signed public key of the Thing.  When you use the Amazon IoT Console to create a Thing,  you can also create a Certificate for the Thing, the private key that goes with the public key in the Certificate, as well as a copy of the public key that is embedded in the Certificate.  In order to create a TLS connection to AWS IoT you will need to use the Certificate as Amazon AWS does “double sided” TLS connections.  In other words you must verify Amazon and Amazon must verify you.  You will also need your private key in order to decrypt data that Amazon sends to you encrypted with your public key.  Amazon uses the Certificate to uniquely identify a specific Thing.

A Policy is a JSON document that is attached to a Certificate that specifies what “IoT Actions” your Thing is allowed to take and to which resources that it is allowed to take the action upon.  Actions include Connect, Subscribe, Publish etc.  All resources in the world of Amazon have an ARN (Amazon Resource Name), so in the Policy you specify what actions can happen to what ARNs.

MQTT stands for Message Queuing Telemetry Transport and is an IoT protocol for a Thing to Publish messages to a Message Broker Topic.  A Message Broker is TCP/IP server that is running in the AWS IoT Cloud that Amazon creates for you and automatically turns on.  A Topic is just a name which you create that serves as a way to identify message channels.  In addition to Publishing messages to a Topic, a client can also Subscribe to a Topic.  In other words a Thing can Publish to any topic and any Thing can Subscribe to any Topic.  This you can create a many too many relationship for Publishing/Subscribing to message.  There are some topics which have special meaning in the world of AWS IoT and are used for updating and monitoring Thing state stored which is stored in the Device Shadow.

A Device Shadow is just a JSON document that is cached in the AWS IoT Cloud and is used to represent the Desired and Reported state of a Thing.  This allows other devices in the AWS IoT Cloud to communicate with a Thing even if it is not currently connected.  The JSON Device Shadow is just a JSON key value map which is defined by YOUR application.  Amazon doesn’t care what keys or values you use.  In my case the keys are “temperature” and “depth”.  When my Thing finds new values for the state of those two variables it will send updates to the Device Shadow via MQTT.

Amazon has pretty good documentation of how all of this fits together here.  One thing to note is that Amazon changes the screens on this system all of the damn time.  In my experience the changes are not major, but my screen shots may or may not reflect the current state of AWS.  Actually, there will almost certainly be some differences, but I can’t help that.  Please email bezos@amazon.com if don’t like it.

Here are the steps I will follow in this Article to show you this whole thing:

  • Create an AWS IoT Account
  • AWS IoT Core Console Tour
  • Create a Thing & Certificate
  • Create a Policy and Attach it to the Certificate
  • Explain MQTT & Show the Test Client
  • Explain the Device Shadow
  • Update the Shadow Using the Test Client

Create an AWS IoT Account

In order to use all of this, you will need to create an AWS IoT Account.  You can do that at https://console.aws.amazon.com.  Obviously Amazon makes all of their profit from AWS, however, for small amounts of usage, it is essentially free to use.  You will need to provide a credit card when you set this up, but for every thing that I have done, I have used <$10.  So no big deal.

When you click on Create a new account it will bring you to this screen.  This will be a different account (even if it has the same password as your Amazon commercial account).

Once you have an account you will end up on a Screen that looks like this.  You can see that I have recently been using all of the services that I am talking about.  Imagine that.  For this lesson we will focus on IoT Core, but in the future lessons Ill talk about other services.  You can get to IoT Core by typing IoT Core into the search box and the clicking it.

There is actually a bunch of good documentation (which you can see near the bottom of the screen) including tutorials (obviously none of them are as good as this one)

AWS IoT Core Console Tour

Once you click on IoT Core, you will end up on a screen like this one.  It shows how much activity is going on in my account (basically not very much).  On the left side of the screen are all of the functions that we will use in this tutorial.

Monitor shows the screen shown above and gives you top level statistics about what is going on in your Cloud.

Onboard is a set of new tools to help you attach devices to your AWS IoT Cloud (I have not used any of them)

Manage allows you to create, delete, modify all of your Things (we will do quite a bit of this)

Greegrass is a tool that allows you to have a local “server” that all of your things attach to.  I have not used it as of yet, but will in the future.

The Secure menu give you access to all of your Certificates and Policies.

Defend gives you access to tools to monitor and defend your IoT network as the Russians, Chinese and CIA are all trying to get into your network.

The Act screen allows you to create Rules to do stuff based on things happening in the world of your MQTT Message Broker.  In a future article I will show you how to Act on an MQTT message to run an Amazon Lambda Function.

Test starts up a REALLY cool web based MQTT test tool that will allow you to Publish and Subscribe to messages that are flying around on your MQTT broker.

Create a Thing & Certificates

Amazon has some pretty decent documentation which shows you how to create and manage things which you can find here.

Finally, we are ready to actually do something.  Specifically we will create a “Thing” to represent the water level in the Elkhorn Creek.  Click on Manage -> Things.  You can see in the picture below that I already have two devices in my Thing cloud, applecreek and Test1.  Press “Create” to start the process of creating  new Thing.

Obviously, Amazon designed this whole system to be able to handle boatloads of Things, so they provide the ability to create many things, both in the GUI as well as with the command line.  But to learn the process we will create a single thing using the web gui.  Press “Create a single thing”

Give you Thing a name (yes there are tons of bad jokes which could be done here).  I will call my example Thing “Test2”.  Then press “Next”

In order for you Thing to connect to the network it needs to have a Certificate attached to it.  The certificate documentation is here.  It is possible to use your own certificates or have Amazon sign your certificates.  However, we will do the simple thing and let Amazon create the Certificate for us.  Press “Create certificate”

Once the Certificate is created you will come to this screen.  In order to use the Certificate on your Thing you will need to download it as well as the private/public key pair.  You should take the opportunity to down these NOW.  Once that is done press “Activate” to turn on the Certificate.

Once you have activated the certificate you get your LAST!!! chance to download the certificates.  If you do not download them, then you will need to delete them and create a new set.  You should be careful where you store the keys on  your local device as they will give bad actors the ability to access your Things.   If you look around on GitHub it will be common to find them, so be careful.  Press “Done” to move to the next screen.

After you have created a device your screen will look something like this.  You can see that I already created several Things which I called “applecreek” (the Thing that is in production on my real system.  Now that you have “Test2” we can look at it to see some of the properties.  Click “Test2”

You will see a list of properties classes of the device.  Starting with the official Amazon Resource Name (ARN) of your device.  If you click on “Security”

You will see that indeed you have a Certificate that is “attached” to your device.  Hopefully you downloaded the keys that go with the device.  If you didn’t you are screwed and will need to create a new Certificate (which you can do on this screen)

Create a Policy and Attach it to your Certificate

Amazon has documentation for Policies here.  As I discussed earlier a Policy is a JSON document that is attached to a Certificate that enables a Thing who is identified by that Certificate to take Action(s) on a specific Resource as identified by an ARN.  Policies can have wildcards for Actions and Resources, so they may be  attached to multiple Certificates.  Imagine Action:* and Resource:* (which is probably a bad policy)

Let’s create one and that should illuminate things better.  Go back to the main screen and click on “Secure->Policies”.  Then click “Create”

Give the Policy a name.  In this case “Test2Policy”.  My Policy has two Actions.

  1. IoT:Connect which is allowed by the Thing “…./Test2”
  2. IoT:Publish which is allowed you to MQTT Publish to the topic listed (notice I made an error and I really meant Test2)

When you click on the Actions box Amazon give you a list of suggestions.  One of the suggestions is “IoT:*” which means ANY of the IoT actions (like Connect, Publish, Subscribe,…)  You can also specify a wildcard for the resources with a “*”

After you have the policy done, click “Create”

And your screen will look something like this.  Notice that I setup a policy called “policyall” which is a wildcard policy that lets me do anything.  You can click on the policies and see what is going on with them.

In order to have the Policy take effect you need to attach it to the Certificate.  Click on Secure->Certificates.  Then click your specific Certificate.  In my case it was “ca8…”

When you get to the Certificate page you can then click on “policies”

Where you will see that you don’t have a Policy associated with your Certificate.

Fix that by click on “Actions” which is on the right hand side of the screen.  Pick “Attach Policy”

On this screen pick the policy you want to attach.  In this case I picked “Test2Policy”.  Then click attach.

MQTT & the Test Client

One of the coolest things that Amazon provides is a web browser based MQTT client.  To get to it press “Test” (the last item on the left)

Which will bring you to this screen.  Here you can Subscribe to Topics by typing the name of the topic you are interested in and clicking “Subscribe to Topic”.  You can also Publish messages to a Topic by typing the Topic name in the Publish box, and typing the message in the black box.  The message is typically in JSON format, but this is not actually a requirement.

There are very few rules about topic names and as such are left up to you as application semantics.  There are, however, a few reserved names which cause specific things to happen in the AWS IoT Cloud.  These topics all start with $aws and are documented here.

Let’s do a little demonstration of the system by subscribing to “myrandomtopic”, obviously just a name I made up.  Type in the box and press “subscribe to topic”

Once that is done you will see on the left side of the screen the topic name in bold with an “x”.   To actually publish something you can type a message to be sent into the black box… and when you press “Publish to topic”  Go ahead and type something.

When you press publish, your screen will show each the message that is Published to the Topic because you are Subscribed.  This will include messages you Publish in the Test console, as well as Messages that are Published by other devices, like your Thing.  This is a really convenient way to debug what is going on in your system.

If you go back to the publish to a topic screen and type a different message… then press “publish to topic”… you will notice a green dot next to the topic indicating a new message.

And when you click the topic you will see the history of message Published since you Subscribed.

You are allowed to subscribe to multiple topics at a time and it will show all of them.

There is also the ability to subscribe to “wildcard” topics.

Which means you can subscribe to “#” which will give you all messages sent to the MQTT message broker

Notice that if I Publish to “myrandomtopic” that it will match by “myrandomtopic” as well as “#” (look at the green dots on the left of the screen)

The Device Shadow

The purpose of the Device Shadow is to serve as a Cache of the Reported and Desired State of a Thing.  This allows a Thing to not be connected all of the time.  Imagine that a light build sends its “reported” state every time that it changes.  And a light switch will send the light bulbs “desired” state when it wants to change the light bulb.  This allows a device to figure out what state it is supposed to be in when a power outage occurs.  And it allows devices to find out what is going on with a Thing without having to talk directly to them.

The official format of the Device Shadow is as follows.  Notice just another JSON document.

Here is an example document

You can look at the Device Shadow by Clicking on a Thing in the Management Console.  Then clicking Shadow.  This device has a boring document which nothing in it.

Update the Shadow Using the Test Client

The last piece of this puzzle is how a Thing interacts with its Device Shadow.  That is simple.  A Thing needs to send JSON message in the right format to the right MQTT Topic.  If you click on “Interact” it will show you the list of Topics.

In the documentation there are examples of JSON messages that you need to Publish.

Given all of that, let’s update the shadow for Test2 by publishing a message with the temperature and depth in this JSON document

{
    "state": {
        "reported" : {
           "temperature":30.12,
           "depth":10.2
        }
    }
}

First subscribe to the “#” topic so you can see all of the messages.  Then publish the JSON document.

In the MQTT test client you will see

  • $aws/things/Test2/shadow/update/accepted
  • $aws/things/Test2/shadow/update
  • $aws/things/Test1/shadow/update/documents

Then you will be able to go to the management console –> Manage -> Things.  This will show you all of your “things” including the “Test2” that we just updated.  Click on “Test2”

Then click Shadow.  Now you will be able to see that the document has been updated and it is caching the state of the device.

Now that we know how to interact with the device shadow via MQTT.  How do I get the Raspberry Pi to send MQTT messages?  That is the topic of the next article.

The Creek 2.0: Amazon AWS IoT Solution Architecture 2.0

Summary

Last week I talked about fixing my Creek Water Level sensor.  This got me to reflecting on a change that I have been wanting to make for a long long time: moving all of the backend server stuff to the Amazon AWS IoT Cloud.  In this article, I will explain the architecture of the intermediate end result.  What in the world does “intermediate end result” mean? Alan, is that a really goofy way to say that you aren’t going to finish the job?  Well, I suppose yes, not at first.  But I am going to hook up all of the middle stuff, from the current Raspberry Pi to an Amazon Relational Database Server (RDS) running MySQL.

There is a bunch of technology going on to make my new solution work, including:

  • PSoC 4 & Embedded C
  • Copious use of Python
  • MySQL
  • JSON
  • Raspberry Pi
  • MQTT
  • AWS IoT Core, Shadow
  • AWS Python SDK

Architecture

This is a picture of the updates to the system architecture.  The boxes in green are unchanged from the original system architecture.  The purple Raspberry Pi box will get some new stuff that bridges data to the Amazon IoT cloud and the blue boxes (which are Amazon AWS) are totally new.

(1) Pressure Sensor

The Measurement Specialties US381 Pressure sensor remains unchanged.  It senses the water pressure from the Creek and returns 4-20mA based on a pressure of 0 to 15PSI.  0PSI=4mA, 7.5PSI=12mA and 15PSI=20mA.

(2) Creek Board

The Creek Board remains unchanged.  It supplies power to the pressure sensor and has a 51.1Ohm sensing resistor which serves to turn the current of 4-20mA into voltage of 0.202V to 1.022V, which is perfect for the PSoC Analog to Digital Convertor.

(3) CyPi Board

The CyPi Board remains unchanged.  It has an Arduino pin out on the top to connect to the Creek Board and on the bottom it has the Raspberry PI I2C and GPIO interface.  On the board is a PSoC 4 which reads the voltage of the pressure sensor.  This board also provides power to the sensor and the Raspberry Pi (remember from the previous post that I blew up the power regulator)

(4) Raspberry Pi

In the original design the Raspberry Pi runs a bunch of different Java programs as well as MySQL.

I am going to leave all of the original stuff unchanged.  In the picture above, you can see the runI2C shell script, which is run by the Raspberry Pi crontab.  I will modify this script to run a Python program that will read the sensor state using the SMBus library, then format a JSON message, then connect to the AWS MQTT server using the AWS IoT Python library and send an update of the Shadow state.

(5) AWS IoT MQTT Message Broker

The AWS IoT Cloud provides a bunch of tools to help people deploy IoT functionality.  There are two principal methods for interacting with the AWS IoT Cloud: Message Queuing Telemetry Transport (MQTT) and Hyper Text Transfer Protocol (HTTP).  I will be using MQTT to interface with the AWS Cloud.  Specifically, I will create JSON messages that represent the state of my IoT Device (the Creek Depth and Temperature) and then I will send it to the Amazon AWS MQTT Message Broker.  The message will be stored in a facility provided by Amazon called the Device Shadow, which is a cache of your “thing” state.

(6) AWS IoT Rule Actions and (7) AWS Lambda

In the AWS IoT Core management console you can configure “Act”ions based on the MQTT messages that are flying around on the MQTT broker.  My action will be to look for updates to the Device Shadow topics and then to trigger an AWS Lamba function.  That Python function will take the JSON message (sent via AWS) and will insert the data into the MySQL database.

(8) AWS RDS MySQL

I will create almost the exact database that is running on the Raspberry Pi and install that into an Amazon Relational Database Server (RDS) running MySQL.  I decided to make the database extensible to add data from other “things”.  To do this I add a table of device names and id which map to the data table.

Future

When I get a few minutes there are a bunch of things that I would like to add to this system

  • Remove the Raspberry PI and create a PSoC 6 / 43012 Amazon Free RTOS board to read the data and send it to the AWS Cloud
  • AWS Greengrass
  • Use Grafana to view the data
  • Create and AWS Django Python based web server to display the data

Repair the Elkhorn Creek Water Level Sensor

Summary

As many of you have noticed, www.elkhorn-creek.org has been offline for quite a while (actually since December 22,2018).  I know that many of you have really missed knowing how much water is in the creek.  Given that it blew up in December, and I knew that I was going to have to crawl into the muddy creek to fix it, I had not gotten around to it.  But, now it is July and the water is nice, so I don’t have much of an excuse.  I have written extensively about my system, in fact, it was my first real IoT project.  I assumed that it would not be that hard to fix.  Boy was I wrong.

In this article I will:

  • Get the Sensor out of the Elkhorn Creek & Debug
  • Update the PSoC Project to use a Different GPIO
  • Blow up the CyPi Power Supply
  • Debug the Wrong Pressure Sensor
  • Turn the Raspberry Pi Back on and Retest

Get the Sensor out of the Creek and Debug

I felt like Stanley in the Congo heading down the path to the Elkhorn Creek.

But, when you get there, look how beautiful it is.

Here is a picture looking down at the sensor setup from the top of the bank (that is a 6 foot ladder, so that bank is something like 10 feet high)

When you slide down the bank onto the ladder, this is where you end up.  After I jumped off the ladder into the creek, I was in mud up to my knees.  I had assumed that the problem was that water had leaked around sensor NPT connection.  You can see the drain valve that I installed to drain water out of the pipe for just that case.  When I opened the valve, there was no water… like none. This made me start to wonder what was going on.  The sensor is installed in the end of that square clear out.

When I undid the sensor and brought it up into my lab, there was no leaking around the sensor.  My original theory that the sensor had gotten water onto the dry side was incorrect.

So, I plugged the sensor in on my bench to try to figure out what was going on.

The first measurement I took was across the 51.1 ohm sensor resistor.  Last time I checked, V=IR, so this means that it is drawing 133mA.  That is bad given that it is a 4-20mA current loop.

It is also bad to put 6.81V onto a PSoC pin.  When I measure the voltage at the pin it is 0.003 V.  Dead.  At this point, I suspect that whatever killed the sensor also killed the PSoC, but I don’t know.  I suppose that the sensor could have blown up (maybe an ESD event) and then when the voltage went to 6.81, it blew up the PSoC?  I suppose that I will never know.

In fact, when I connect the power supply directly to the A0/P2[0] analog input, I get 0.023A … which means that I also blew up the GPIO and it is now shorted to ground.  Well, actually it isn’t a short, it is more like 43 Ohm resistor.  Bad.

Here is the spec from the PSoC 4 data sheet.  2mA is a long long way from 2nA.

Unfortunately, this is the only CyPi board that I have.  Moreover, I don’t have another PSoC4 chip to fix it with (or at least at my house right now).  So, I decided that I will assume that the other pins are OK and I will use PSoC Creator to move to another pin (A2) that hopefully isn’t blown up.  To do this, I snip off the Arduino pin, then solder a jumper on the top from A0 to A2.

Update the PSoC Project to use a Different GPIO

Next, I have to fix the firmware to use A2 instead of A0.  This is AKA P2[2] instead of P2[0].  When I open up the workspace in PSoC Creator, it immediately starts complaining about components that are old.  Notice that all of the “dwr’s” which are opened have an asterisk indicating they have changed.  In order to fix this I need to update all of the components.

Starting with the boot loader project called “p4bootloader”, right click and select “Update Components…”

Notice that eight of the components in the project are old.  Select Next.

Then turn off the “create a workspace archive before updating option”.  My project is in Git so I don’t need to save it in case something bad happens.  Then click Finish.

And after a minute I can Build the project.

Next I update the main project which is called “p4arduino-creek”

Follow the same process as before:

In this case I forget to click the archive button, but I can cancel the archive.

Once the update is done, look at the schematic.  The first thing that I notice is that I called the pressure input “high side”.  I hate the name high side… so I am going to fix it to be called pressure

Double click the pin and change it to “pressure”

Because the boot loader hex changed, I need to update the reference in the bootloadable component.  Double click it and correct the path.

Notice that it has a new version of the compiler.

Then reassign the pressure pin to be P2[2] which is also known as A2

Then rebuild and notice that everything is OK.

Once I reprogram the board, I take it outside to reinstall the whole mess.  After I hook it up I start probing with the multimeter and immediately short out the power supply with one of the multi-meter probes.

Blow up the CyPi Power Supply

Which blows up the REG1117.  Here is an animated GIF where you can see that it turns on.. then immediately goes off.  This is more than a little bit annoying.

Fortunately, I have my original CyPi prototype.  So, I go back to the prototype CyPi – which means that I have to use two power supply connections.  One of the things that I fixed in the final CyPI was to have the ability to drive the Raspberry Pi with the 12V input (I have ordered a new REG 1117).

Debug the Wrong Pressure Sensor

When I install everything, an unbelievably frustrating thing happens. I put the probe on the sensor and I immediately measure 1.007V  which is 19.7 mA which is also known as 14.7346 PSI.  This is seriously bad.  I have been standing in mud up to my knees fixing the damn system and it is already broken again.  I should be measure 4mA*51.ohm = .202V.  But no.  This was a deeply frustrating moment because I assumed that something else is wrong with my system.

When I got back inside and tried to figure out what in the world was happening, I thought, maybe the pressure sensor is clogged or something?  This made me wonder what the air pressure in Kentucky at that moment was.  After a little bit of google I find that the air pressure is 30 inches of Hg… which turns out to be … guess… 14.7 PSI.  I knew immediately that I purchased the WRONG DAMN SENSOR.

Measurement Specialties makes the US381 in both Gauge and Absolute pressure.  In the Absolute case, it gives you the pressure with a reference to a vacuum.  In the gauge case it gives you a relative measurement.  The back side of this pressure sensor is exposed to the air, which lets it cancel out atmospheric pressure changes.  But I bought US381-000005-015PA instead of the correct US381-000005-015PG.


And, a few days later Mouser delivered me the correct sensor, and after and hour of mud and sweat I had things ready to try again.

Turn the Raspberry Pi Back on and Retest

After re-installing everything in the barn, I now get .202V across the 51.1 Ohm Sensor Resistor, which means that I am getting exactly 4mA.  That makes perfect sense as right now the pressure sensor is just exposed to the air. (meaning it is sticking out of the water)

And now www.elkhorn-creek.org is working again.  Good.