Bus Pirate V4 (SeeedStudio)

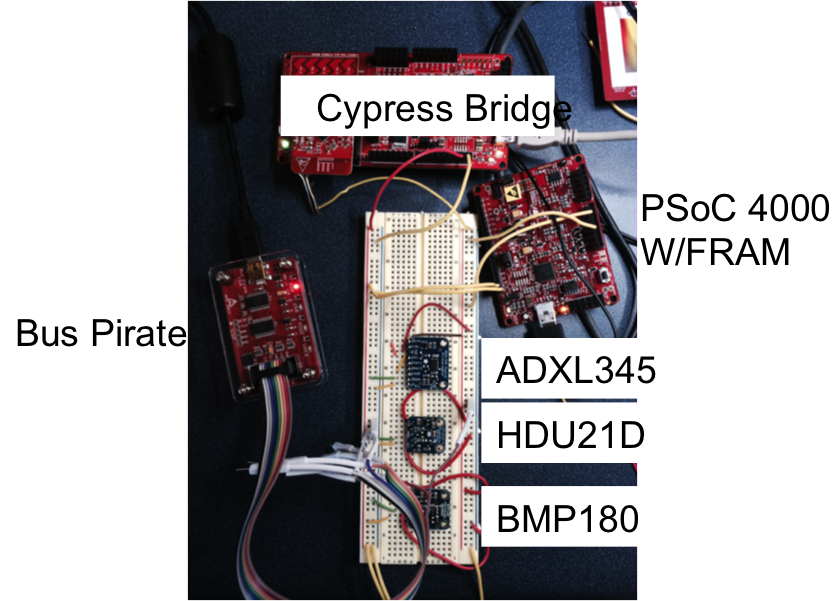
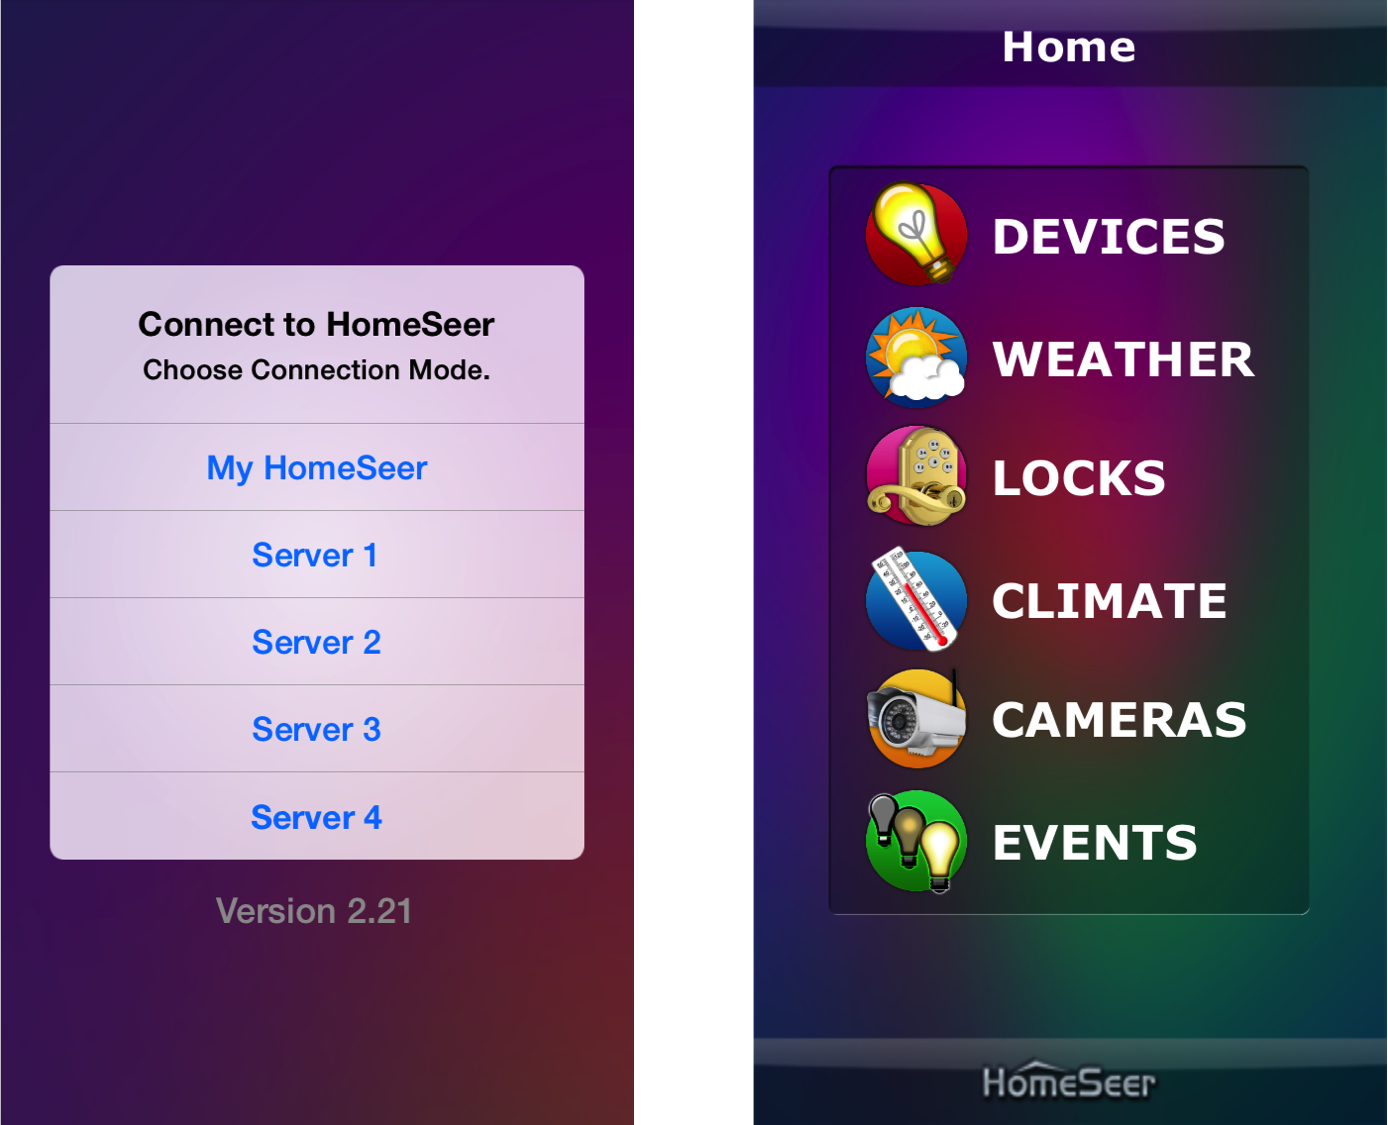
In the previous two Bus Pirate posts, I introduced the Bus Pirate and talked about the V3 version from Sparkfun, and I showed how to use the V3 version from Seeedstudio to read and write I2C commands into a Cypress FRAM.

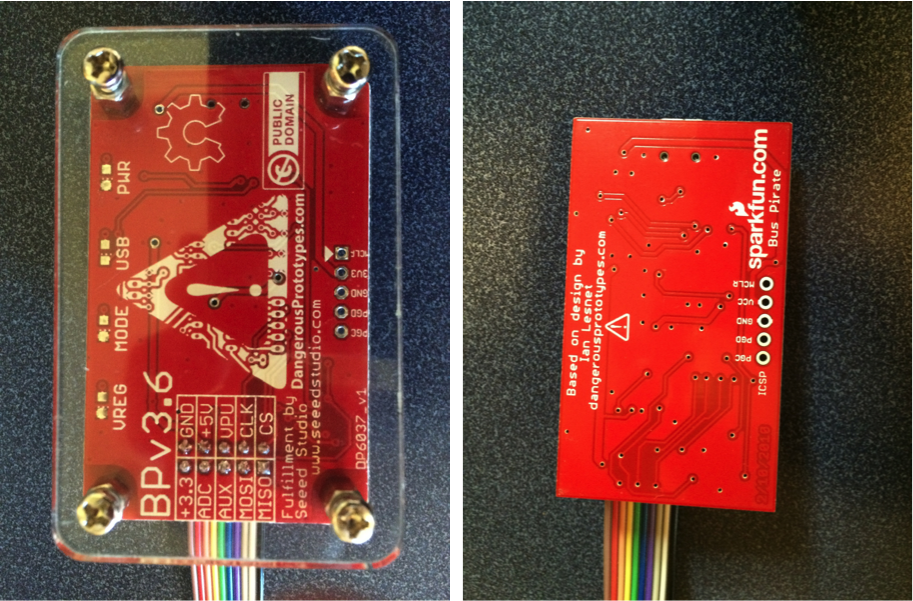
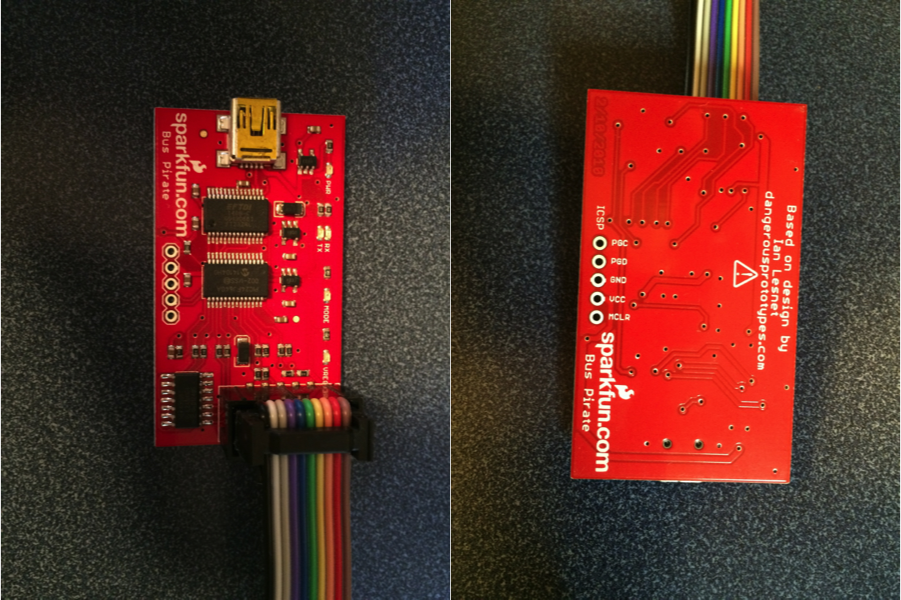
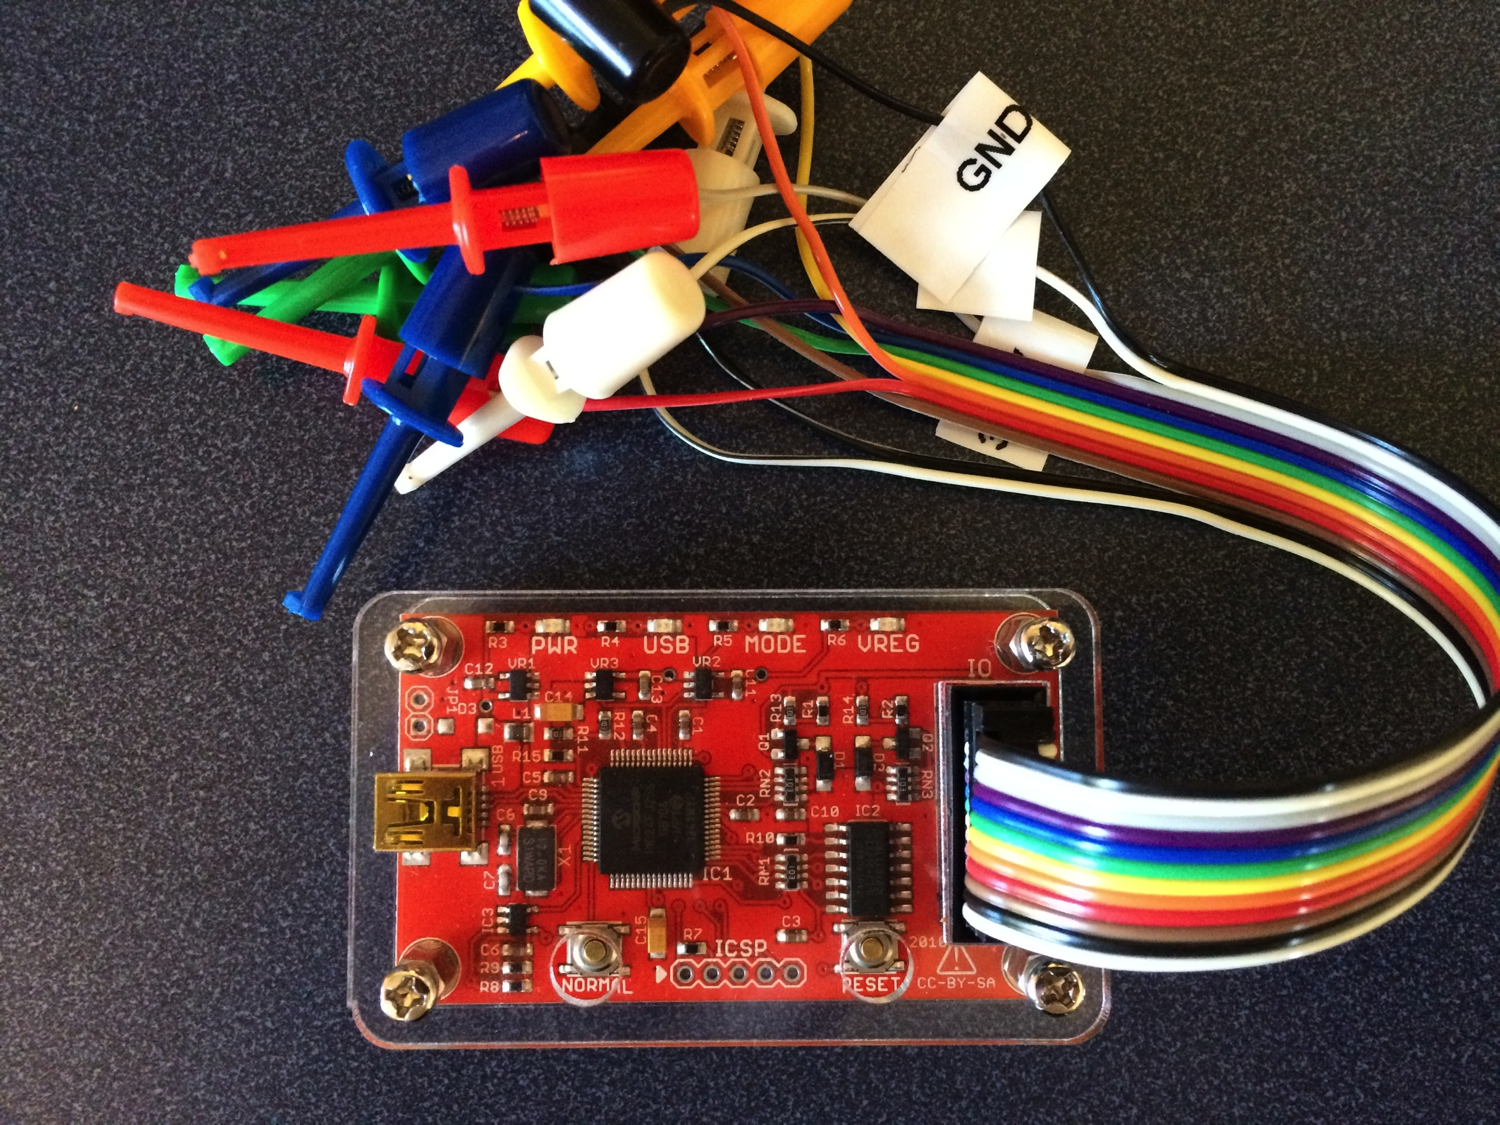
Bus Pirate V4 is a complete redesign of the hardware.  It combines the PIC microcontroller and FTDI USB/Serial bridge into a single chip (a PIC 24FJ256GB106).  Mr. Lesnet also added 3.3v and 5.0v on board regulated voltages, and an onboard eeprom for extra storage.  You can read more on the Dangerous Prototypes web page.

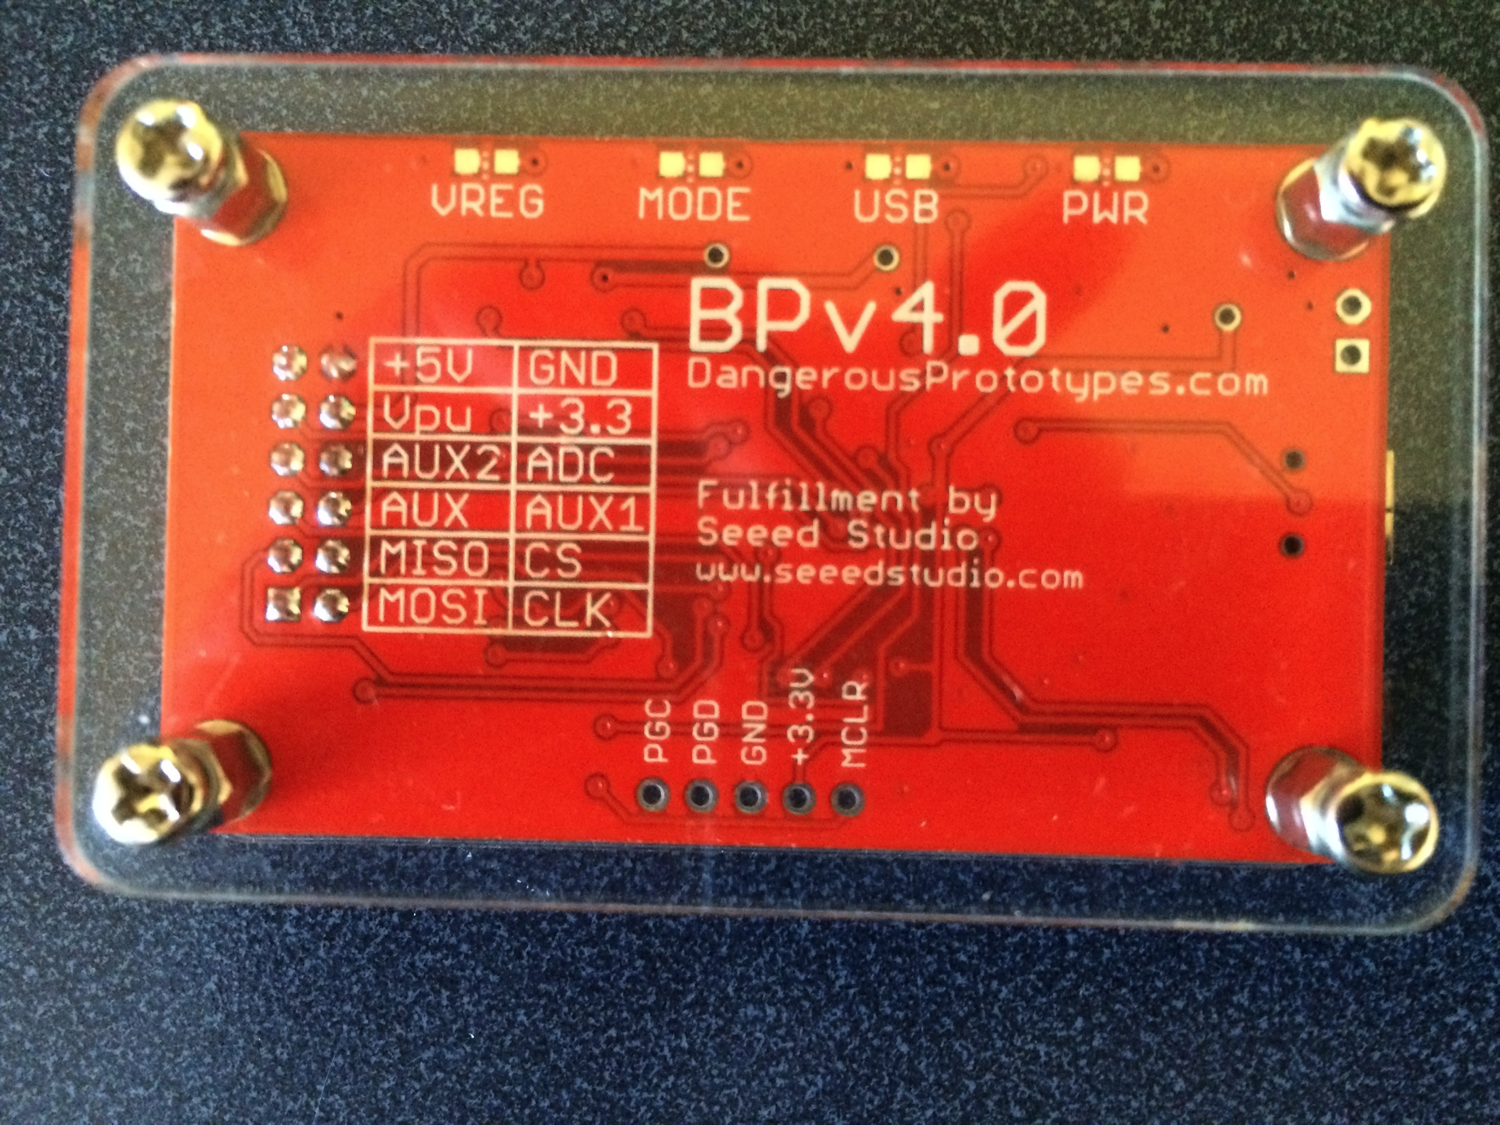
I also ordered the acrylic case (which is cool) as well as the V4 cable (which sucks compared to the V3 cable because the grabbers don’t match the cable color and are signals are unlabeled).

front

On the back of the board you can clearly see the right way to put a silkscreen on a board.  Clear, sensible, legible.

back

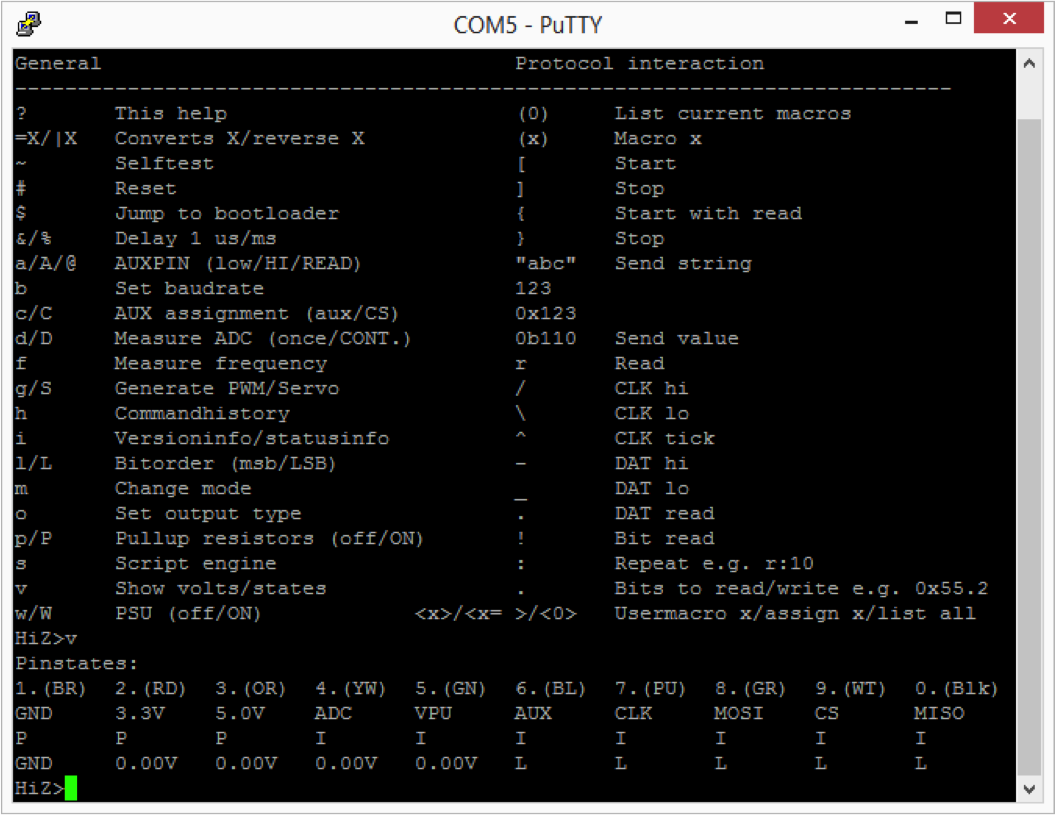
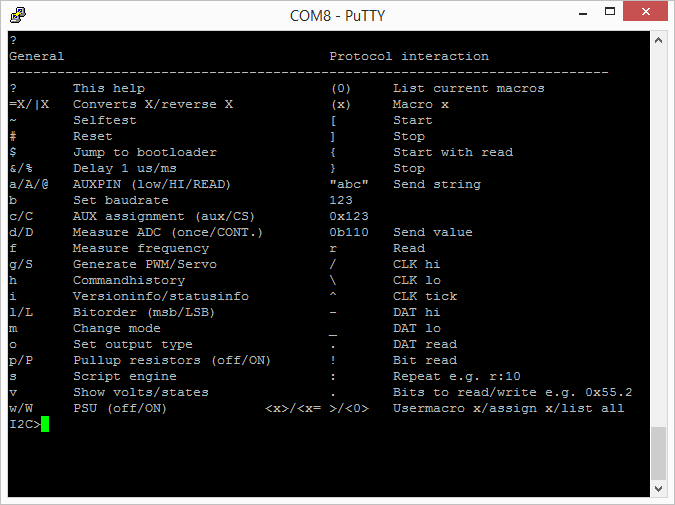
The first thing that I did was “?” to see what was new on the menu.

v4help

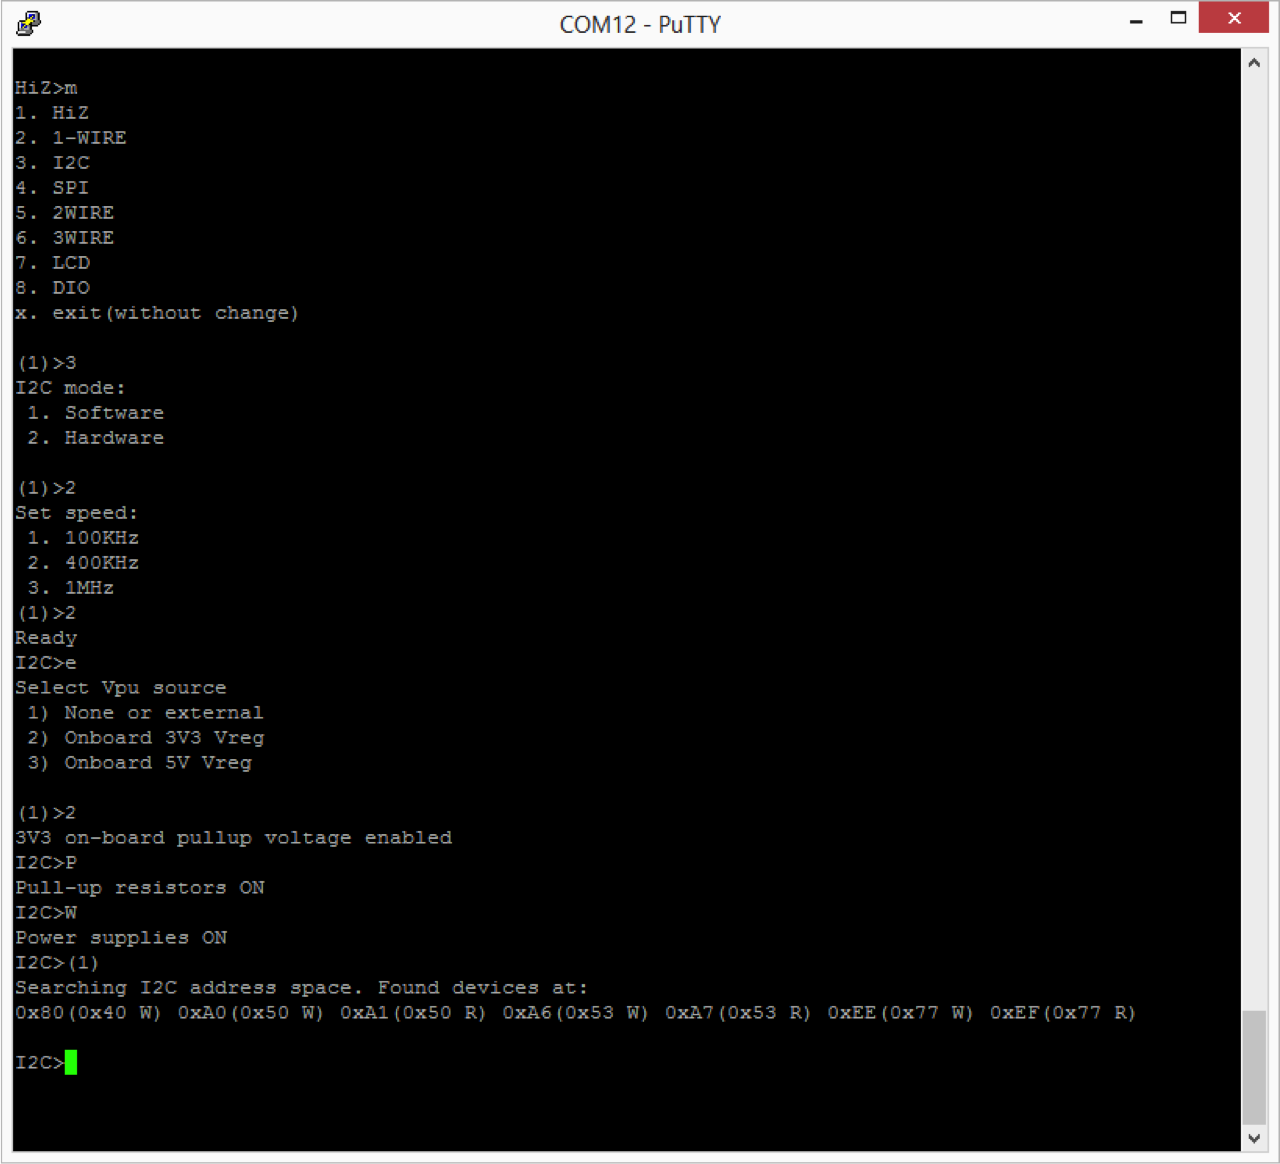
The next thing that I tried was putting the BP into I2C mode.  This was similar to V3 with the exception that now there is a hardware driven I2c and it is capable of 1MHz operation.  The other thing that has been added is a programmable onboard power supply.  You can select either 3.3v or 5.0v by using the “e” command.  The power supply can be turned on/off using “w” (off) and “W” (on).

setupi2c

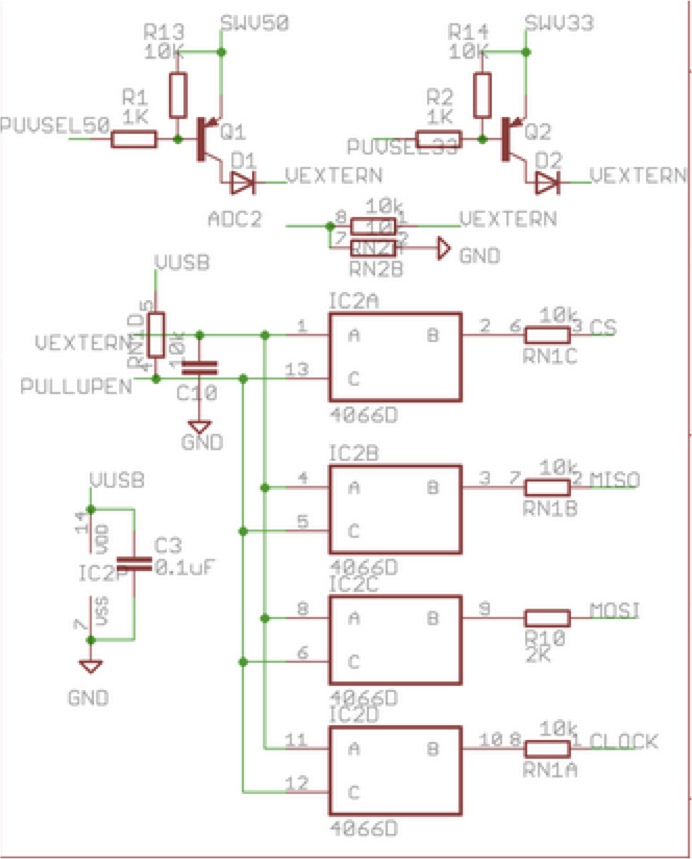
Here is a screenshot of the schematic for selectable regulated pullup.

schematic

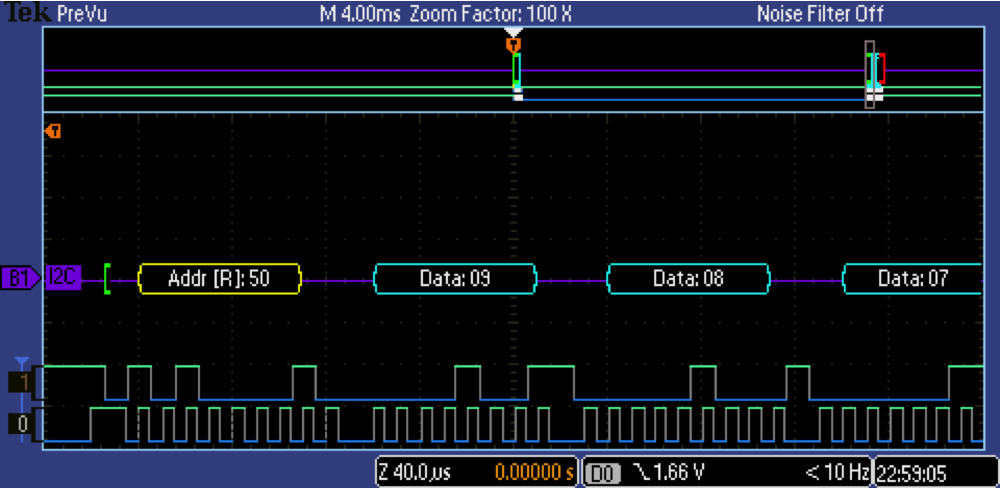
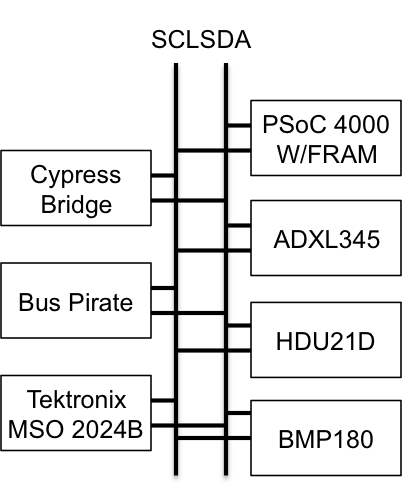
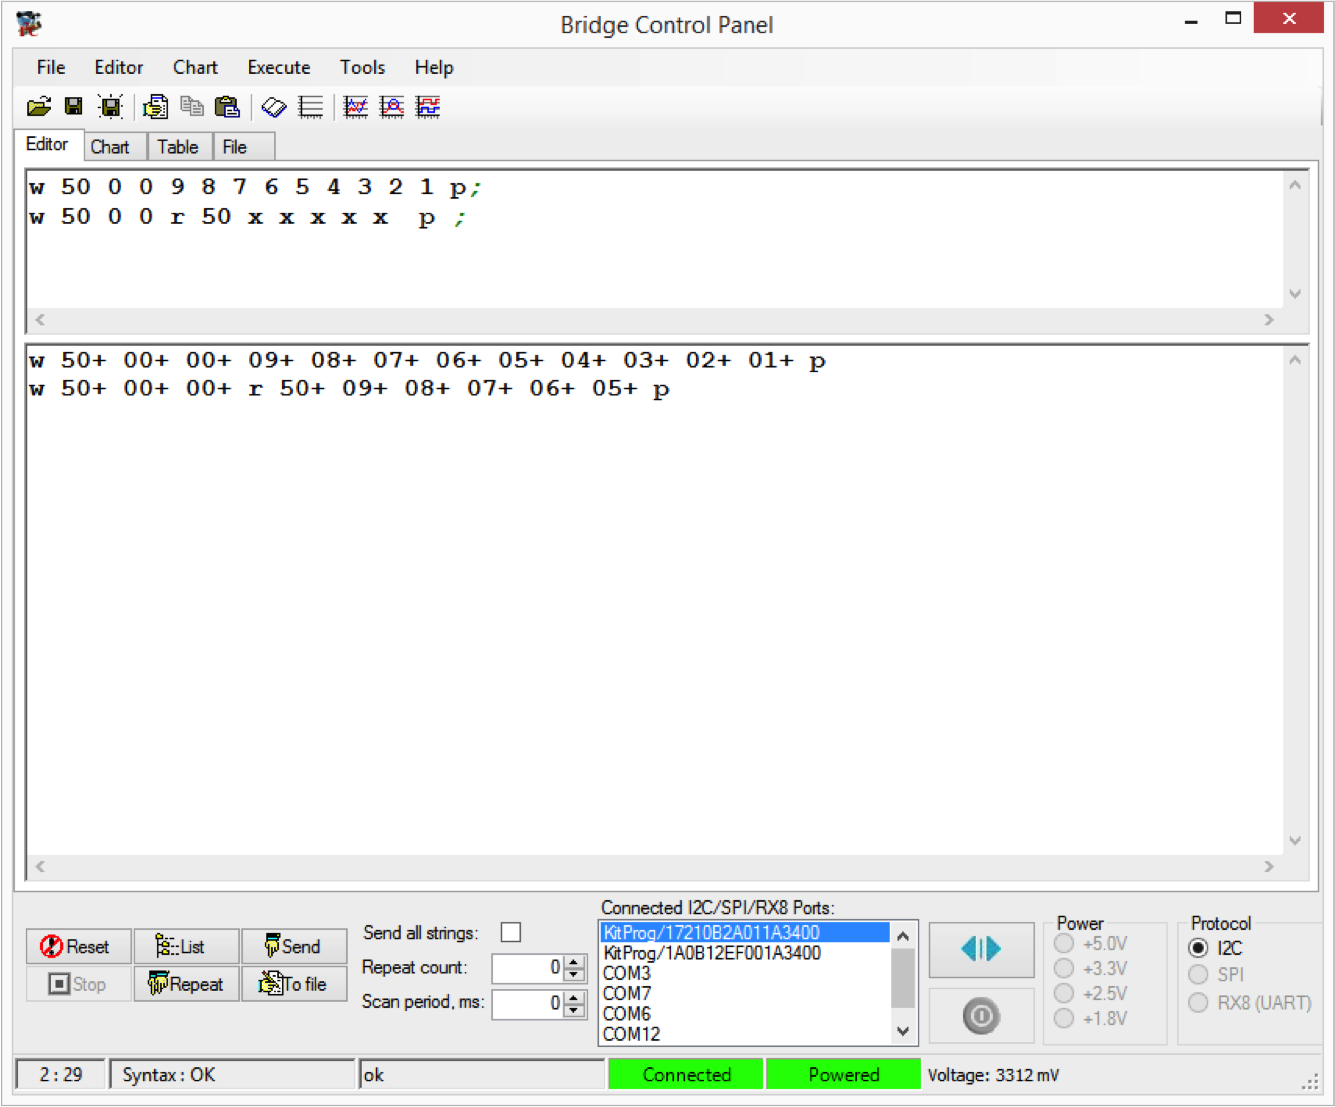
I was interested in trying the Bus Pirate I2C sniffer.  To do this I used the onboard I2C bridge in the “KitProg” on the CY8CKIT042 and used the Cypress Bridge Control Panel (part of PSoC Programmer) to issue I2C commands to the FRAM on my test setup (which is the same as in the previous posts).  In the example below I first issue a “Write, location 0x00, data 9,8,7,6,5,4,3,2,1”  In other words fill up the first 9 locations in the FRAM with 9..1.

The second command issues a “write, location 0x00, Read the next 5 bytes (each “x” reads 1 byte)”.

In the 2nd part of the Bridge Control Panel you can see the actual commands that happened on the bus and the ACKs (“+”) and responses from the FRAM.

bcp

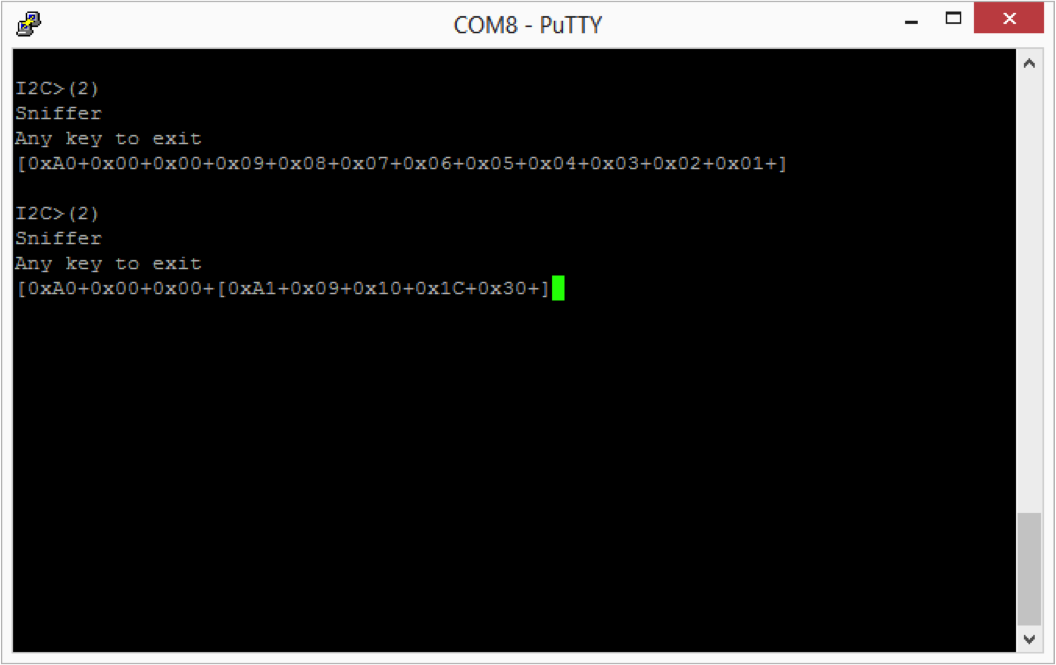
In the screenshot below you can see that the sniffer perfectly “sniffs” the first command.  That is pretty cool… and a very useful function.

In the second case, you can see that the BP sniffer can see the write command perfectly and can read the first byte response from the FRAM perfectly, but does not read the other bytes correctly.  Specifically it reads 0x10, 0x1c and 0x30 instead of 0x08, 0x07, and 0x06.

sniffer

To debug this problem I plugged in my Tektronix MSO2024B logic analyzer to see if there was some problem with the I2C transactions.  However, you can see from the screenshot below that the scope can read transactions perfectly.  So, what is going on?  I don’t know.  But, at this point it seems clear that the sniffer is a bit flaky.  At this point that is going to be a problem for another day.

scope

Bus Pirate V3 (SeeedStudio)

In the previous post, I introduced Bus Pirate  V3 – specifically the Sparkfun version.  After digging through things a little bit I decided to order the SeeedStudio V3 Bus Pirate.  This version has exactly the same firmware, pinout etc as the Sparkfun version.  However, there are a few good improvements in the SeeedStudio version.

First, the silkscreen on the SeeedStudio board is WAY better.  There is no good excuse for having a bad silkscreen on your board.  When you compare the two boards you can easily see the labels that clearly document the pins.

sidebyside

Second, the cable that you can get from SeeedStudio has beautiful heat shrink labels on the end of the cable.  And, more importantly the colors match the pins on the board.  In the picture the below the SparkFun cable colors are correct because I uncrimped the cable and fixed it as I described in the previous post.

side-by-side-top

And lastly, the SeeedStudio version is compatible with their acrylic case which is inexpensive and works well.  It is just two pieces of acrylic that have been laser cut to fit the BP.  Nice.

For my project I have:

  1. An FM24V10 FRAM from mounted onto a PSoC 4000 development kit from Cypress
  2. An ADXL345 3-Axis accelerometer mounted on an breakout board from Adafruit.
  3. An BMP180 Barometric pressure and temperature sensor on a breakout board from Adafruit
  4. A HDU-21D-F Humidity and temperature sensor on a breakout board from Adafruit

Here is the schematic:

schematic

And, here is a picture of the crazy breadboard.

breadboard1


When you attach a terminal program – like Putty – to the usb serial port of the Bus Pirate, you are given a command prompt (press enter to get the prompt).  The first prompt that you get is “HiZ” which indicates that all of the pins of the BP are in high impedance mode.  Then, I issue the “m” command which tells the BP that I want to switch the mode.  I select “4” to put the BP into I2C mode.  I then select “4” to pick 400khz.  Notice that the BP says “~400kz” which almost certainly means that the I2C is implemented with bit banging.  Then I turn on the I2C pullup resistors  using the “P” (capital P) which are on the BP board.  In order for them to work you need to attach the “VPU” pin to either 3.3v or 5.0v.  The last command that I issue is a macro, all the macros are  enclosed in parenthesis.  The macro that I issue is “(1)” which searches the I2C address space (addresses 1-127) and makes a list of all of the devices that respond.

i2csetup

In my setup there are 4 I2C devices

Devices
Device 7-bit address 8-bit read 8-bit write
FRAM 0x50 0xA1 0xA1
ADXL345 0x53 0xA7 0xA6
BMP180 0x77 0xEF 0xEE
HTU21 0x40 0x81 0x80

In order to write to the FRAM you need to issue:

  1. An I2C Start – in BP that means “[“
  2. The 7-bit I2C address of the FRAM (0x50) and the write bit “0”.  AKA 0xA0
  3. The two byte address of where you want to start writing data in the FRAM 0x00 and 0x00
  4. The data – in this case 9,8,7,6,5,4,3,2,1 (which means that locations 0-8 will contain 9..1)
  5. An I2C stop – in BP that means “]”

After issuing this sequence “[0xa0 0 0 9 8 7 6 5 4 3 2 1]” you can see the commands that are actually issueed on the I2C bus as well as the slave FRAM responding with “ACK”.

i2c-commands

The second example which you can see in the above screen shot is to read from the FRAM.  In order to do this you need to issue the following I2C commands

  1. An I2C Start – “[“
  2. The 7-bit I2C address of the FRAM (0x50) and the write bit “0”.  AKA 0xA0 (left shift the 0x50 and or it with the read 0x00)
  3. The two by address of where you would like to read 0x00 and 0x00
  4. An I2C Stop – “]”
  5. An I2C Start (aka Restart) – “[“
  6. The 7-bit I2C address of the FRAM (0x50) and the read bit “1”.  AKA 0xA1 (left shift the 0x50 and or it with the read 0x01)
  7. 5 reads

After issuing this sequence “[0xa0 0 0][0xa1 r:5]” you can see the commands that are actually issued on the I2C bus as well as the slave FRAM responding with the data in the FRAM and the “ACKs”.

In the next post I will introduce the V4 Bus Pirate.

Bus Pirate V3 (from Sparkfun)

One of the common open source development tools is called the Bus Pirate.  It is a low cost ($35) serial terminal based program that can issue commands to many (and mostly serial) busses including UART, SPI, 1-2-3 wire and I2C.  Bus Pirate was developed by Ian Lesnet of Dangerous Prototypes.

I am currently working on a project for a friend of mine  (more to come on this topic) that will read data from 3 different I2C sensors, record the data into a nonvolatile RAM and simultaneously broadcast it over a BLE Radio.  As such, I had a need to make sure that I understood the way that these sensors behave.

The bus pirate has had 4 major revisions and many subrevisions.  The current “stable” version is V3, however, there is a fairly new version V4 which has many improvements and should soon displace V3.

Initially I bought a V3 bus pirate from Sparkfun and the Sparkfun cable,  which I thought would be cool. sparkfun

I started by plugging the BP into a USB port, where it proceeded to enumerate as something my computer had never seen before.  Great.  I looked  around a bit and figured out that the designer had used a FTDI USB to Serial bridge chip as part of the design.  This chip required a custom driver which I found on FTDIs driver website.  This requirement was also documented in the Bus Pirate 101 tutorial.  It is kind of too bad that FTDI hasn’t gotten their driver to be understood by Windows without intervention.  Just one more good reason to use the Cypress USB Serial Chip.

After sorting out the driver situation I attached to the Bus Pirate using my favorite terminal program – Putty.  You can see (by looking at the Device Manager) that the BP enumerated as COM5 on my computer.

devicemanager

The first thing that I tried (without having yet looked at the instructions was “?” which nicely gave a list of the commands (as you can see in the screenshot below).

screen1

I then tried “v” which shows the states of the 10 pins.  Cool.  My first though was “which wire on this cable is pin 1?”  Then I looked at the screen and realized “wow… look at that, the wires on the cable are the same color as the labels on the screen”.  I though that was pretty damn civilized.  I had a variable voltage sitting right next to the kit (just a POT on another devkit that I was working on) so I plugged it into the “YW” (aka Yellow) wire.  After pressing v again it happily reported 0.00v (two decimal places even).  Hmmm… what in the world is going on.   Time for the fluke.  Crazy, the voltage is right, I wonder what isnt working.  I then guessed that the cable was plugged in backwards, but that wasnt it (the cable is keyed).  Then I wondered if there was something wrong with the cable, so I disconnected it and just connected directly to the pin (which is unlabeled on the silkscreen – that sucks).  I found the pinout on the schematic on Dangerous Prototypes.  Then I realized, the cable is BACKWARDS from the real pinout.  That really really sucks.

When I looked at the comments on the Sparkfun page there is quite the little discussion about this topic.  Included is a suggestion to un-crimp the cable, flip it over, and recrimp.  I tried this suggestion and it worked out, until I broke part of the plastic holding the cable together.  After getting the voltage source connected to pin 4 I was able to see changes in the value being read correctly by the analog to digital convertor in the BP.  Cool.

The other comment which caught my attention on the Sparkfun page was a request from Ian Lesnet to please buy from the SeeedStudio website.  This motivated me to purchase another V3 and a V4 from SeeedStudio.  I the next post Ill talk more about my experience with SeeedStudio V3 and V4.

Axeda and ARM Mbed – Part 2

In the previous post I described the “thing” side of an Axeda IOT implementation.  That “thing” was a simple potentiometer, read by an ADC in an NXP1124 ARM MBED development kit.  The value was then encoded into a JSON message and posted to the Axeda cloud over an ethernet/IP connection.

architecture

In this post I will describe the Internet (Cloud) side of their system.  Start by opening http://toolbox.axeda.com and clicking on the little wireless router icon next to the “Your Devices”

axeda-toolbox


You will then have a screen that has the following panels

1. Data Items.  A list of the variables that have been added to your Axeda instance. With links to add, edit and view the data.

2. AMMP Info.  A panel where you can send JSON formatted messages to the server to simulate client behavior.

3. MBED Widget. A graphical representation of one of the data items in a cutesy picture format.

maintoolbox


On the data item panel you can

1. See the current value of your data

2. Manual edit the data (by clicking on the pen/pad icon)

3. View a table of the data (by clicking on the alarm clock icon)

4. View a graph of the data (by clicking on the graph icon)

Main "Data Items" Panel
Main “Data Items” Panel
Table of Data
Table of Data
Realtime Graph of Data

In my next post I will summarize my experience using Axeda and outline some next possible steps.

Home Automation with Zwave and the HomeTroller Zee (Part 6)

For my next installation I decided to try automating the garage door opener. To do this I purchased:

  • ZFM-80US Fixture Switch Module
  • Ecolink Garage Door Tilt Sensor

On at least one site it was stated that you should install a camera to monitor the garage door – specifically that you should look before you close the door.  Ill leave that for another day.  In my previous posts I described the installation of automated lights in my barn.  I decided rather than try to sort out range extenders that I would install another HomeTroller something else that I plan to come back to.

The ZFM-80 is a cool little module.  It has connections for:

  • (L)ine and (N)eutral  (to power the switch)
  • The two connections for the internal relay
  • Two connections for an external switch (you can connect a button to the switch to manually trigger the relay

The front of the switch has a status LED and a button that can serve to trigger the relay or to start pairing mode.

switch

In my garage it was inconvenient to install the switch near the current garage door opener button so I decided to install it near the garage door opener power which was on the ceiling above the garage door opener.  To do this I cut in an “old work” electric box.  Whoever thought this type of box up was a clever person.  If you have not used an old work box, start by cutting a hole in the drywall, then tighten the screws on the box which draws down two plastic clamps to hold the box in place.  In order to make the switch work you need to provide it line voltage, in my case I put a wire between the plug next to my box and my box.  I then attached the switch to two wires running the garage door by cutting the wires in half and shorting the relay connections to the wires.

The installation looks like this:

wires

After that my son 10 year old son buttoned up the wires, box etc.

nicholas
Nicholas installing garage door switch

The last step is to bind the switch to your network.  To do this:

1. Press the button on the Zstick (1 time).  The  blue light will start flashing at about 1Hz

2. Press the button on the Zwave fixture switch module.  The Zstick will bind with the fixture module.  The Zstick will blink rapidly for about 3 seconds, then go back to 1Hz blink rate.  Press the button on the Zstick to end binding mode and then re-insert the Zstick into your HomeTroller.

3. Go the Plug-ins->Z-wave->Controller management.  Then click the yellow arrow on next to the interface.  Then select “import Node Info from Controller and Scan Devices”.  This will import the binding information from the Zstick

switch-bind

After I completed the installation of the switch I then installed the tilt sensor.  This is a simple battery powered device that send out a Zwave status each time it is “tiled” (either up or down).  It does this with a little mercury? switch that contacts (or doesn’t) when the switch is rotate about 90 degrees.  The sensor also reports its battery status.  The documentation says that the battery will last up to 4-6 years.  The physical installation is simple, just attach it to the top of your garage door with the sticky tape and two screws.

tilt

To connect this device to the network

1. Click the Zstick binding button

2. Insert the battery into the Tilt Sensor

3. The Zstick will flash quickly when it binds.

4. Click the Zstick button to take it out of binding mode and re-insert it into the RPi

5. Go the Plug-ins->Z-wave->Controller management.  Then click the yellow arrow on next to the interface.  Then select “import Node Info from Controller and Scan Devices”.  This will import the binding information from the Zstick

The only trick that I found with this part of the installation is that the cover must be firmly on the tilt sensor or the LED will not go out and it wont work correctly.

tilt-connect

Once you have completed the two binding you will should have a device management screen that looks like this:

final

Notice that my tilt sensor is node-4.  When I did the original import, the system got confused and I couldn’t figure out how to fix it.  So, I deleted everything and re-imported the network configuration.

The last thing that you need to do to make this installation work correctly is to create an “event” to run the garage door.  The problem is that when you “click” the switch it will toggle the relay.  In order to operate the garage door you need to toggle it “on” to activate the opener, then you need to toggle it back to “off” in order to re-enable the door.  To do this:

1. Go to the “View->Events” menu.

2. Click the green plus to add an event.

3. Name the event

3. Select If “This event is manually triggered”

4. Then “control a device”

5. Select your switch and set it to “on”

6. Click the green “plus” to add another step

7. Select “Then wait” and enter a few seconds (in my case I picked 5″

8. Click the green “plus” to add another step

9. Then “control a device”

10. Select your switch and set it to “off”

You should end up with an even that looks like this:

event

You can now run the even by pressing the “>” play button thing.  I would like to be able to run this event from a simpler interface, but I don’t know how… for now anyway.  Stay tuned.

Home Automation with Zwave and the HomeTroller Zee (Part 5)

If you want to control your system from an iPhone you will need to enable the HSTouch Server on your Hometrolller (it is on by default).  You can do this from Plug-Ins->Manager.  If HSTouch Server is disabled then you should renable it.

zero

The first step in this process is to create an an account on http://my.homeseer.com

After you have an account you need to add your license (from the back of the HomeTroller) to your account.  This will provide the connection between the HomeTroller (in your house on your private network) and the HomeSeer server (on the internet)

Then you need install the Apple iOS HSTouch application from the App Store

zeroa

After installing the application you need to configure your account and password.  To do this go to the settings menu on your iPhone and select “HSTouch”.  If you dont configure the account and password the HSTouch will just crash with no explanation.

four

After you have configured your account and password, run the HStouch App.  First select “My HomeSeer”, then “Devices”

one

Then select the location – in my case “ground” and “barn”

two

Then select “Barn Inside Lights”.  Then you are able to turn them on or off.

three


That is it.  The interface is kind of clunky, but it is functional.

Home Automation with Zwave and the HomeTroller Zee (Part 4)

In the previous posts I installed the HomeTroller and the Zwave switch.  In order to do anything you now need to read the network information out of the Zstick into the HomeTroller.  In order to accomplish this first:

Select “Plug-ins->Zwave->Controller Management”

one

Then click the yellow arrow to open the interface menu.

two

Then select “Import Node Info from the Controller and Scan Devices”.  This will read the binding information out of the Zstick and initialize all of the required HomeTroller databases.

three

After clicking start, you will get a screen that shows the status of your import process.

foura

I am now able to control the lights from the web server interface.  First select “View->Device Status”

five


Then click on the correct “node” tab.  Then click on the light bulb.

six


You will then be able to turn it “on” or “off”

seven


Another method is to use the “View->Device Management” screen.  You will be able to turn on or off the lights from the right side of the table.

eight

The last thing that you can do to make things a little bit simpler is to assign a sensible name and location to the switches.  You do this by clicking on the current name (looks like a hyperlink).  It will then show up with its new name and location.

nine

In the next post I will describe attaching the HomeTroller to the internet and using the iOS app to control the switches.

Axeda and ARM Mbed – Part 1

Axeda is one of several (at least a half dozen) companies that sprung up to service the “Cloud” side of the IOT boom.  They were successful enough to have been purchased in August by a company called “PTC” (for some reason it isn’t easy from their website to figure out what the letters P.T.C stand for), presumably for a big pile of money.  Axeda is focused on the Cloud part of the business, including tools to store, analyze and control IOT machine data.

Axeda offers several embedded development kits including ones for ARM MBED, TI, Freescale, Inventek and Raspberry Pi.  The kits aren’t so much hardware as they are a set of libraries to allow you to use those platforms to interface with the Axeda Developers Cloud.  In order for any of these kits to work you need to have:

  • A physical layer (ethernet or wifi)
  • A network layer (tcp/ip)
  • A protocol layer (http)
  • An application layers (json formatted data)

In this article, we will be focusing on the ARM MBED kit.

The architecture of the Axeda + MBED solution is as follows:

architecture


The ARM MBED kit is build with an NXP LPC-1768 ARM based microcontroller.  MBED is a cloud based development environment for building embedded firmware for ARM based microcontrollers.  The MBED kit is then attached to an expansion board that was designed by ARM that has two potentiometers, an ethernet port, temperature sensors etc.

mbed

In order to transfer data from the development kit to the Axeda cloud, you need to format your data in a JSON message and transmit it using HTTP to the Axeda server.  This seems complicated, but it is really pretty simple.  JSON stands for JavaScript Object Notation and is just a text based, human-readable format that is an alternative to XML.

A simple example that encodes two name value pairs (potval and temperature):

{
“data”: [
{
“dataItems”: {
“potvalue”: 10,
“temperature”: 10
}
}
]
}

To transmit this to the Axeda cloud, you just embed the JSON into an HTTP POST to the correct web page (which has your Axeda Serial number. Here is the snipped of code from MBED that formats my example message.  Notice that there are two data variables, one called oil_level and one called oil_level2:

snprintf(http_cmd, http_cmd_sz,
“POST /ammp/data/1/%s!%s HTTP/1.1\r\nContent-Type: application/json\r\nContent-Length: 65\r\n\r\n{\”data\”:[{\”di\”:{\”oil_level\”:%.2f, \”oil_level2\”:%.2f}}]}\r\n\r\n”,
MODEL, SERIAL_NUM, oil_level, oil_level2);
printf(http_cmd);

Here is the whole program:

The first section initializes the two ports for the potentiometers, sets up the LED output and makes a few buffers.  The blued out section of code is my serial number.

prog1


The next section of code starts the ethernet interface and gets an IP address.  Notice that these are library routines that are provided by the ARM MBED compiler.

prog2

Then the last section of code reads the potentiometers, and then if they have changed enough, transmit the values to the Axeda cloud over a TCP/IP socket.

prog3


In part 2, I will show how to look at your data in the Axeda cloud.