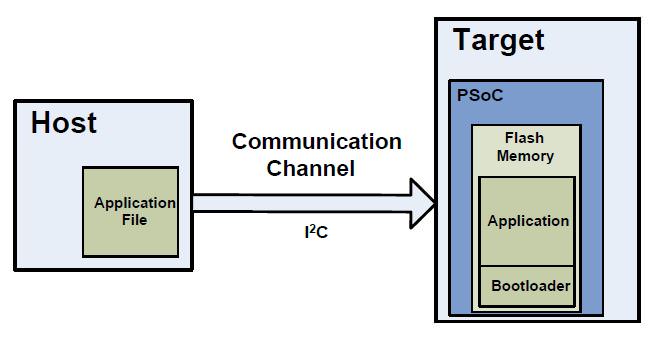
I use PSOC4 to invent all kinds of unique solutions for customers. Usually, they want them field upgradeable to deploy new features or fix bugs. Fortunately Cypress has a great I2C boot loader to meet this need, so I use the heck out of it.
Cypress has a great debugger built into PSOC Creator which fully supports all the ARM Serial Wire Debug protocols such as breakpoints, single step, memory, register viewing etc. However, when you are running a boot loader the debugger does not work! Why not? Because with a boot loader there are two applications resident in PSOC4: The boot loader and application. This is not supported by Cypress implementation of SWD.
Where does this leave you, the intrepid code developer, when debugging a boot loader project? Personally, I have used all kinds of methods: debug UART interface, debug I2C interface, bang out states on pins, debug Bluetooth interface … and on and on. You get the idea. All these methods burn a communications interface and require extra pins on the chip. Sometimes that’s not possible.
The issue recently came to a head when a customer very nearly in production experienced a boot loader failure. One system out of a few thousand was “bricked” when they tried to field update in the lab. Their pinout is frozen, they can’t add new hardware so how do we look inside PSOC4 and see what’s going on?
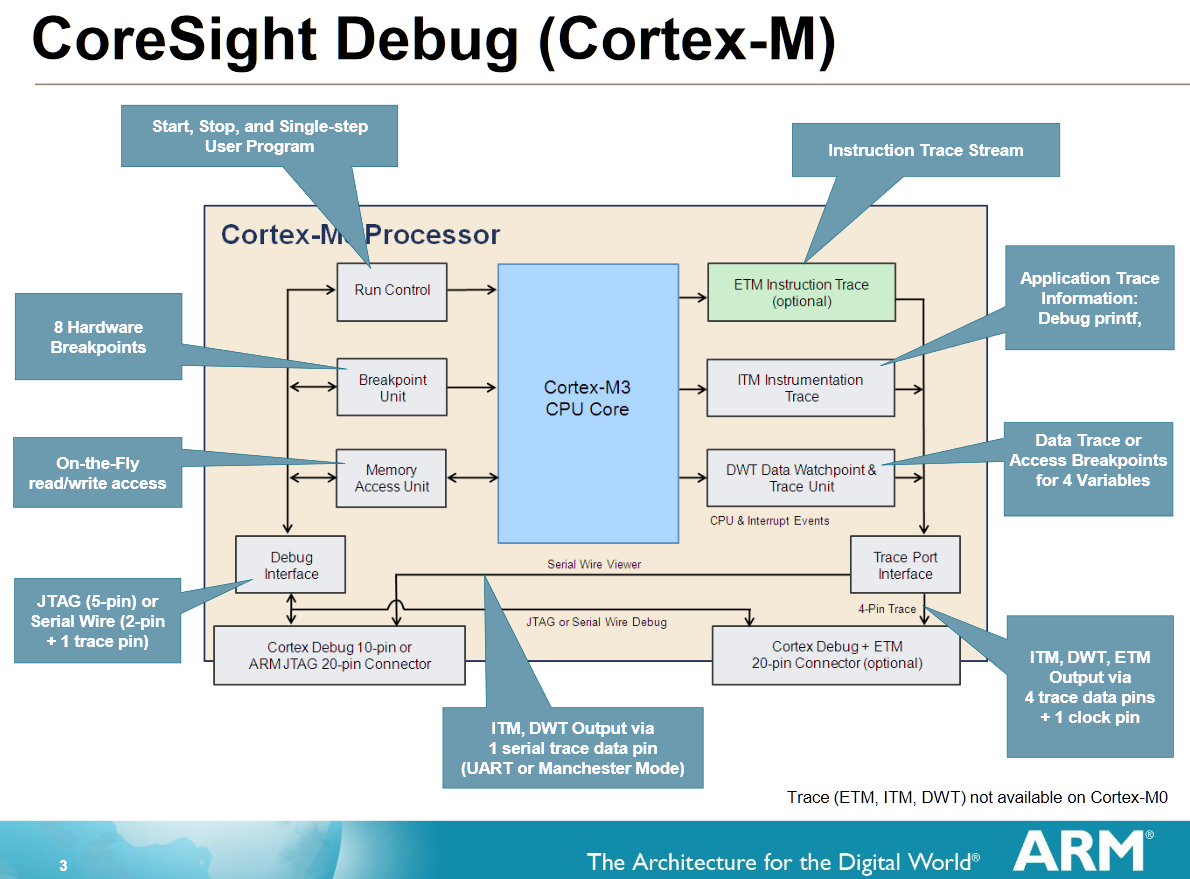
I woke up at 2 AM and thought “Ah Ha! SWV!” (Yes, I Am A Geek) Serial Wire View is an ARM native debug protocol that let’s you XRAY the insides of any ARM MCU with the right interface. SWV is a protocol which runs on the SWD pins (clock and data) but also needs the Serial Wire Output (SWO) pin. Cypress left the SWO pin and associated IP off of PSOC4 to save die cost, foiling my great idea. Brief interlude to drink and bang head on desk.
Fortunately, I don’t give up easily. At least my subconscious does not. Woke up the next night thinking “Ah Ha!” again. Wife was mildly annoyed, but tolerates my idiosyncrasies.
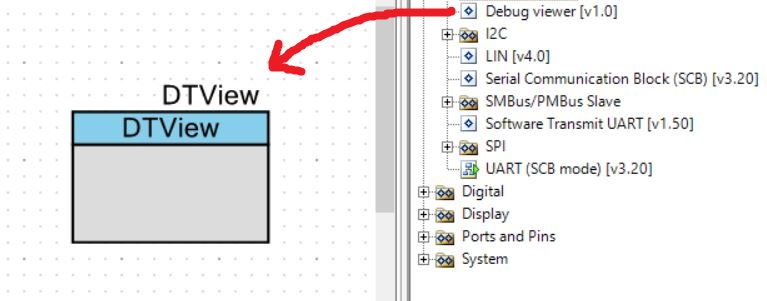
Cypress has a nice software UART transmitter implementation. I shamelessly stole it, modified for my purposes and created a custom component. (It’s pretty easy to do this by the way) Baud rate was modified to 230 KBps and the output pin forced to a specific pin with a control file.
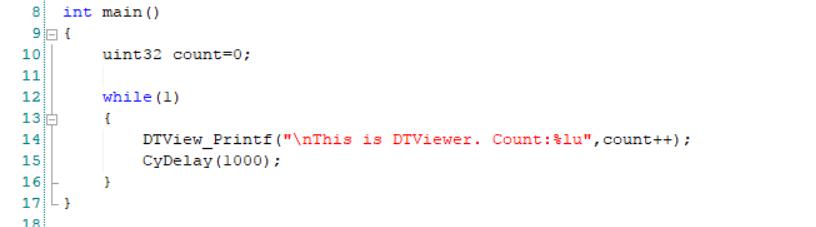
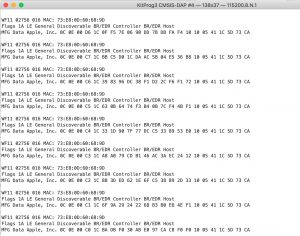
Once the component is in place, you can use its _DView_Printf( ) API call to display any debug data. Here is an example:
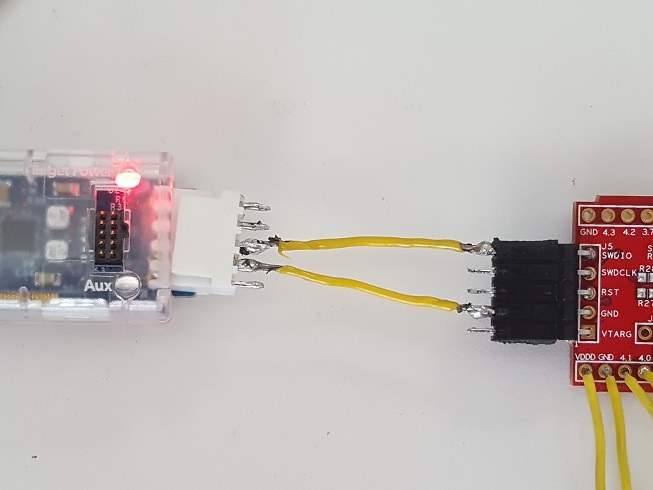
More about that output pin. Cypress sells a tool for programming and debugging PSOC called CY8CKIT-002, aka MiniProg3. The programming connector consists of VDD, GND, reset, SWD clock and SWD data as shown below.
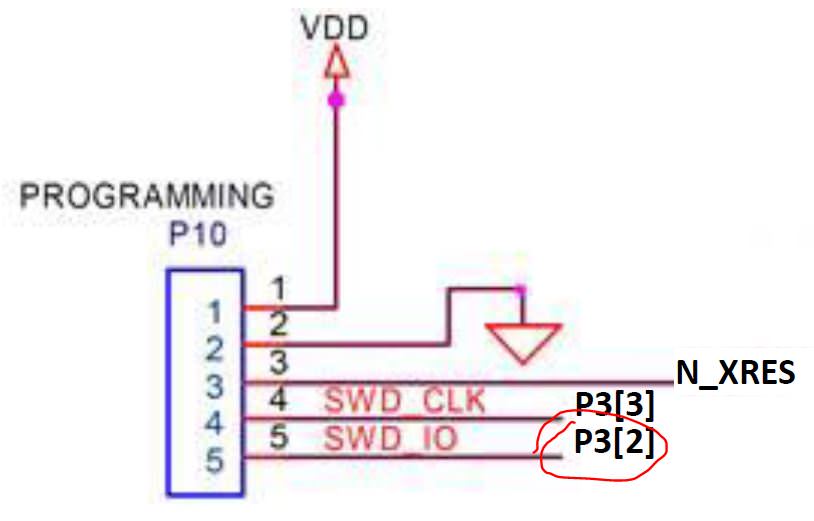
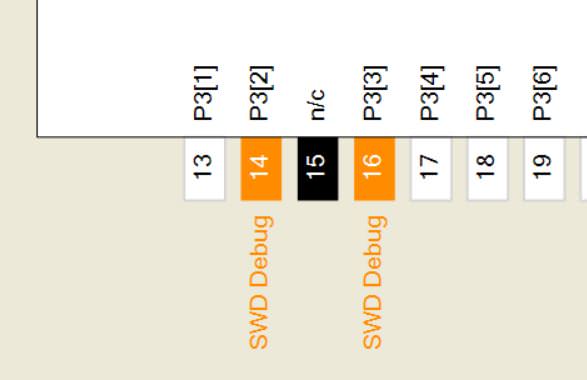
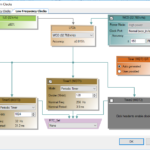
Since we can’t use SWD protocol for debugging anyway, we can change the pins from SWD to normal GPIO. The pins still function for programming. By default they are in SWD mode as shown.
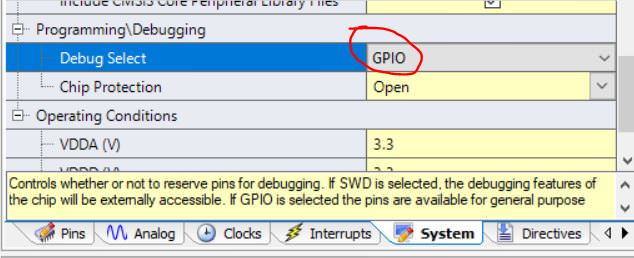
Going to the system tab of the .CYDWR file, we can change them to GPIO.
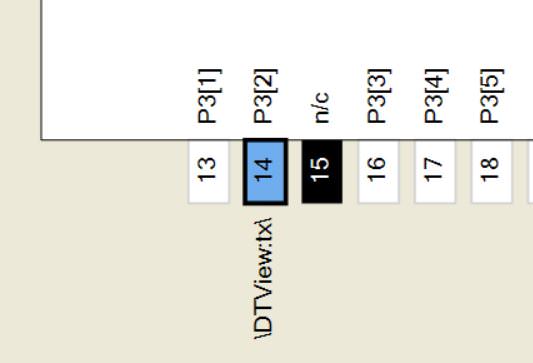
Once we do that, the pins look like this. Here’s the trick. We now assign the TX output of our DTView component to pin 3[2], which is available on the SWD programming header, pin 5.
Can you see where we are going with this? Printf( ) data is now coming out of PSOC4 on pin 3[2], easily accessible on our debug header. This is where MiniProg3 comes in. It can actually receive data as a 230 KBps RX UART on its XRES pin. Weird, right? By building a simple interface cable we can get the data from your debug header into MiniProg3.
MiniProg3 XRES —— SWD HEADER pin 5
MiniProg3 GND —— SWD HEADER pin 2
However, MiniProg3 does not show up as a COM port on your PC, so how do we the data? It needs to be accessed by a host application running the PP_COM API. This is documented under PSOC Programmer Component Object Model COM Interface Guide, Cypress specification 001-45209. If you installed PSOC Creator or Programmer, this document is actually on your PC under C:\Program Files (x86)\Cypress\Programmer\Documents. Engineers don’t like to read instructions. Amazing what you can find when you do.
I wrote a simple console application which opens MiniProg3 using PP_COM, retrieves data from the serial RX pin via USB and displays it like a simple terminal program. Voila! You now have a serial debugger that works for any PSOC4 project using MiniProg3 as your USB to serial dongle.
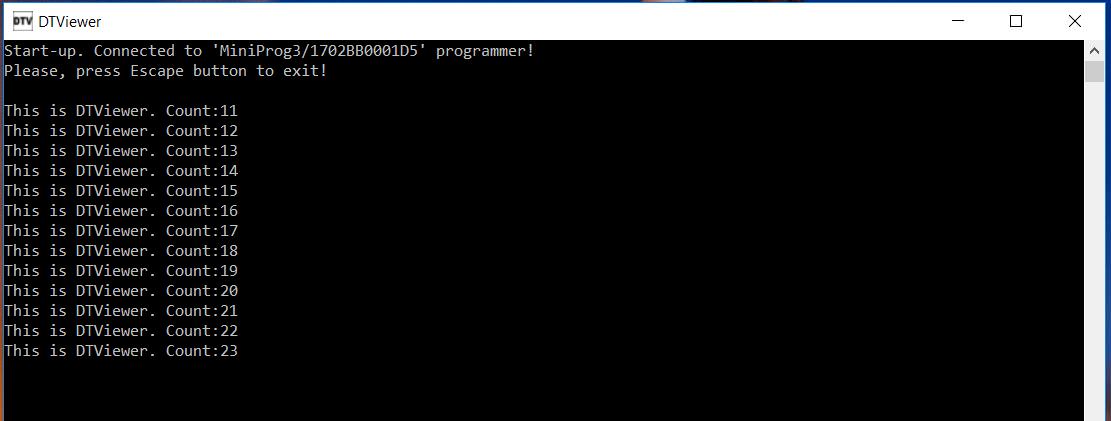
Customer was really happy with this. We were able to immediately see his problem and fixed it in about 5 minutes.
Finally, here are all the source files
DTView Firmware : PSOC Creator example project and DTView component
DTViewer Binary : Installer for DTViewer console
ViewerSource : Complete source code for DTViewer console (Requires Visual Studio 2015)
That’s all. Have fun with the new debugging tool.
DTV
No comment yet, add your voice below!