Summary
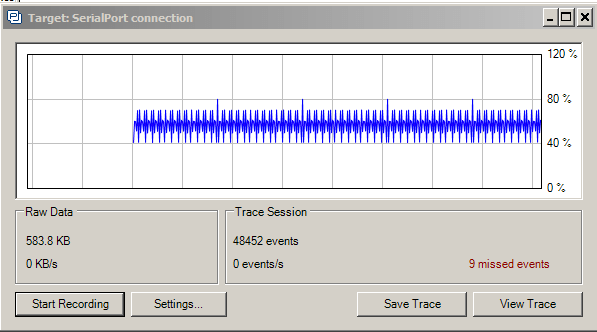
In the previous article I showed you how to make a PSoC Tracealyzer Streamport using the SCB based UART on a PSoC 4200M. It didn’t take long for me to realize that 115200 baud was not going to cut it. That realization lead me to figure out that the KitProg on the CY8CKIT-044 was limited to 115200, which I worked around by using the Cypress USB Serial Bridge that I got from the CY8CKIT-049. But when I look at the CPU graph I found out that it took 50% of the CPU to support streaming the data. So now what? In this Article lets analyze the data, both old school with a logic analyzer, and new school with PSoC Tracealyzer.
Analyzing the PSoC Tracealyzer Data
While I was capturing the streaming data from PSoC Tracealyzer I could see that the CPU was burning about 50% of the time just running the TzCntrl and blinking LED thread. That isn’t good.
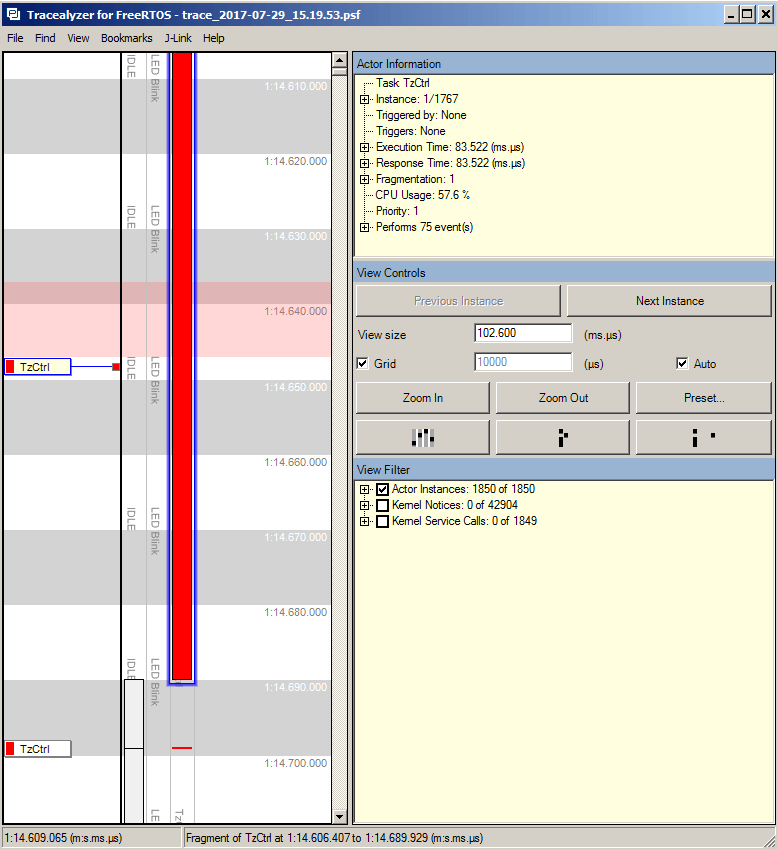
When you look at the PSoC Tracealyzer trace viewing you can see the problem is the TzCtrl task. This task is running for 83 milliseconds and using 57.6% of the CPU.
If you look at the data transmit function called “PSoC_Transmit”, there isn’t much going on. Just a call to UART_SpiUartPutArray. But if you look at the UART documentation you will find that SpiUartPutArray is a blocking function, meaning it doesn’t return until it is done. If you calculate the time to transfer a block of 1024 bytes at 8bits/byte and 230400 baud you will find that just sending the data takes 35ms.
int32_t PSoC_Transmit(void* data, uint32_t size, int32_t *numOfBytesSent )
{
    timing_Write(1);
    UART_SpiUartPutArray((uint8_t *)data,size);
    *numOfBytesSent=size;
    timing_Write(0);
    return 0; // Doesnt matter what you return... i dont think that it is checked
}
I was not very sure why the task was taking 83 milliseconds to run when the data transfer was only taking 40ms. To figure this out I added a toggle pin to the data write routine, just to make sure. What I found is the data write routine is getting called about every 70ms takes ~30ms to run.
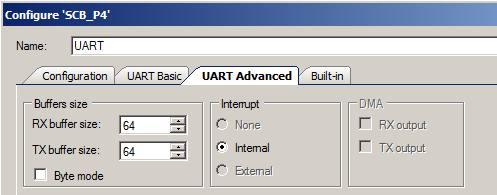
How is that possible, the calculation says that it should take 35ms. It turns out that I configured the UART to have a 64 byte buffer.
When you remove the 64 bytes from the calculation you end up with 32ish milliseconds. The other thing that this chart shows is that the TzCntrl task is calling the PSoC_Transmit function more frequently that I thought, at least twice per cycle. You can also see from the plot that function is taking 30/70=42.8% of the CPU by itself. Not good, but we are starting to understand what is going on.
As I typed this part of the Article I realized that toggling a GPIO probably wasn’t the best way to figure out what was happening. In fact, that is the whole point of Tracealyzer, that is analyzing the performance of your program. When I looked at the Tracealyzer documentation (I always hate doing that), I found a nice function called vTracePrintf. I added a “toggle” aka printing a 0 and printing a 1 into trace channel 0.
int32_t PSoC_Transmit(void* data, uint32_t size, int32_t *numOfBytesSent )
{
    timing_Write(1);
    vTracePrintF(0,"1");
    UART_SpiUartPutArray((uint8_t *)data,size);
    vTracePrintF(0,"0");
    timing_Write(0);
    *numOfBytesSent=size;

    return 0; // Doesnt matter what you return... i dont think that it is checked
}
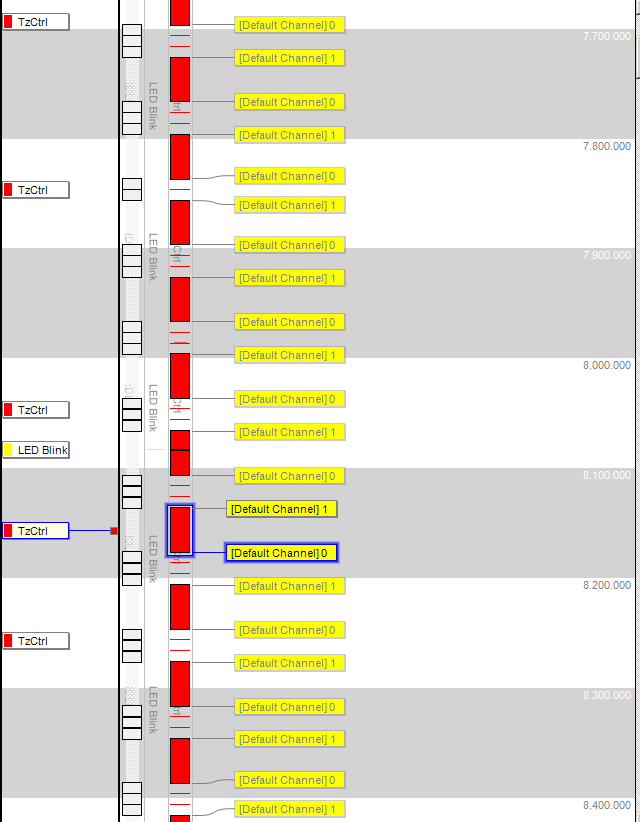
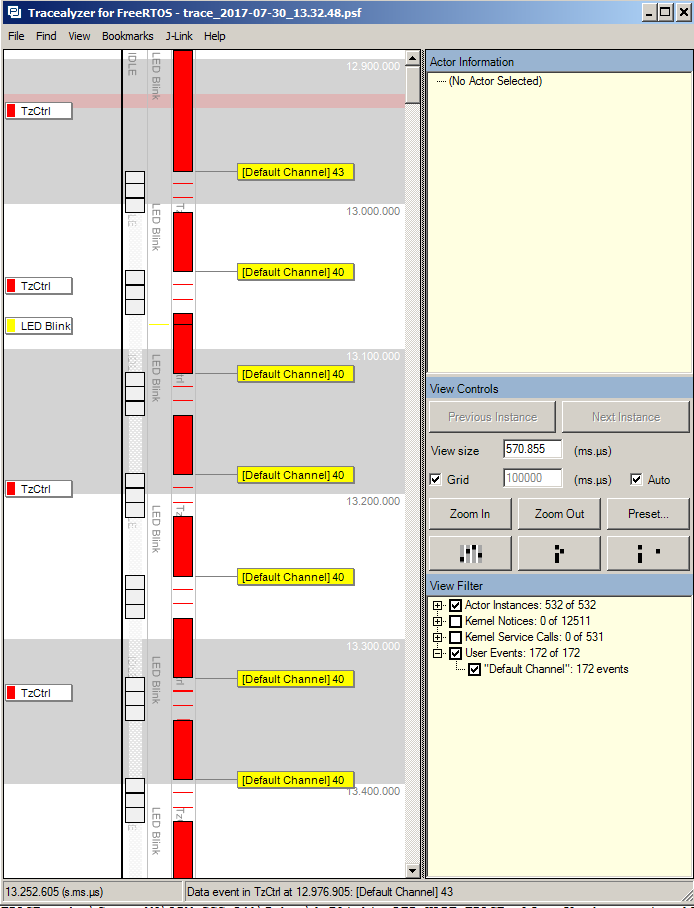
After running another trace, look what I get. You can see the “1” printing at the start and the 0 printing at the end.
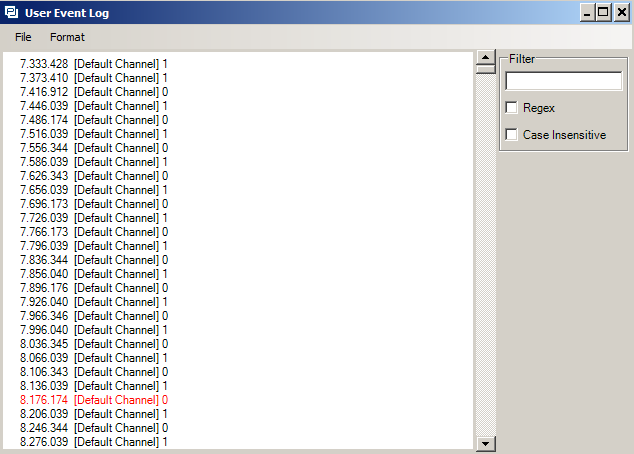
Even better, when I double clicked on the “[Default Channel] 0” it took me to this nice screen which shows when the events occurred. The one that I clicked on started at 8.136.039 and ended at 8.176.176, in other words it took about 40ms
After hand calculating the time, I realized that once again I should have done something even more obvious, let the ARM calculate the time. the vTracePrintf will let you specify the output format, in this case a %d
int32_t PSoC_Transmit(void* data, uint32_t size, int32_t *numOfBytesSent )
{
    TickType_t time;

    timing_Write(1);

    time = xTaskGetTickCount();
    UART_SpiUartPutArray((uint8_t *)data,size);
    time = xTaskGetTickCount() - time;
    vTracePrintF(0,"%d",time);
    timing_Write(0);
    *numOfBytesSent=size;

    return 0; // Doesnt matter what you return... i dont think that it is checked
}
When you look at the trace, you need to click on the “User Events” to see the print outs from the trace.
Now that we have a pretty good feel for what is going on, how do we fix it? Simple, use the PSoC DMA take the CPU mostly out of the UART transmission path, which is the topic of the next Article.
As always you can find all of these projects on the IotExpert GitHub site or git@github.com:iotexpert/PSoC-Tracelyzer.git
Article
Description
Percepio Tracealyzer & PSoC
An Introduction to Percepio Tracealyzer on the Cypress PSoC
Percepio Tracealyzer RTT Streamport - PSoC4200M
Make the JLINK RTT Library work with Tracealyzer
Percepio Tracealyzer PSoC UART Streamport
Creating a UART Streamport
Percepio Tracealyzer - Analyzing the PSoC Tracealyzer Streamport
Figure out what is broken in the UART Streamport
Percepio Tracealyzer - Using PSoC DMA to Fix the UART Streamport
Implementing PSoC DMA to improve the CPU Utilization
Percepio Tracealyzer - Running on PSoC6
Porting the Percepio Tracealyzer to PSoC6
