Summary
As you have probably noticed, I have spent a significant amount of time in the last few months doing FreeRTOS projects. One thing that I have been continuously frustrated about is a lack of analysis tools. How much memory am I using? How much stack and heap are free? How long are tasks taking? How do you get the priorities set right? And on and on. A couple of weeks ago I got an email from the guys at Percepio asking me if I wanted to try out the Percepio Tracealyzer. I said yes… but that I was really busy and it was going to take a while for me to get to it. So now I have… and this is the first article about the Percepio Tracealyzer. Unfortunately the story involves me burning myself with a soldering iron but I suppose that isn’t their fault.
In this series of article’s I will instrument the FreeRTOS projects that I have been showing you with the Percepio Tracealyzer Recorder Library, then run the tool to see what is going on. In this specific Article I will show you how to get the most basic Tracealyzer functionality going on a PSoC4200M.
Percepio Tracealyzer
The way that Percepio Tracelzer works is that you install a bit of code into your project called the Tracealyzer Recorder Library. In streaming mode, the code creates a new task in FreeRTOS called “TzCtrl” which interacts with the FreeRTOS kernel to record all of the running task information into a communication link (e.g UART, SPI, JLINK RTT, etc.) In snapshot mode, the kernel information is just written to an SRAM buffer inside of the PSoC.
This is the architecture picture from the Percepio website:

Updating CY8CKIT-044 PSoC4200M Development Kit
To make the Percepio Tracealyzer work you need to turn the “Snapshot or streaming” line from the picture above into a real connection. In snapshot mode there are two ways (I think) that you can do it.
- You can stop the processor with the debugger, then write the region of memory with the trace buffer into an “.hex” or a “.bin” file. Then read that file into Percepio Tracealyzer. Unfortunately the debugger in PSoC Creator cannot create binary output files of regions of memory like that… so plan 1 is out the window
- You can attach a Segger JLINK to the PSoC via SWD. Then, Tracealyzer knows how to talk to the JLink to read the memory. This is what I am going to do for this Article.
One feature that is very cool about the Snapshot methodology is that Tracealyzer can search the output file and find the trace buffer. The trace buffer data structure is marked by something that Tracealyzer can find.
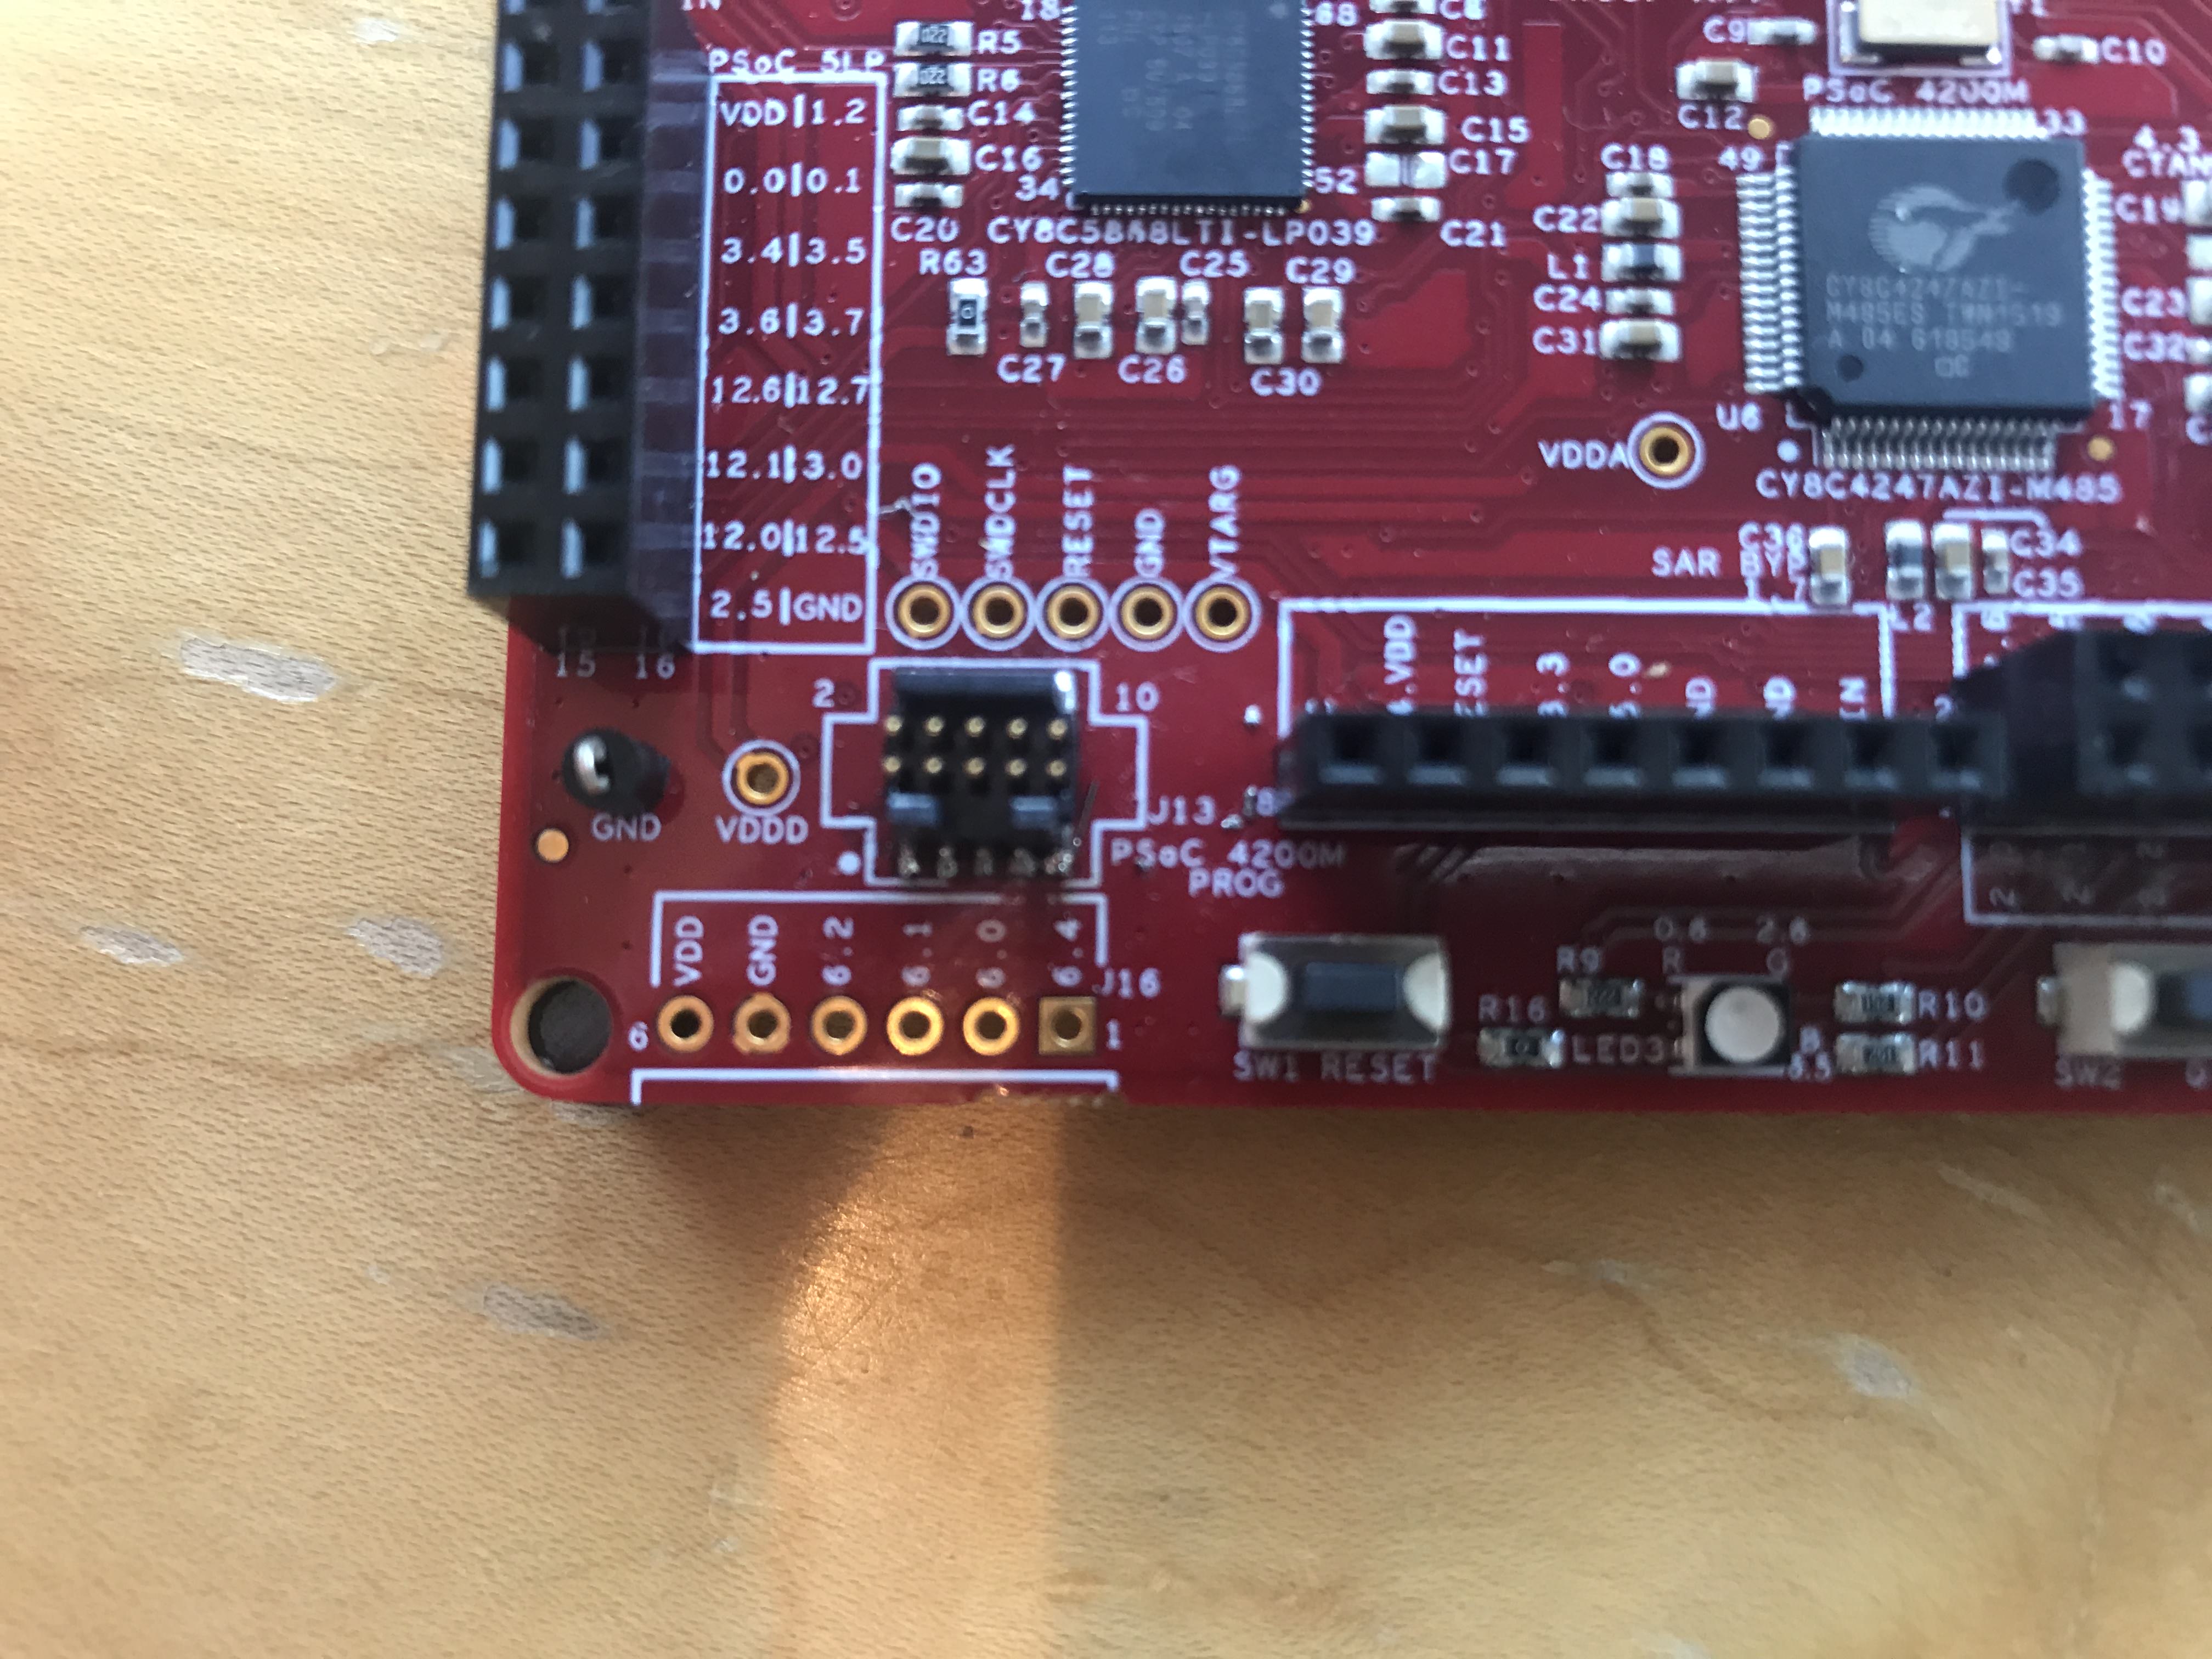
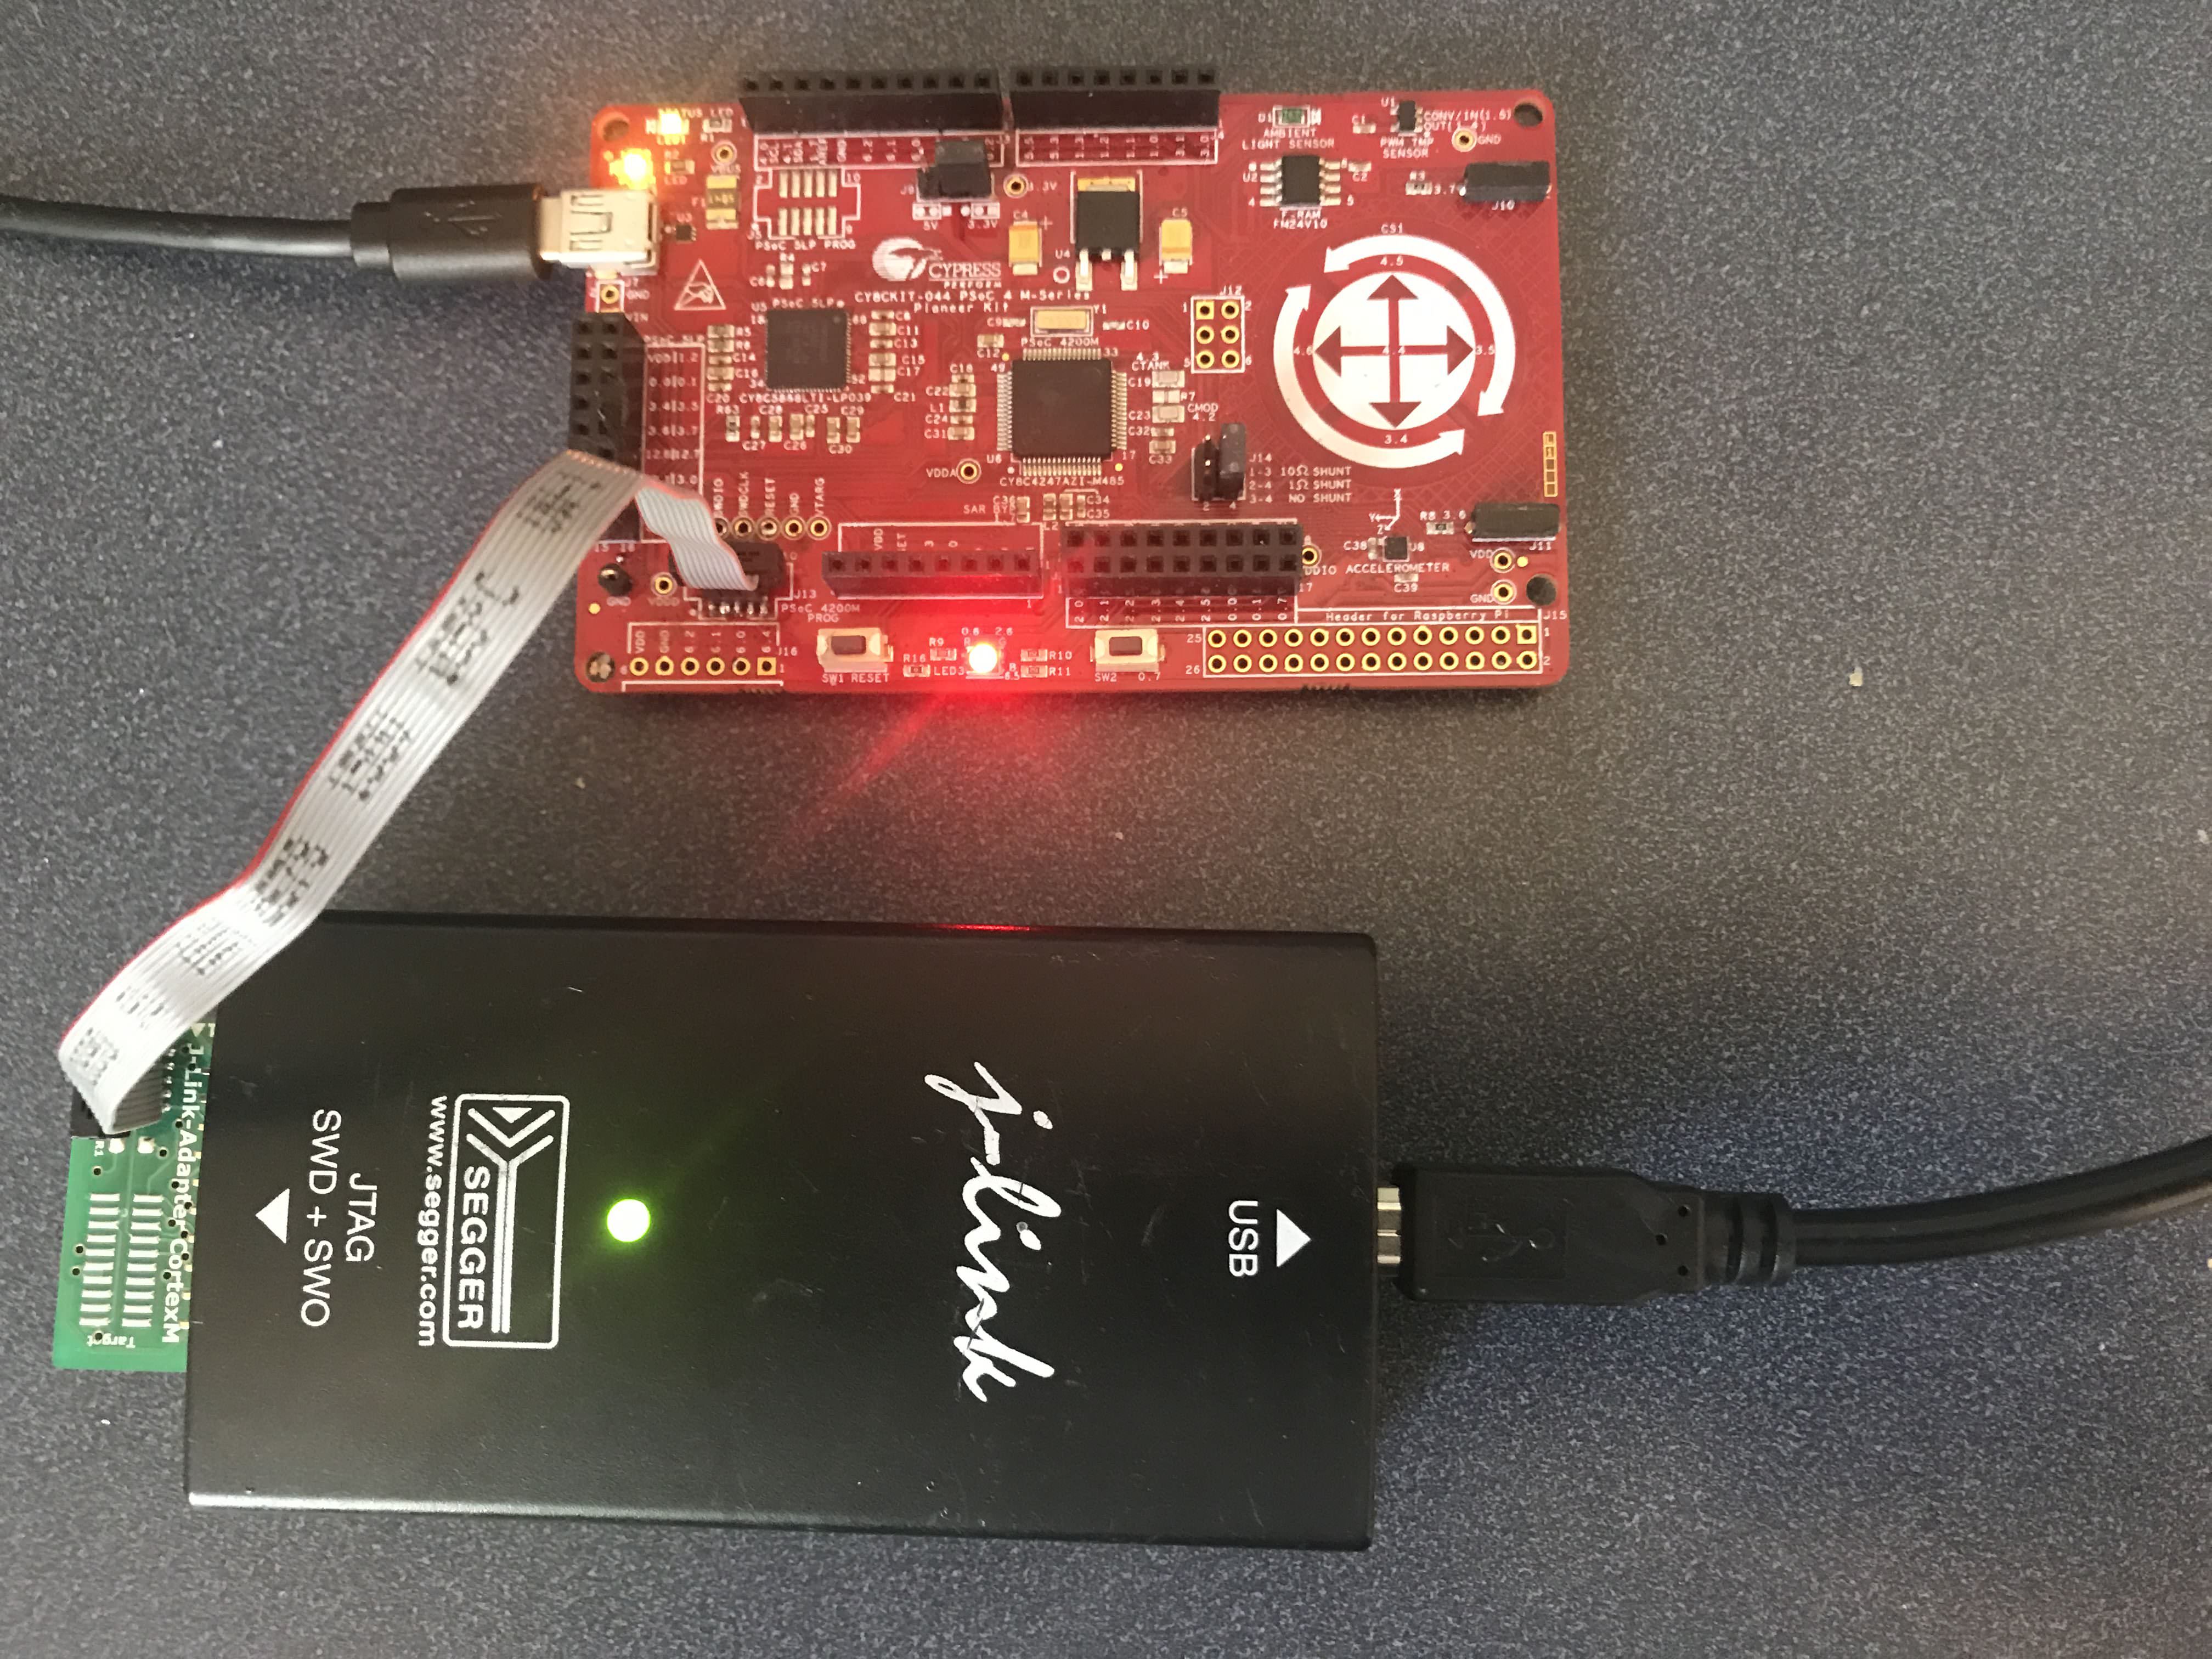
When our very good devkit team team in India built the CY8CKIT-044 (which I have used and written about quite a bit), they installed a built in debugger/programmer called “KitProg“. But they also understood that someone might want to connect some third part debugger like the JLINK. So… they put the footprint for a 10-pin ARM debugging port onto the board. (see it in the lower left). Actually if you look at the board, you can see two 10-pin footprints, the one at the top is connected to the PSoC5 (which serves as the KitProg).
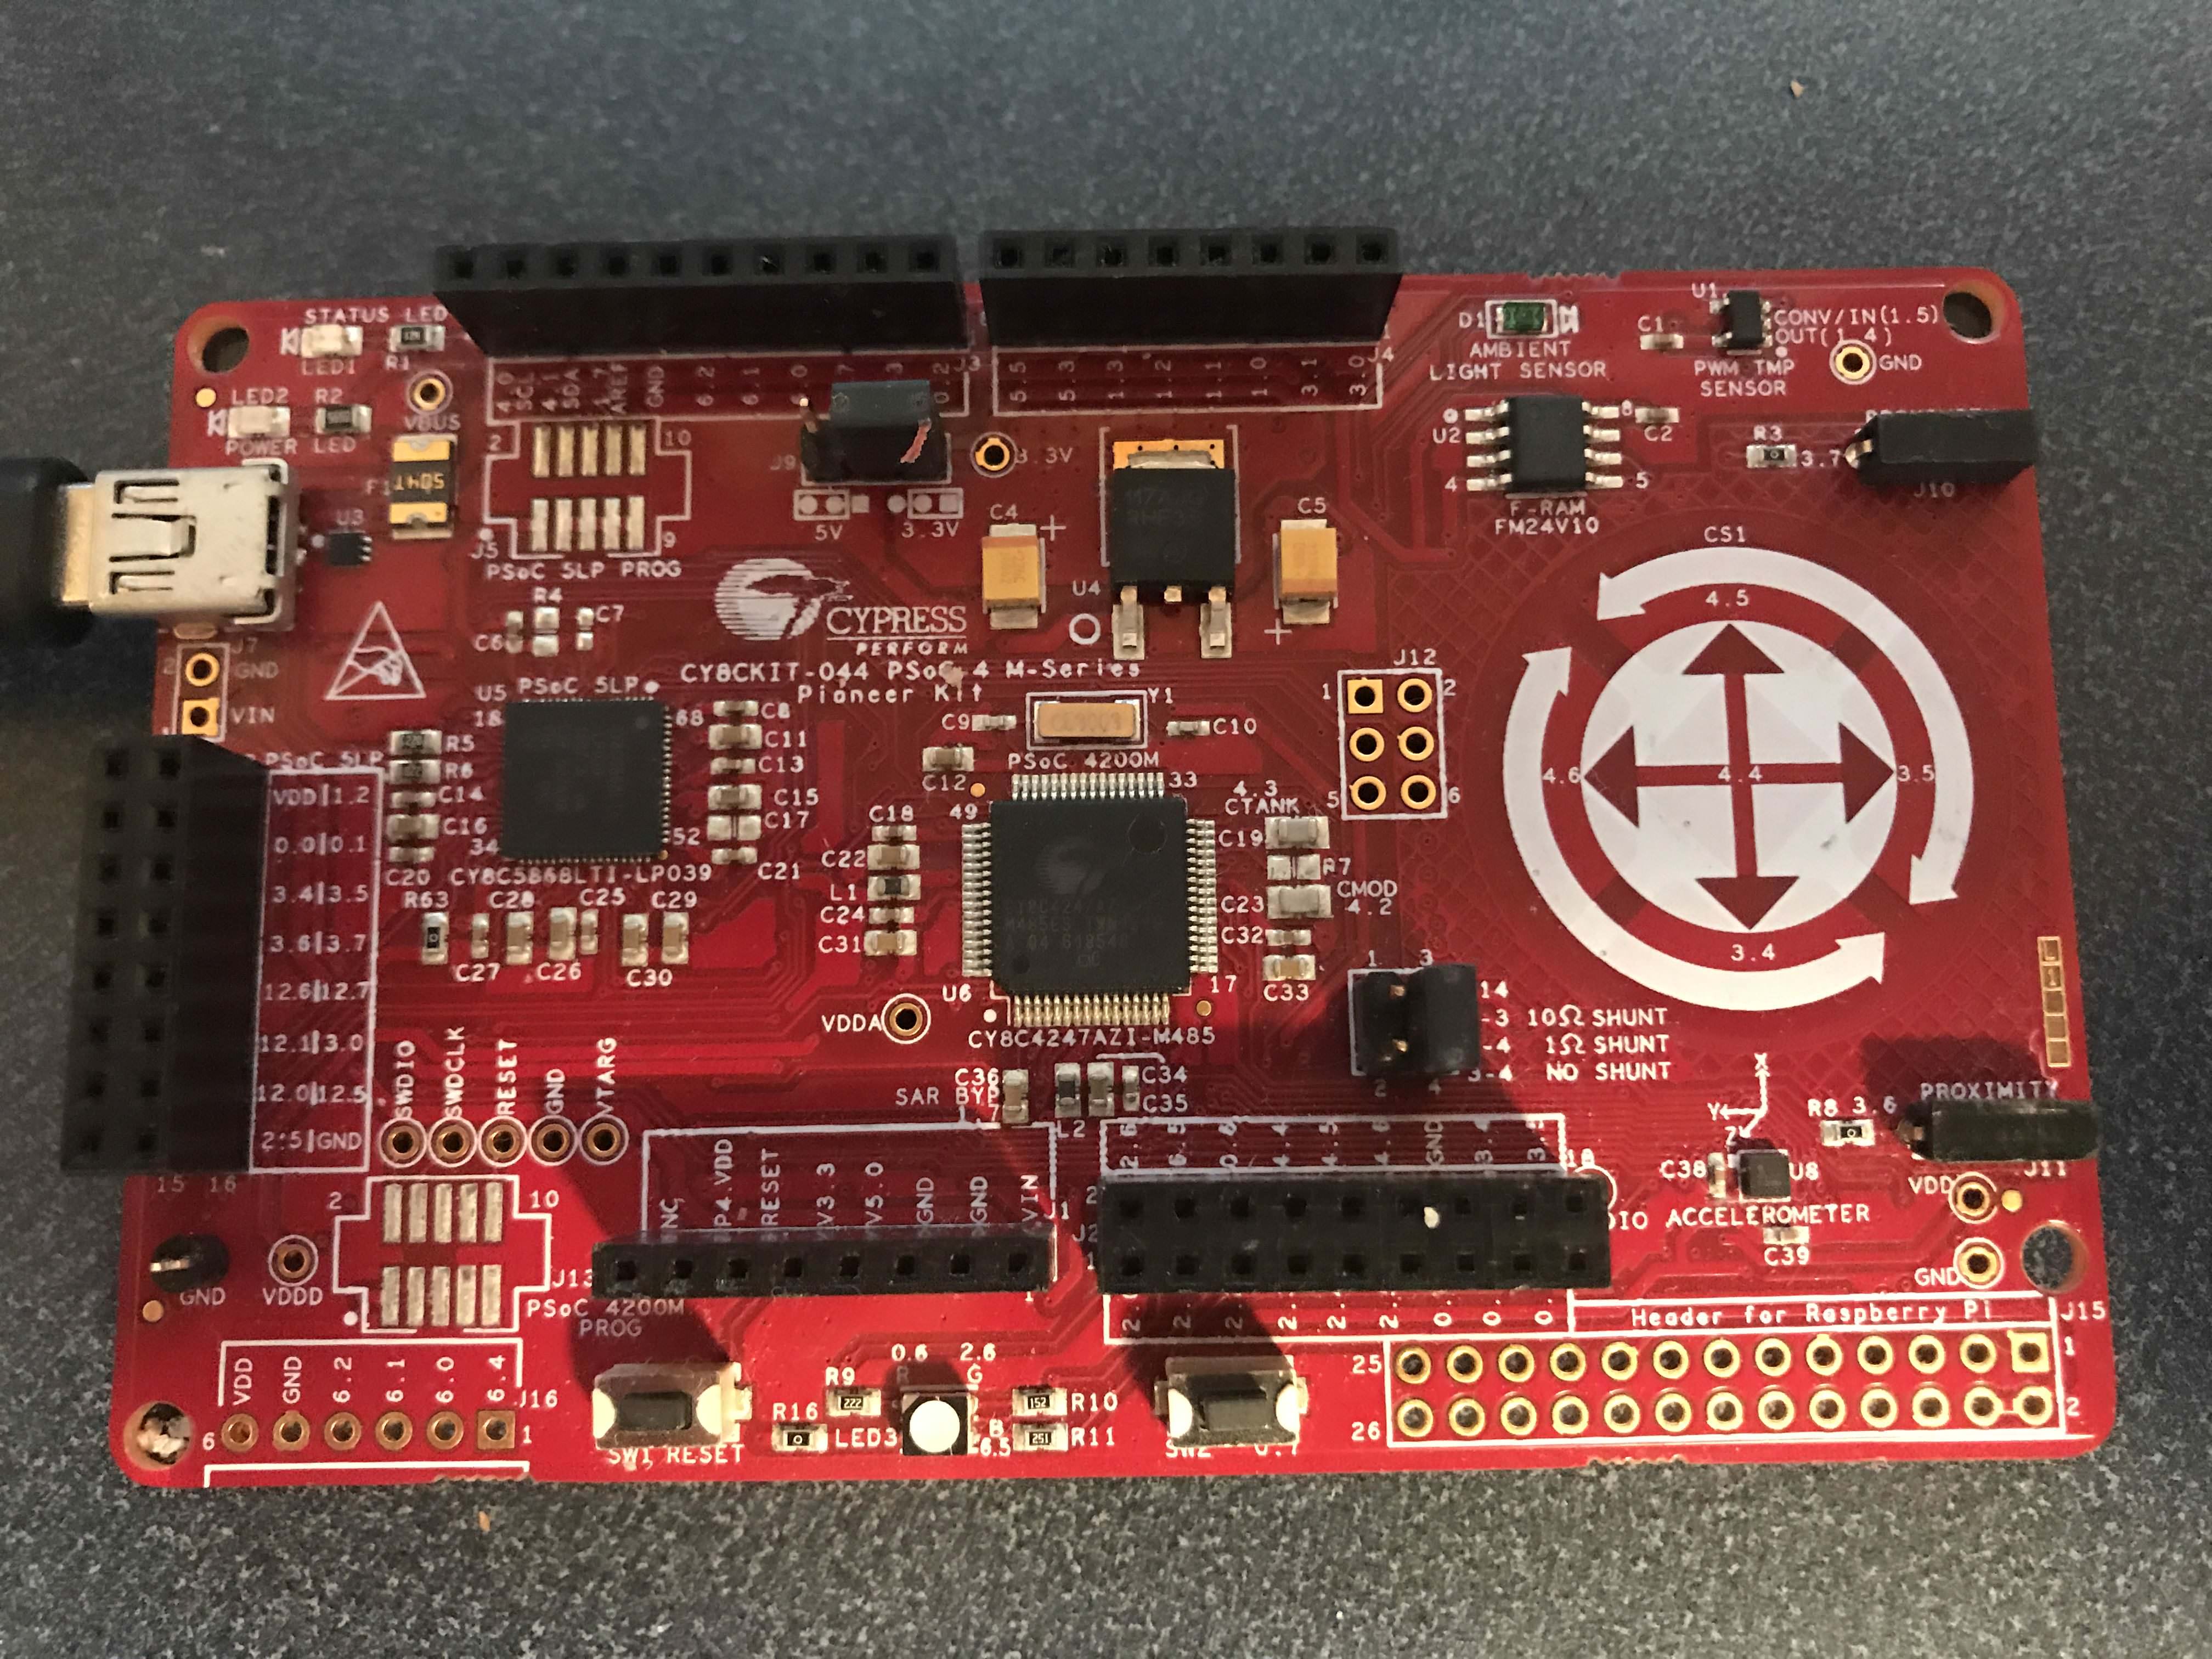
Before I can use a JLINK I needed to do this … which unfortunately ended with me burning myself with the soldering iron… bad Alan.
Tracealyzer Snapshot Mode on Blinking LED Project
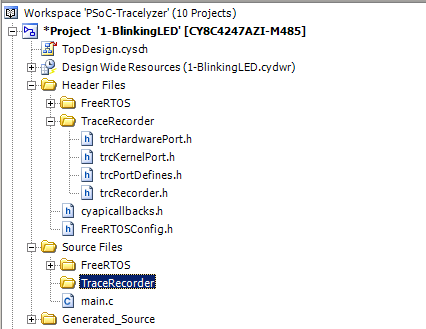
In a previous article I talked about the organization of PSoC Creator projects, specifically how to handle the situation where you want to include .h/.c files into your project but you don’t want to modify them. This is exactly what I will do with the Percepio Tracealyzer Recorder Library. The library has some files which I will want to leave intact and I will just make references to them in my project including trcKernelPort.h, trcPortDefines.h etc. And there are some files which I will want to modify, which I will copy out of the Trace Recorder Library into my project for editing trcConfig.h, trcSnapShotConfig.h and trcStreamingConfig.h
To start the first Percepio Tracealyzer example I will use the basic “Snapshot Mode”. There is good documentation on the Percepio Tracealyzer documentation website. I will start by copying the PSoC Creator Workspace from the FreeRTOS articles from GitHub. It has 9 projects in it, starting with the blinking led, going to a more complicated multi-thread project. The next step is to download the FreeRTOS Tracealyzer library from the Perceio website into a parallel directory called “TraceRecorder”.
Make a new folder for the non-changing include files called “TraceRecorder” (for the files that I don’t want to change)
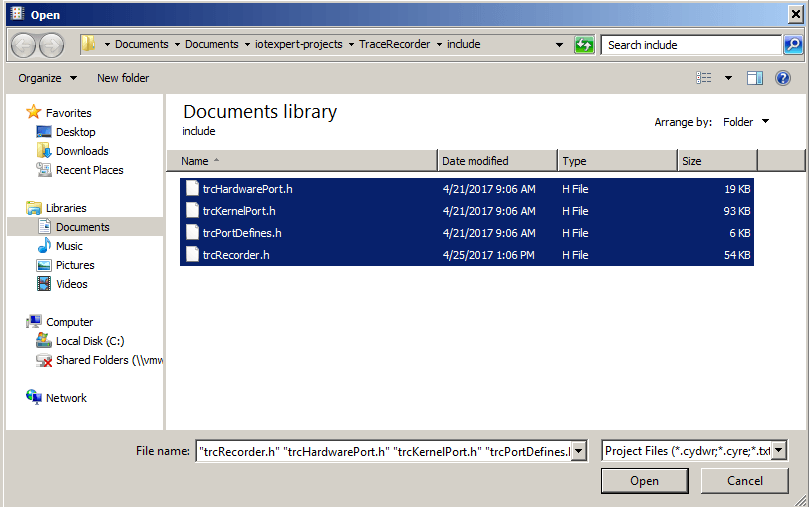
Next I will add the files that I don’t want to change to the project so that I can see them (meaning they are just referenced by PSoC Creator)

They reside in the directory TraceRecorder/include
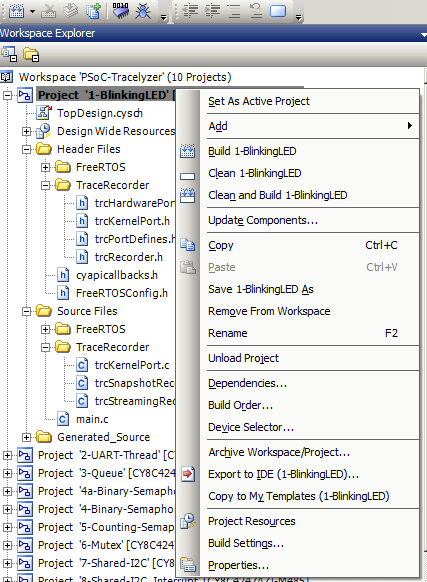
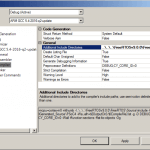
Once I have the unchanging .h’s into my project, I need to add their directory to the include path. To do this right-click on the project and select “Build Settings …”
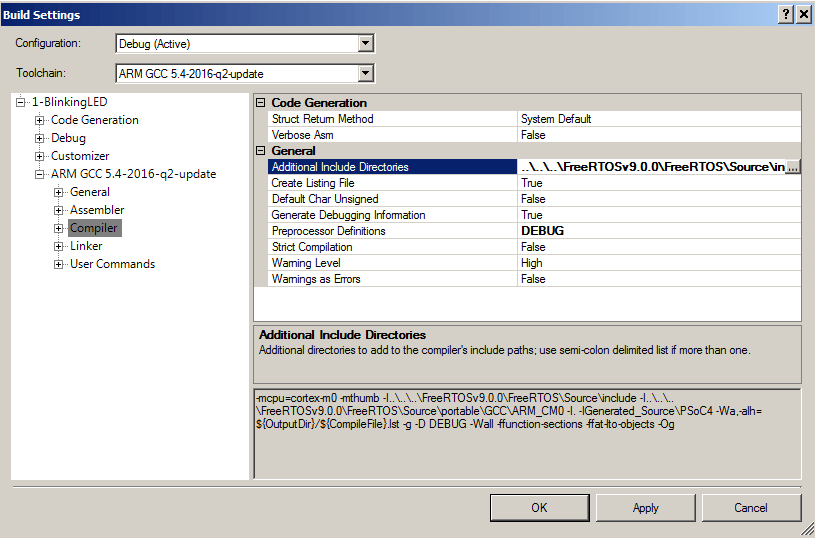
Then click “Compiler” and then the “…” on the “Additional Include Directories” line
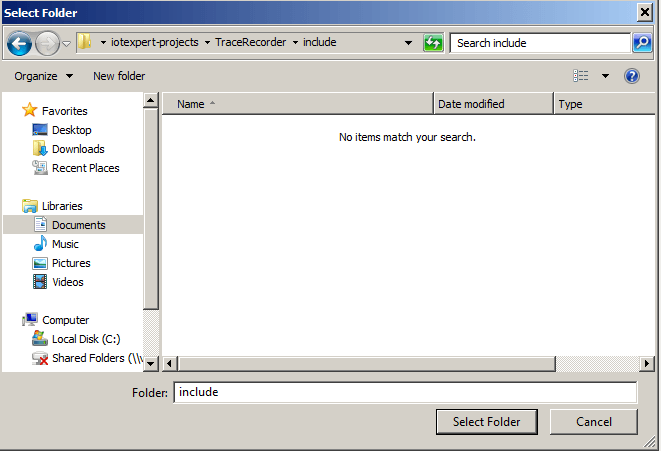
Navigate until you get to TraceRecoder/include then press “Select Folder”
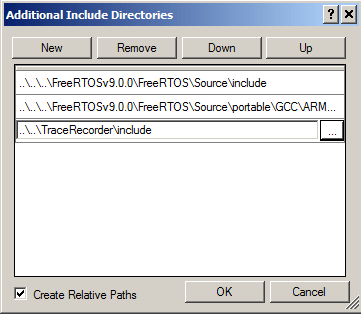
Now your include path should look like this:
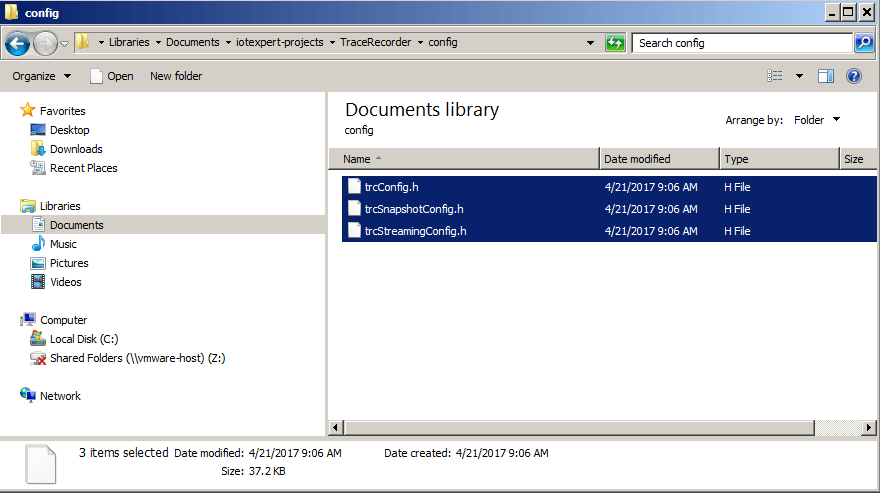
Next, I want to copy the configuration files in the Windows Explorer to my project directory so that they become a changeable part of they project. They reside in TraceRecorder/config (I just did a Ctrl-C to copy)
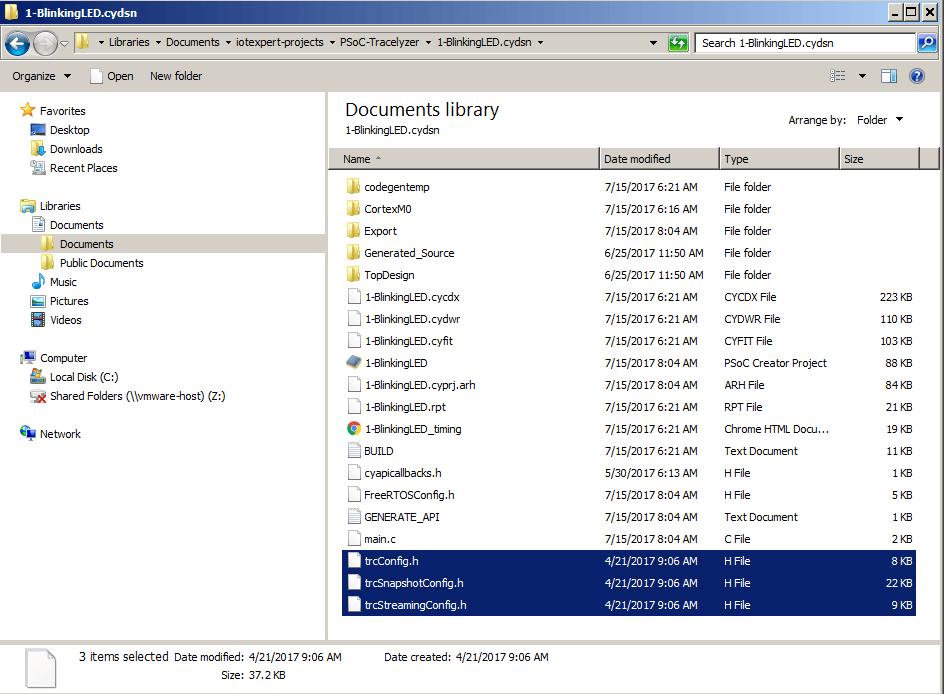
You want to paste them into your project directory
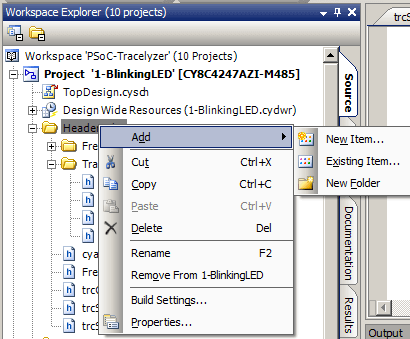
Then you need to add them to the project so that you can easily edit them by right clicking on the “Header Files” folder and selecting “Add–>Existing Item”
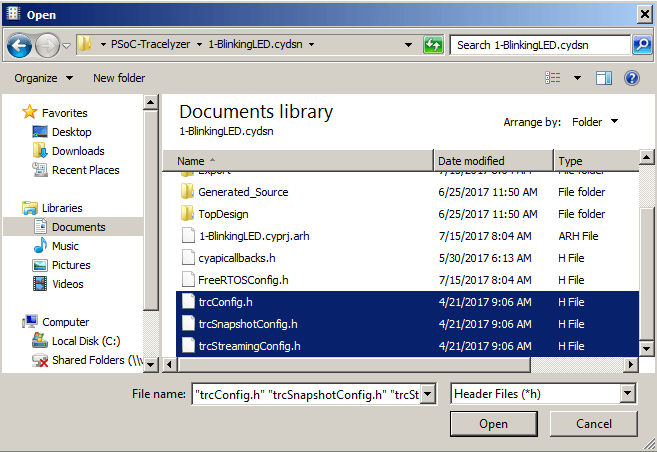
Then selecting them out of your project directory.
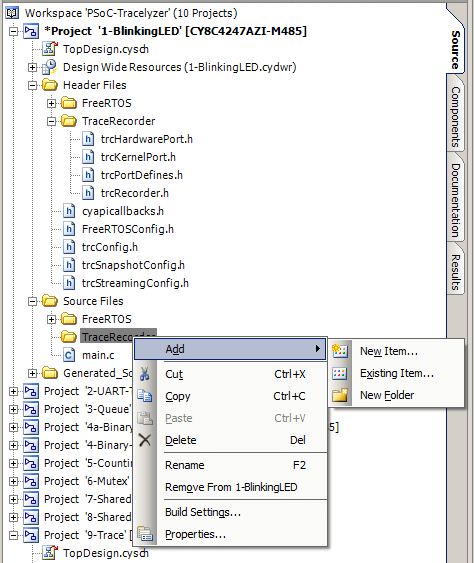
Now we need to add references to all of the .c files. Start by making a new folder for the c-files called “TraceRecorder”
Then “Add–>Existing Item…”
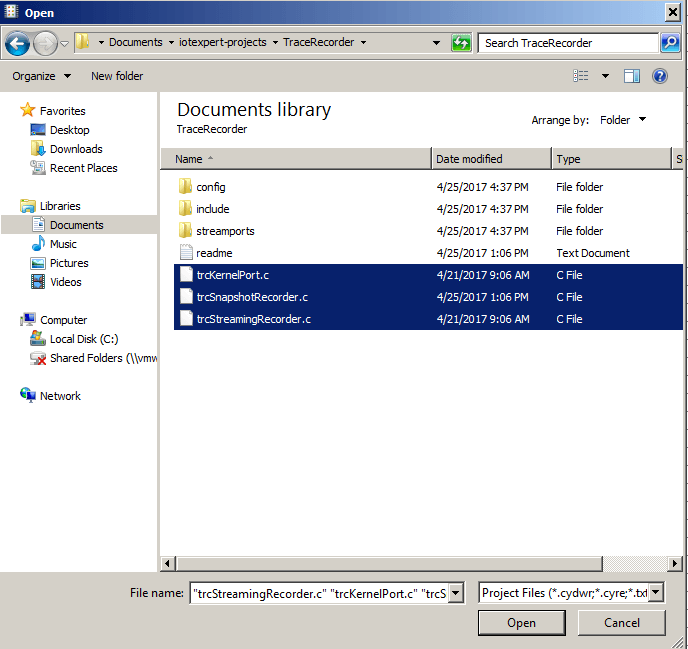
Select the files from the TraceRecorder directory
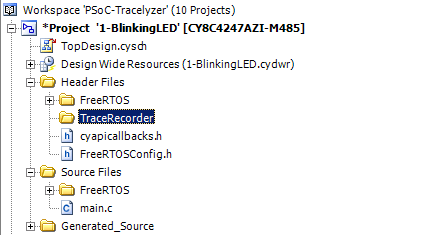
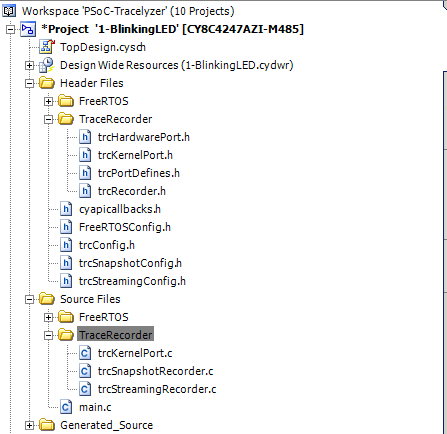
Now your project should look like this
Your project now has all of the necessary body parts so you next will modify the source files. Start with modifying FreeRTOSConfig.h to include the TraceRecorder Library stuff.
/* Integrates the Tracealyzer recorder with FreeRTOS */
#if ( configUSE_TRACE_FACILITY == 1 )
#include "trcRecorder.h"
#endif
Then modify the trcConfig.h so that it has access to all of the CMSIS header files.
/******************************************************************************
 * Include of processor header file
 *
 * Here you may need to include the header file for your processor. This is
 * required at least for the ARM Cortex-M port, that uses the ARM CMSIS API.
 * Try that in case of build problems. Otherwise, remove the #error line below.
 *****************************************************************************/
//#error "Trace Recorder: Please include your processor's header file here and remove this line."
#include <project.h>
Then tell the TraceRecorder that we are using an ARM Cortex-M
/*******************************************************************************
 * Configuration Macro: TRC_CFG_HARDWARE_PORT
 *
 * Specify what hardware port to use (i.e., the "timestamping driver").
 *
 * All ARM Cortex-M MCUs are supported by "TRC_HARDWARE_PORT_ARM_Cortex_M".
 * This port uses the DWT cycle counter for Cortex-M3/M4/M7 devices, which is
 * available on most such devices. In case your device don't have DWT support,
 * you will get an error message opening the trace. In that case, you may
 * force the recorder to use SysTick timestamping instead, using this define:
 *
 * #define TRC_CFG_ARM_CM_USE_SYSTICK
 *
 * For ARM Cortex-M0/M0+ devices, SysTick mode is used automatically.
 *
 * See trcHardwarePort.h for available ports and information on how to
 * define your own port, if not already present.
 ******************************************************************************/
//#define TRC_CFG_HARDWARE_PORT TRC_HARDWARE_PORT_NOT_SET
#define TRC_CFG_HARDWARE_PORT TRC_HARDWARE_PORT_ARM_Cortex_M
Now, you need to modify the project’s stack and heap size setup
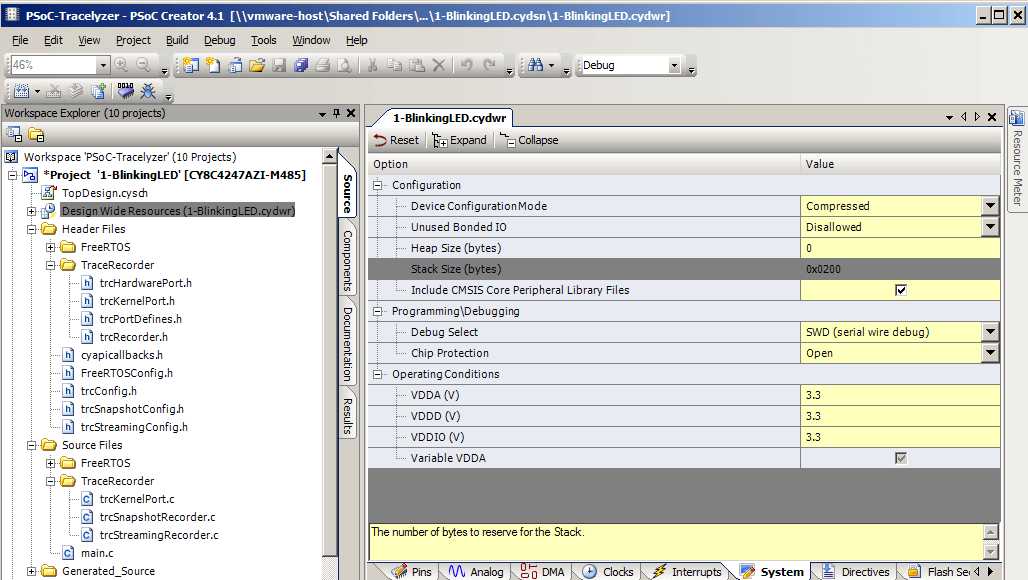
The default snapshot buffer is to big to fit into PSoC SRAM, so I change the size to 400 records
/*******************************************************************************
 * TRC_CFG_EVENT_BUFFER_SIZE
 *
 * Macro which should be defined as an integer value.
 *
 * This defines the capacity of the event buffer, i.e., the number of records
 * it may store. Most events use one record (4 byte), although some events
 * require multiple 4-byte records. You should adjust this to the amount of RAM
 * available in the target system.
 *
 * Default value is 1000, which means that 4000 bytes is allocated for the
 * event buffer.
 ******************************************************************************/
#define TRC_CFG_EVENT_BUFFER_SIZE 400
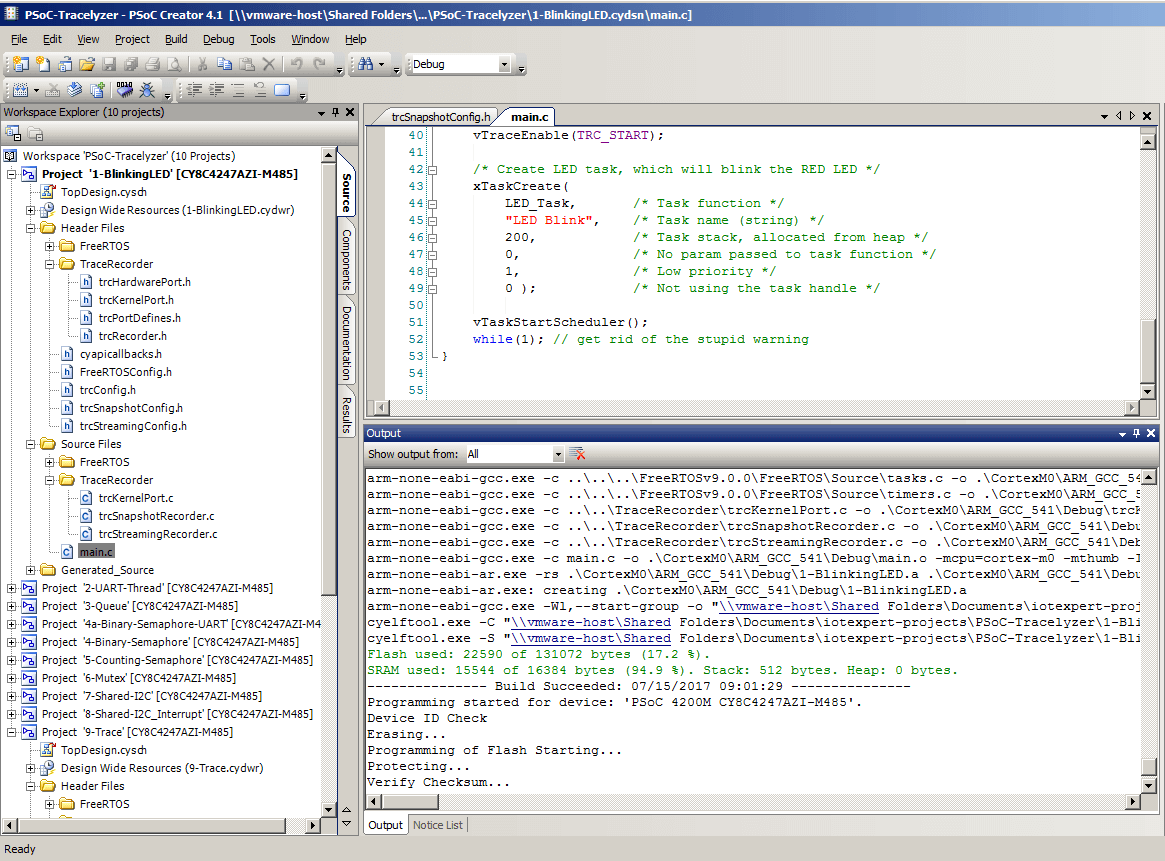
Finally modify main to start the Trace Recorder (vTraceEnable on line 40)
int main(void)
{
    CyGlobalIntEnable; /* Enable global interrupts. */

    setupFreeRTOS();
    vTraceEnable(TRC_START);

    /* Create LED task, which will blink the RED LED */
    xTaskCreate(
        LED_Task,       /* Task function */
        "LED Blink",    /* Task name (string) */
        200,            /* Task stack, allocated from heap */
        0,              /* No param passed to task function */
        1,              /* Low priority */
        0 );            /* Not using the task handle */

    vTaskStartScheduler();
    while(1); // get rid of the stupid warning
}
Testing the Output
After all of the setup is done you can build and program the development kit.
Plug in the Segger J-Link
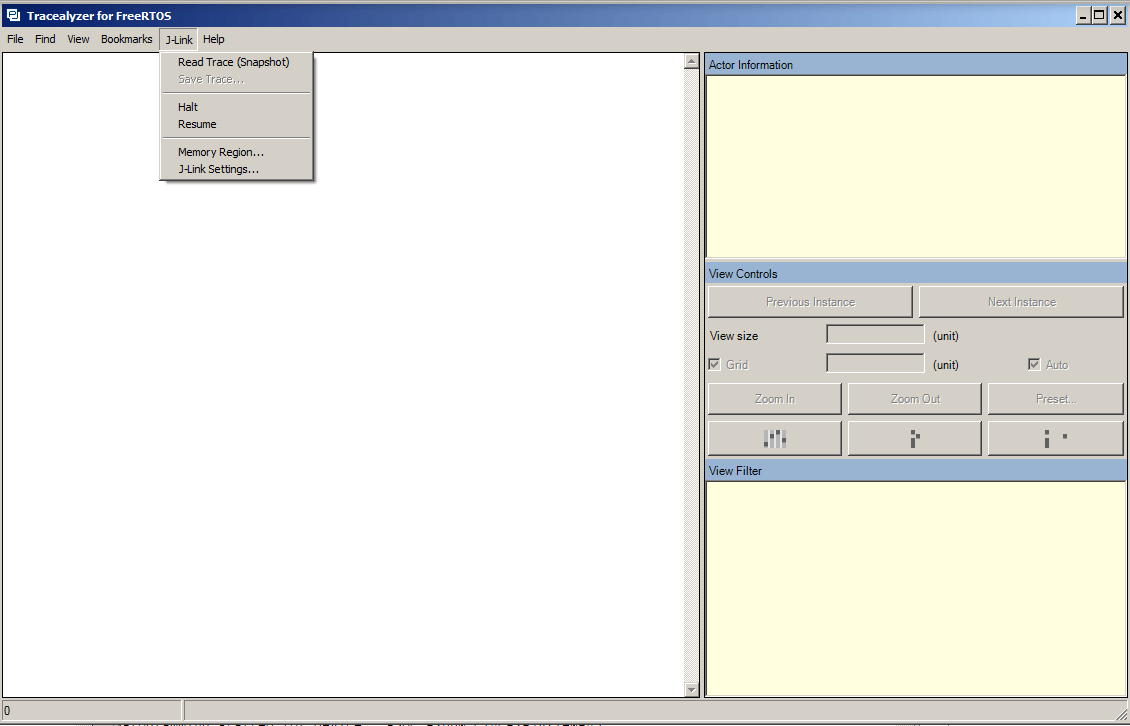
Start Tracealyzer then setup the J-Link (click on J-Link Settings…)
Select “Select Device…”
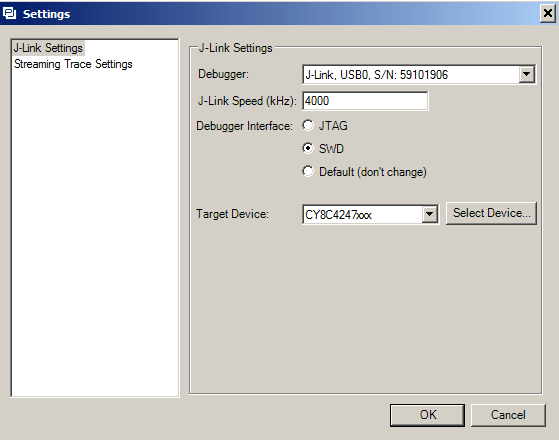
Filter the list to “cypress” then choose the “CY8C4247xxx” (which is the chip that is on the C8CKIT-044)

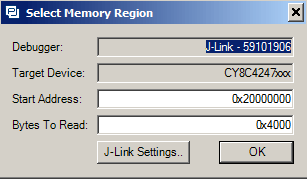
Then Select “Jink->Read Trace”

Accept the defaults (this window only is only brought up the first time)
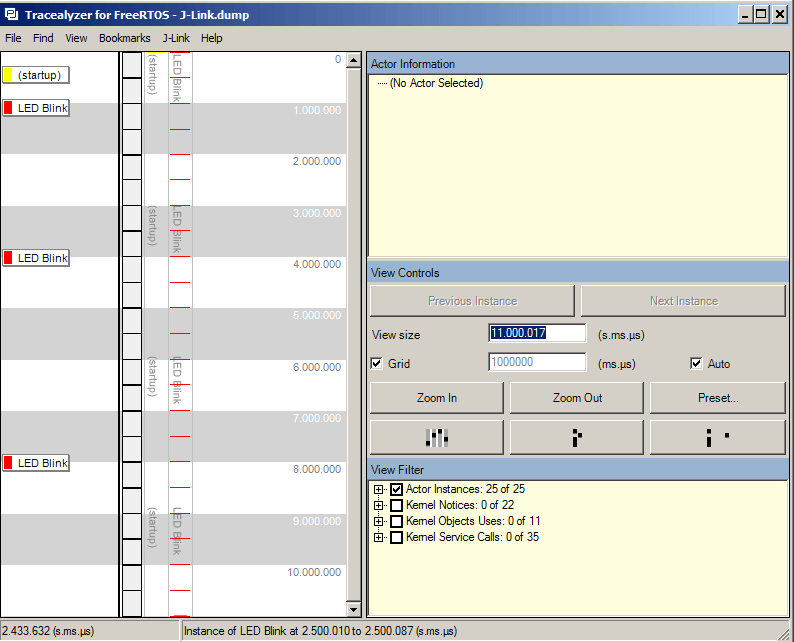
Then you will end up with a screen like this. Each stripe of white/gray is 1 second in time. The yellow line is where the startup occurred. The red lines are where the “LED Blink” task was running. This seems to make sense as you get a tiny red line 2x/second (remember in the source code we have a 500ms delay so that makes sense).
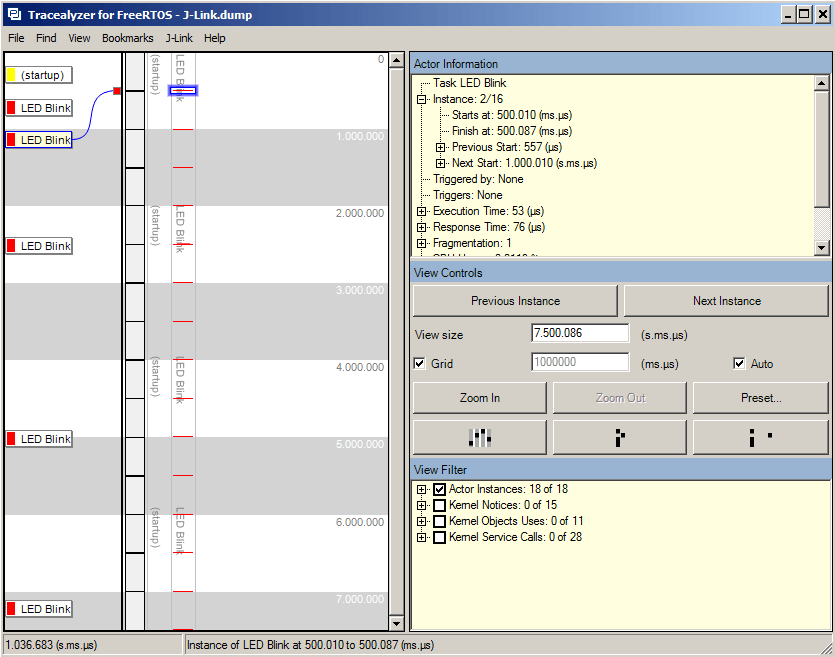
Next I press the reset button on the devkit and re-run the trace. Then I click on the second red line and the window on the right gives me information about that task. You can see that the task ran for 53uS and took 23uS to start (time taken up in the FreeRTOS scheduler and Percepio Tracealyzer Recorder Library)
Conclusion
Obviously the snapshot mode is limited by the size of the RAM buffer that you allocate but it saves you the hardware resources and timing constraints that are required to stream FreeRTOS data. In the next several articles I will show you how to:
- Use Segger JLINK RTT streaming
- Make a streaming port
- Use some of the other screens in the Percepio Tracealyzer
As always you can find all of these projects on the IotExpert GitHub site or git@github.com:iotexpert/PSoC-Tracelyzer.git
Article
Description
Percepio Tracealyzer & PSoC
An Introduction to Percepio Tracealyzer on the Cypress PSoC
Percepio Tracealyzer RTT Streamport - PSoC4200M
Make the JLINK RTT Library work with Tracealyzer
Percepio Tracealyzer PSoC UART Streamport
Creating a UART Streamport
Percepio Tracealyzer - Analyzing the PSoC Tracealyzer Streamport
Figure out what is broken in the UART Streamport
Percepio Tracealyzer - Using PSoC DMA to Fix the UART Streamport
Implementing PSoC DMA to improve the CPU Utilization
Percepio Tracealyzer - Running on PSoC6
Porting the Percepio Tracealyzer to PSoC6

4 Comments
Thanks for this blog post :),
do you know any tool to profile non RTOS applications?
I don’t have a good answer… unfortunately.
thanks for this detailed summary; is there documentation for other FPGAs/processor types? Where did you get the basic data? is it in percepio manuals? Thanks
I have not used anything other than PSoC. As far as the documentation goes, I got it from Percepio and from Segger… Mostly everything else I just figured it out.
Alan